Chapter 2 Notes: Economic Challenges Facing Business Today
2.1 Microeconomics: The Forces of Demand and Supply
Microeconomics studies human choices and resource allocation among individuals, families, and businesses.
Core idea: demand and supply drive the prices and quantities of goods and services in markets.
Demand: willingness and ability of buyers to purchase at different prices.
Supply: the amount of goods and services sellers are willing to offer at different prices.
Demand and supply determine prices and quantities through interaction.
Demand Drivers (factors that influence how much people want to buy):
Price of the good itself
Consumer preferences
Number of buyers in the market
Income of buyers
Prices of substitute goods
Prices of complementary goods
Buyer expectations about future prices and income
Examples illustrating demand drivers and concepts:
Starbucks expansion in China: Growth in demand due to a rising middle class and Western-brand affinity for coffee.
Restaurants offering vegetarian/vegan options: Illustrates a response to changing consumer preferences.
Law of demand: as the price of a good rises, the quantity demanded falls (and vice versa).
Demand curve: downward-sloping graph showing the quantity buyers will purchase at each price.
Example (Gasoline): At price per litre, quantity demanded ~13 million litres; at , ~19 million litres; at , ~29 million litres. This shows the inverse relationship between price and quantity demanded.
Change in Quantity Demanded vs. Change in Demand:
Change in quantity demanded = movement along the same demand curve as only price changes.
Change in overall market demand = shift of the entire demand curve (to the right for an increase, to the left for a decrease).
A rightward shift indicates higher demand at every price; a leftward shift indicates lower demand.
Factors that shift the demand curve:
Customer preferences
Number of buyers
Buyers’ incomes
Prices of substitutes
Prices of complements
Future income expectations
Substitutes vs. Complements:
Substitutes: two goods where an increase in the price of one raises the demand for the other (e.g., pizza vs. hamburgers).
Complements: two goods where an increase in the price of one reduces the demand for the other (e.g., peanut butter and jelly; computers and software).
Supply Drivers (factors that influence sellers’ willingness/ability to supply):
Costs of inputs (natural resources, capital, etc.) and technology
Taxes and government regulations
Number of suppliers in the market
Changes in production technology that lower costs
Supply curve: shows the relationship between price and quantity supplied; movement along the curve occurs as price changes. (Regardless of demand, will only apply to what price it costs them to produce)
When input costs rise, the supply curve shifts left (less supply at each price); when costs fall, it shifts right (more supply).
Factors that Shift the Supply Curve:
Costs of inputs: Decrease → shift right; Increase → shift left
Costs of technologies: Decrease → shift right; Increase → shift left
Taxes: Decrease → shift right; Increase → shift left
Number of suppliers: Increase → shift right; Decrease → shift left
Example illustrating supply dynamics:
Spud.ca (local/organic produce): Responding to higher demand for local produce by providing an online grocery model and involvement in the Eat Local coalition.
Interaction of Supply and Demand:
Equilibrium price and quantity are found where supply and demand curves intersect.
At equilibrium, the market clears, meaning quantity supplied equals quantity demanded.
Example (Gasoline): Equilibrium at and .
Disequilibrium Outcomes:
Surplus: price above equilibrium, quantity supplied > quantity demanded; creates pressure for the price to fall.
Shortage: price below equilibrium, quantity demanded > quantity supplied; creates pressure for the price to rise.
Example illustrating market dynamics:
Athleisure business model: Shows a market driven by rising demand due to lifestyle trends, intense competition (Nike, Athleta, Adidas), and strategies involving product differentiation and pricing.
Assessment Checkpoint:
Key Distinction: Understand the difference between demand shifts (entire curve moves due to non-price factors) and changes in quantity demanded (movement along the curve due to price changes).
Recognize Impacts: Broader macro factors (e.g., energy sources, global oil demand) can significantly shift demand curves.
2.2 Macroeconomics: Issues for the Entire Economy
Macroeconomics studies a country’s overall economic issues, focusing on outputs, unemployment, inflation, and living standards.
It analyzes how economies allocate resources on a national and global scale and how government policies affect the overall economy.
Economic Systems Overview:
Private enterprise systems (capitalism/market economies): Competition regulates economic life; governments tend to be hands-off in ownership and resource allocation.
Four Basic Competition Types in a Private Enterprise System:
Pure competition: Many buyers and sellers; homogeneous products; no single firm can influence price; easy entry/exit. (Example: Small-scale farming).
Monopolistic competition: Many buyers/sellers; differentiated products; some price control by firms. (Example: Pet food market where brands differentiate products).
Oligopoly: Few sellers; high entry barriers; interdependent pricing; firms may act similarly. (Examples: Steel, aircraft manufacturing, automobiles).
Monopoly: Single seller; high barriers; potential for price control; regulated or unregulated. (Example: Utility companies in some regions).
Major Economic Systems:
Private enterprise (capitalism): Private ownership, market-driven profits and competition.
Planned economies (communism/socialism): Government ownership/control of means of production; planners set outputs.
Mixed economies: Blend of private and public sector elements; many countries (e.g., Canada, France) blend ownership and policies.
Key Historical Notes and Examples:
Communism (e.g., Soviet Union): Characterized by central government ownership, little private property; historically marked by inefficiencies and shortages; limited consumer choices.
China: Illustrates a shift toward market-oriented reforms, allowing more private ownership and local decision-making while retaining central planning elements.
Socialism: Government ownership of major industries; private ownership allowed in some sectors; mix varies by country.
Privatization (e.g., Air Canada in 1989): The process of converting state-owned enterprises to private ownership.
Assessment Check 2.2:
Difference between pure and monopolistic competition: Pure competition has many sellers with homogeneous products and no price influence; monopolistic competition allows for product differentiation and some price control.
Canada’s economic system: Primarily a private enterprise/private ownership system with government involvement (it is a mixed economy).
Privatization: The conversion of government-owned and operated companies into privately held businesses.
2.3 Evaluating Economic Performance
Ideal economic performance aims for two benefits: a stable business environment and sustained growth.
A stable environment ensures ample supplies at affordable prices and sufficient purchasing power by aligning supply and demand.
Growth means steady increases in the production of goods/services and living standards over time.
The Business Cycle (stages of economic activity):
Prosperity: Low unemployment, high consumer confidence.
Recession: Economic contraction, reduced spending, layoffs, depleted savings.
Depression: Prolonged downturn; typically severe and deep.
Recovery: Improved spending, rising activity.
Productivity: relationship between outputs and inputs; higher productivity boosts growth and living standards.
General formula:
Labour productivity is a common focus: output per hour.
GDP and productivity (measures of output and living standards):
GDP (Gross Domestic Product): The sum of all goods/services produced within a country in a period.
GDP per capita = GDP \div population; useful for comparing living standards.
Example (Top Economies by PPP GDP as of 2020): China, United States, India, Japan, Germany, Russia, Indonesia, Brazil, United Kingdom, France. These figures help compare the relative economic size and living standards across nations.
Price Level Changes and Inflation/Deflation:
Inflation: A sustained rise in prices; reduces purchasing power; linked to demand-pull and cost-push factors.
Hyperinflation: An extreme case of inflation (e.g., historical example of Zimbabwe).
Core inflation: Inflation rate excluding energy and food prices (provides a less volatile measure).
Deflation: Falling prices; can reduce spending and hurt the economy.
The Consumer Price Index (CPI): Tracks monthly price changes in a market basket of goods and services (e.g., shelter, food, transportation are largest components).
Producer Price Index (PPI): Tracks prices received by producers.
Unemployment as an Economic Health Indicator:
Total labour force: Includes those willing and able to work.
Unemployment rate: The share of the labour force actively seeking work but without jobs.
Four Unemployment Types:
Frictional: Temporarily between jobs (e.g., new graduates looking for their first job).
Seasonal: In sectors with seasonality (e.g., farm workers, construction workers in winter).
Cyclical: Due to economic downturns; layoffs during recessions.
Structural: Skills no longer match job opportunities; long-term unemployment requiring retraining.
Assessment 2.3:
Four stages of the business cycle: Prosperity (low unemployment, strong consumer confidence), Recession (consumers postpone major purchases, layoffs occur, household savings deplete), Depression (economic slowdown continues in a downward spiral over a long period of time), Recovery (consumers postpone major spending begins to increase, consumer spending increases,. Business activity accelerates,. Increased job opportunities)
Measures of economic health: GDP, price levels (CPI, core inflation), and the unemployment rate.
2.4 Managing the Economy’s Performance
Monetary policy: Central bank actions (e.g., Bank of Canada, Federal Reserve) to influence money supply, banking requirements, and interest rates to steer spending and investment.
Expansionary monetary policy: Increases money supply to lower borrowing costs and stimulate growth.
Restrictive monetary policy: Reduces money supply to curb inflation or overheating; raises interest rates.
Quantitative easing: An expansionary policy where the central bank buys government bonds/assets to inject liquidity into the economy.
Examples: The Bank of Canada governor (Tiff Macklem) oversees policy; the Federal Reserve System (the Fed) in the US sets policy.
Fiscal policy: Government spending and taxation decisions to influence growth, inflation, and unemployment.
Government revenues come from taxes/fees; expenditures fund various programs.
Deficits: Occur when spending exceeds revenue; national debt arises from accumulated past deficits.
Example (International Fiscal Policy): World Bank funding for Sierra Leone to support recovery shows international efforts to influence economies through fiscal means.
The federal budget: An annual plan for revenues and expenditures; affects infrastructure, defense, education, healthcare, etc.
Assessment 2.4:
Difference between expansionary vs. restrictive monetary policy: Expansionary policy increases money supply and/or reduces interest rates to stimulate activity, while restrictive policy reduces money supply and/or raises interest rates to curb inflation.
Primary sources of government funds: Taxes, fees, and borrowing.
A balanced budget does not erase the national debt; it simply avoids increasing it in that specific period.
2.5 Global Economic Challenges
Global interdependence: No country is an economic island; multinational corporations operate across borders; global risks are rising in importance.
World Economic Forum Global Risks Report (Top 10 Economic Risks by likelihood/impact):
Climate action failure
Extreme weather
Biodiversity loss
Erosion of social cohesion
Livelihood crises (working-age population challenges)
Infectious diseases
Human environmental damage
Natural resource crises
Debt crises
Geoeconomic confrontation
Global trade risks for Canadian firms: Need to monitor foreign suppliers; historical issues (e.g., lead paint) in imported products highlight regulatory and quality concerns arising from globalization.
Growth benefits of global expansion for Canadian firms:
Access to a larger customer base
Potential cost advantages through cheaper production in other regions
Example (Innovation and Global Solutions):
Breakthrough Energy Coalition (Bill Gates): A global coalition committing to invest in energy innovations to reduce carbon emissions and create jobs, accelerating deployment of new energy technologies.
Example (Productivity Improvement - UPS ORION system):
Amazon’s ORION system (On-Road Integrated Optimization and Navigation): A real-world productivity improvement case illustrating how data, routing optimization, and mobile technology lead to significant efficiency gains. It reduces fuel consumption by up to 45 million litres/year and CO2 emissions by ~100,000 tonnes/year by analyzing up to 200,000 route options per delivery route. This directly boosts productivity, GDP, and living standards.
Career example:
Job role: Economic Analyst: Studies GDP, inflation, employment, housing, taxes, exchange rates, stock prices; analyzes data to forecast trends and advise business decisions. Requires an undergraduate economics degree, strong analytical skills, and ability to interpret data.
Critical Areas Revisited:
Unemployment types and policy implications: Frictional, seasonal, cyclical, and structural unemployment require different policy responses (e.g., training programs, wage subsidies, macroeconomic stimulus, labor market reforms).
Case Studies and Illustrative Examples (Summaries & Questions)
1. UPS ORION System
Summary: UPS developed ORION, an optimization system using data, mobile technology, and cloud computing to calculate the most efficient delivery routes. This results in substantial productivity gains and significant reductions in fuel consumption and CO2 emissions by optimizing for up to 200,000 route options per delivery.
Relevance: A prime example of how technology investment boosts productivity, which in turn drives GDP growth and raises living standards.
2. Pawnshops
Summary: Pawnshops serve as alternative lenders providing short-term financing using collateral. They often operate with less regulation than traditional banks. Online platforms have expanded their reach.
Relevance: Illustrates a market where individuals access immediate funds but often face higher interest rates and fewer consumer protections due to their unique, often low-regulation, operating model.
3. Canarm Ltd. (Growth through Innovation and Outward-Facing Strategy)
Summary: Canarm, originating in 1934, diversified into lighting, HVAC, and livestock equipment, growing through strategic acquisitions. They emphasize customer-centric product development (e.g., Easy Connect) and leverage global supply chains with manufacturing sites in Ontario, Illinois, and China. Recognized as one of Canada’s Best Managed Companies, Canarm's leadership focuses on agility and customer needs.
Relevance: Highlights strategies for business growth through diversification, mergers and acquisitions, customer-centric innovation, and effective management of global supply chains.
Key questions arising from these cases:
What drives new product development at Canarm? (Answer: Customer needs, market demand, and technological advancements).
How important were mergers in Canarm’s evolution? (Answer: Mergers were crucial for expanding product lines, entering new markets, and acquiring resources and capabilities).
How could Canarm further develop new product categories (e.g., renewable energy) via mergers or partnerships? (Answer: By acquiring specialized companies or forming strategic alliances to gain expertise and market access in new areas).
Quick Reference: Key Terms and Concepts (glossary)
Budget deficit: Government spending exceeds revenue in a period.
Budget surplus: Revenues exceed expenditures in a period.
Balance budget: Revenues equal expenditures; does not erase national debt.
Budget: Government plan for raising and spending money in a period.
Capitalism / private enterprise: Market-driven systems with private ownership and competition.
Communism: State ownership of all means of production; centralized planning.
Socialism: Government ownership of major industries with private ownership in other sectors.
Mixed economy: Blend of public and private ownership with varying degrees of government intervention.
GDP: Sum of all goods/services produced within a country in a period.
GDP per capita: GDP divided by population.
PPP (Purchasing Power Parity): An economic metric that compares GDP across countries using prices in the United States as a reference.
CPI (Consumer Price Index): A measure of monthly price level changes for a market basket of goods and services.
Core inflation: CPI excluding energy and food prices.
PPI (Producer Price Index): Measures changes in prices received by domestic producers.
Productivity: Output per unit of input; total productivity =
Unemployment types: Frictional, seasonal, cyclical, structural.
Equilibrium: The price-quantity pair where supply equals demand; at this point, the market clears.
Monetary policy: Central-bank actions to influence money supply and interest rates.
Expansionary monetary policy: Increase money supply and/or reduce interest rates to stimulate activity.
Quantitative easing: Asset purchases by a central bank to inject liquidity.
Fiscal policy: Government taxation and spending decisions to influence the economy.
Global risks: Climate action failure, extreme weather, biodiversity loss, erosion of social cohesion, livelihood crises, infectious diseases, human environmental damage, natural resource crises, debt crises, geoeconomic confrontation.
Breakthrough Energy Coalition: A consortium of investors (led by Gates and others) aimed at accelerating energy innovations to reduce carbon emissions and create jobs.
Remarks on Links to Foundational Principles (Emphasizing Testable Concepts)
The microeconomics section reinforces the fundamental law of demand: price and quantity demanded are inversely related (ceteris paribus).
The supply side emphasizes how costs, technology, taxes, and the number of suppliers shift the supply curve, influencing market outcomes beyond a simple price change.
Macroeconomics connects market behavior to policy instruments (monetary and fiscal) and to broader societal goals such as stable growth and unemployment reduction.
1. How does microeconomics affect business? How does macroeconomics affect business? Why is it important for businesspeople to understand both?
Microeconomics affects business by focusing on individual markets, prices, supply and demand, and consumer behavior. It helps businesses make decisions about pricing, production, and marketing.
Macroeconomics looks at the overall economy, including inflation, unemployment, GDP, and interest rates. It affects business through changes in economic policy, consumer spending, and overall market conditions.
Understanding both is important because businesses need to make informed decisions. Micro helps them operate efficiently; macro helps them prepare for economic shifts.
2. Supply & Demand Graph Scenarios (Explanation):
For each scenario, imagine basic supply and demand curves (with price on the Y-axis and quantity on the X-axis):
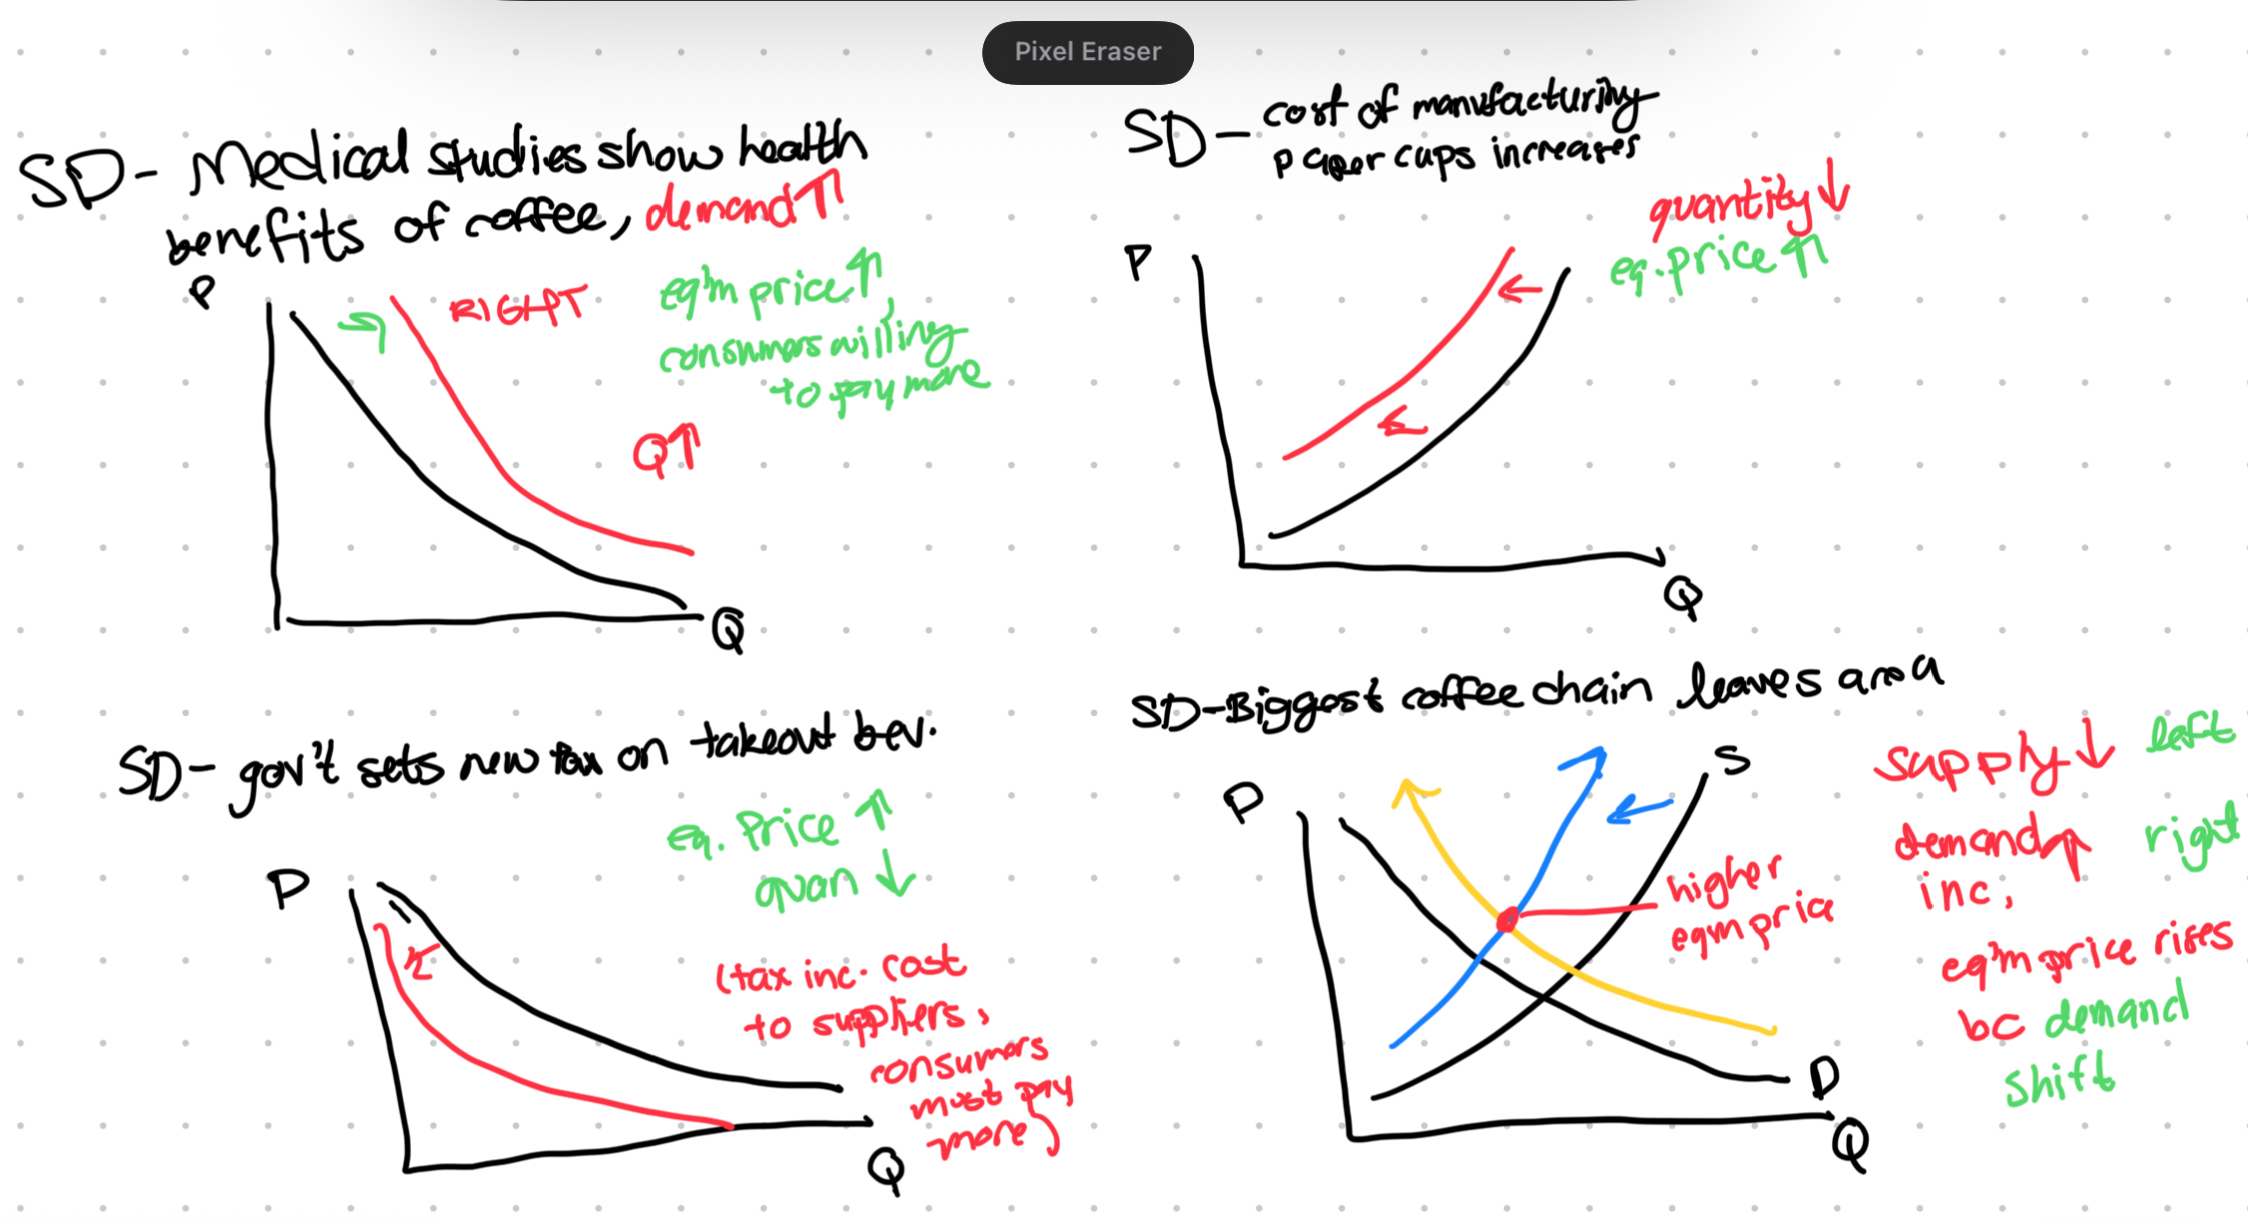
a) Medical studies show health benefits of coffee:
Demand increases → demand curve shifts right
Equilibrium price rises, and quantity increases
b) Cost of manufacturing paper cups increases:
Supply decreases (higher production costs) → supply curve shifts left
Equilibrium price rises, quantity decreases
c) Government sets a new tax on takeout beverages:
Supply decreases (tax increases cost to suppliers) → supply curve shifts left
Equilibrium price rises, quantity decreases
d) Biggest coffee chain leaves the area:
Supply decreases → supply curve shifts left
Possibly, demand increases for remaining shops → demand shifts right
Equilibrium price rises significantly, depending on demand shift
3. Describe the four types of competition:
Type of Competition | Description |
Perfect Competition | Many sellers, identical products, easy entry (e.g., agriculture) |
Monopolistic Competition | Many sellers, similar but differentiated products (e.g., restaurants, clothing stores) |
Oligopoly | Few large sellers, significant barriers to entry, often interdependent (e.g., airlines, cell providers) |
Monopoly | One seller dominates the market, high barriers to entry (e.g., utilities) |
Examples:
Large drugstore chain → Oligopoly (competing with a few others)
Small yoga studio → Monopolistic competition (differentiated service)
Steel mill → Oligopoly (few competitors, high entry costs)
Large corn farm → Perfect competition (standardized product)
Microsoft → Monopoly/Oligopoly (dominant market position)
4. Distinguish between two types of planned economies. Why don’t they work well today?
Communism: Government owns all resources and makes all economic decisions.
Socialism: Government owns major industries but may allow private ownership in some areas.
Why they struggle today:
Lack of innovation and efficiency
Poor incentives
Over-centralization limits responsiveness to consumer needs
5. What are the four stages of the business cycle? What stage is Canada in now?
Expansion: Growth, rising GDP, job creation
Peak: Economy at full capacity, possible inflation
Contraction: Slowing down, rising unemployment
Trough: Lowest point, leads to recovery
Canada now (as of late 2025):
Most likely in a moderate expansion phase, recovering from past downturns like COVID-19 and inflation-related slowdowns. There is job growth and moderate GDP increase.
6. What is gross domestic product (GDP)? What is its relationship to productivity?
GDP is the total value of all goods and services produced within a country over a specific time period.
Higher productivity (output per worker or per hour) leads to higher GDP, as more is produced with the same or fewer resources.
7. Effects of inflation and deflation. How does the Consumer Price Index (CPI) work?
Inflation: Reduces purchasing power; prices rise, affecting savings and fixed incomes.
Deflation: Prices fall; can lead to lower wages and reduced economic activity.
CPI: Measures the average change in prices of a basket of consumer goods and services over time. It's a key indicator of inflation.
8. What does a nation’s unemployment rate show? What types of unemployment match the following?
The unemployment rate shows the percentage of the labor force that is actively looking for work but cannot find a job.
Person | Type of Unemployment |
Discharged Armed Forces veteran | Frictional (between jobs, transitioning) |
Bus driver laid off due to budget cuts | Cyclical (related to economic downturn) |
Worker injured and switching careers | Structural (skills no longer match jobs) |
Lifeguard | Seasonal (only employed during certain times) |
Dental hygienist seeking new job | Frictional (voluntarily between jobs) |
9. Difference between monetary and fiscal policy. How does the government raise funds?
Monetary policy: Controlled by the central bank (e.g., Bank of Canada), affects interest rates and money supply.
Fiscal policy: Controlled by the government, involves taxing and spending decisions.
The government raises funds through taxes, borrowing, and selling bonds.
10. What’s the difference between the budget deficit and the national debt? Pros and cons of paying down the debt?
Budget deficit: When annual government spending exceeds revenue.
National debt: The total amount the government owes from all past deficits.
Benefits of paying down the debt:
Lower interest payments
More flexibility in future budgets
Increased investor confidence
Negative effects:
May require higher taxes or cutting essential programs
Could slow economic growth if spending is reduced too quickly
✅ Main Causes of an Equilibrium Price Increase:
1. Increase in Demand
When more people want the product at all price levels:
Popular trends or fads
Increase in consumer income (for normal goods)
Positive news (e.g., health benefits)
Population growth
Expectations of future price increases
Effect:
Demand curve shifts right → higher price and quantity
2. Decrease in Supply
When less of the product is available:
Higher production costs (e.g., raw materials, labor)
Supply chain disruptions
Natural disasters affecting production
New taxes or regulations
Fewer producers in the market
Effect:
Supply curve shifts left → higher price, lower quantity