Chapter 9: Shipping and international trade
Syllabus
Understand the trade pattern, be aware of World Trade statistics, and understand demand for shipping.
understand types of trade flows, inter-industry and intra-industry absolute and comparative advantage.
thoroughly understand global trading, the arguments for free trade VS protectionism in its many forms; The Role of the World Trade Organization and the G8.
9.1 The Growth and Pattern of World Trade.
From 1970 to 2020 exports have experienced a 72 fold growth.
Europe US dominated 50s and 60s, Japan and Southeast Asia in 70s and 80s, Asian tigers including China from 19 90 - 1997
Since 2008 World Trade has experienced a slowdown principally due the GFC.
China has been the major driver of import export growth
The pandemic also halted and damaged international trade.
Reasons for the slowdown due to pandemic:e
Manufacturing plants shut down
ports faced congestion
consumer demand fell
Trade in Commercial Services.
Commercial services saw 29 per cent decline in transport during the pandemic; on the other hand, in financial services, they continued to grow.
Data available one percentage share of World Trade by each geographic area and economic band of the country. [lower developing country or fully developed country.
Though countries’ share of international trade may decline for example in US and Europe international trade grew by 200% but still due to other countries growing fast uh
Key point US and China dominant holding 20% share of merchandise trades
Changes in export values can also fluctuate due to exchange rate changes
Inter-industry trade refers to trade between developed and developing countries, where developing countries provide resources to developed countries, and developed countries export the finished product due to their industrial base.
Please note that inter-industry trade is usually driven by comparative advantage but now modern trade is more complicated.
Intra-industry trade is more common which is between developing countries or countries in the same industry for example Ford making an engine in the UK and exporting it to Germany where they finish the car with the engine.
The data shows your most likely trading partner is another country with similar level of economic development.
For example, in 2020 EU traded 58.9% of exports went to other countries in EU and only 20% to the developing world.
This trend seen in many other countries.
9.2 Trade and Economic Growth:
GDP and international trade exhibit a strong correlation
Trade has experienced faster growth and stronger decline compared to world economic activity as economies become more integrated over time
The World Bank has concluded that the link between economic growth and trade has two key features
development of increasingly open markets
liberalisation of markets
Openness is the degree to which the economy is exposed to international trade. (measured by exports/country’s GDP)
Other measurements include
using imports/ GDP rather than exports
Difference between exports and imports or the balance of trade
Exports per capita
US is intersting as relatively low opennes at 8% export ratio (2021) but as it has such a large economy still has a huge impact on world trade despite not being as dependant
Hong Kong has export ratio of 182% (2021) as it is re exporting goods from china
9.3 Types of Trade flows: Intra-Industry and inter industry
4 Main groups of merchandise classified by the WTO
1) Manufactures
2) fuels
3) mining products
4) agricultural products
5) other
In 2021, the following was the case
china US, and Germany are the leading exporters of merchandise
Manufactured Goods Constituted 68% of Global merchandise trade in 2021 (dominant element in trade by value is the manufacturing sector)
Inter Industry trade: developing country exchanges resources for manufactured goods with developed country only 50% of trade
Intra industry trade other 50%: Germany exports cars to UK as they have comparative advantage over UK in making cars (costs)
Transfer Pricing: trade between subsidiaries of MNCs to save tax, accounts for 30% of world trade.
This MNC trade is refferd to as Intra firm Trade,
9.4 Trade growth and demand for shipping
Shipping demand grows with trade for the major reason as no real substitute to move large volumes of goods cheaply across the world.
Key point to emphasize is that shipping is derived demand and is influenced by the markets behind the particular shipping industry, e.g., an oil tanker is influenced by who has comparative and absolute advantages in oil.
9.5 Economic Models of Trade:
Two explanations of trade flows and why they exist in their particular forms,
Both explanations driven by cost analysis.
So one country has a cost advantage compared to another, and so can export the commodity to that other country
Absolute Advantage:
The country will export what it produces more cheaply and import what it can’t
most obvious is endowment of raw materials
But what id country A more efficient than B at everything, why trade with B
Comparative Advantage:
country specialises in which they have the biggest edge to achieve total output
Model 1: comparative advantage with opportunity cost
2 countries HC (home country) and F (foreign country)
One factor of production, labour present
Labour productivity average and marginal is constant in all sectors
total hours 12000 per year (similar size)
tech identical
cars and rice are products
No trade at start
Allocates 50% of production to each
Labour was always employed, with no unemployment
Competitive conditions prevail, leading to prices equalling opportunity cost in both countries
in HC 20hrs for one unit of rice vs 60 in F
in HC 60hrs for one car vs 20hrs F
So if HC does 50 50 split, 600 cars 200 rice and vice versa for foreign so 400 cars and 400 rice
if full in one HC makes 600 cars, and F makes and vice versa for rice so 600 of each more total output
Note the assumption that the labour productivity is constant, as there is always a 1/3 trade-off.
Opportunity Cost:
Opportunity cost ratios are 1/3 and 3. For HC, one unit is dedicated to cars, and 3 is lost to rice
In this case can arbitrarily assume that they exchange cars for rice equally
Note if one economy is bigger than the other, when it does specialise fully, it will the smaller one can no longer contribute to better trade and more output for the larger one.
Gains from trade and terms of trade
If a small country trades with a larger country likely that price ratio in large country of one good to another does not change. The larger country will not benefit, but the smaller one will get all of the gain.
Changes in the prices of goods/commodities benefit the terms of trade of countries. If oil prices rise, like in the US-Iran War, a country like Russia, an oil exporter, can now generate more income and is better able to facilitate imports.
Model 2: Comparative Advantage with variable opportunity cost
Two assumptions changed from model 1:
no longer a constant opportunity coste
production undertaken by several factors of production
In the new model, early movements of labour from one good to another do not produce as large a gain as the lands used best for land moved, then large gains, then smaller as less arable is moved.
In economic terms this means marginal product of factors employed in rice production will be high.
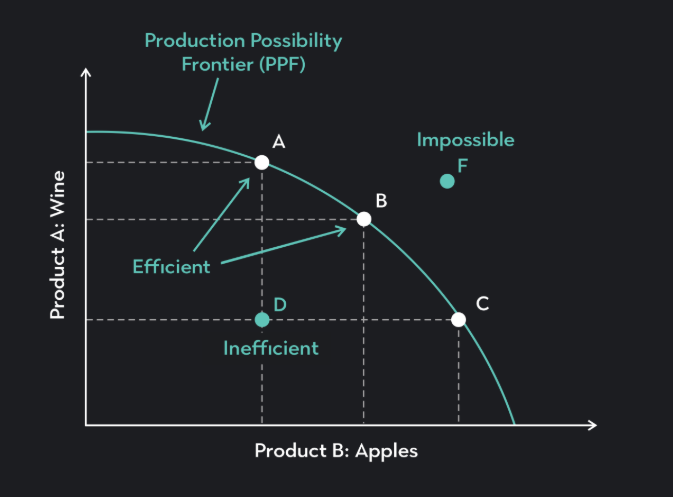
The graph above can be used to explain that it is the PPF and shows the opportunity cost between the two goods on the graph.
The reason the slope is changing is that initially, the land and labour who are swapped from wine to apples were much better at producing apples and not so good at wine so low gradient. By the end the most productive wine resources are being changed so more slope that wine production falling but apple production is not rising a lot.
Trade Equillibrium
Must reach equilibrium when prices of goods are the same in each country
seen on the graph on page 267
Countries don’t fully specialise as relative prices will shift as more resources are shifted from one sector to another.
Slopes on the graph are unity and countries trade 20 for 20 as
Summary of Model
one country endowed with abundant resources ( resource relative to capital)
If competitive conditions prevail in every sector and tech is the same, then a country with abundant resources will export to a country with less and import other materials that they can’t produce.
Note doesn’t explain intra-industry trade,
Key Assumptions in the Comparative Advantage Model:
full employment of resources in both economies
Only explains balanced trade value of export = value of import
barter economy no money
static as no growth
economies of scale not allowed
no allowance of monopolies
MNC trade: the international product cycle
Transfer pricing to reduce tax bill
can be done through charging high services to other subsidiary companies
hard to track as most accounting not public
allows MNCs to take advantage of the highest income markets, lowest cost production, and lowest tax structures
Explains many trade flows which can not be explained by comparative advantage
Economies of Scale and product differentiation as sources of trade advantage
new trade theories focus on products being made by companies so are not all the same
Consumers have preferences, and so the same category of goods can trade in both directions if a certain subset of consumers like goods from BMW and others like Aston Martins, then UK and Germany can both trade cars.
9.6 Benefits and Costs of Free Trade:
Key benefit seen is the increase in output by the world as a whole and therefore consumers are better off as they can get cheaper products.
However, in reality, countries put up trade barriers to protect their domestic economy from competition:
1) Real-world import penetration often leads to job losses and unemployment (different from full employment assumption) creates political pressure
2) Producers can exert political pressure as they benefit from trade barriers
3) Consumers have less political influence as they are many in number and each may only gain a little from protectionist measures
4) Some reale arguments
9.7 Free Trade versus Protectionism
5 Main arguments in support of Government regulation on free trade
Infant industry argument: small or new industries are unable to exert economies of scale and therefore can’t compete with worldwide companies. Objection: When does the industry grow up, and risk of it becoming dependent on subsidy
Smooth Reallocation of Resources Argument: Suddenly opening up to world trade for ecnomies which still rely on agriculture could create structural rural unemployment, better to reallocate resources before opening up for trade.
Strategically important industries: need to keep some capacity for wartime conditions if you rely on imported goods, this can be exploited during a war
To counter dumping behaviour by foreign govs or companies: selling goods in other countries at below cost to put existing businesses out of business, even if they are efficient.
To correct a Temporary balance of payments disequilibrium: only works if temporary
Some other arguments exist, but they don’t have much economic justification:
Retaliation: if the trading partner puts tariffs then you put tarriffs and threaten the other country to lift restrictions
Low labour costs in other countries: note this is not low wage, as a country with low wage can still have high costs if productivity is low
Economists still think the benefits of free trade outweigh the costs
9.8 Methods of Protection:
5 Main methods of protection:
trade tariffs
quotas
voluntary export restraints
exchange controls
production subsidies
1) Tariffs:
tax on the import of a commodity or product
levied in two ways:
Ad Valorem: percentage tax on import price e.g. 5%
Specific Duty: amount of tax per amount of goods e.g. 10 p per kilo of apple
Tariffs can generate significant revenues, (for the Government)
The effect of Tarrifs
Tarrif Graoh on page 275 same as in a level economics
World supply perfectly elastic as can import as much as required
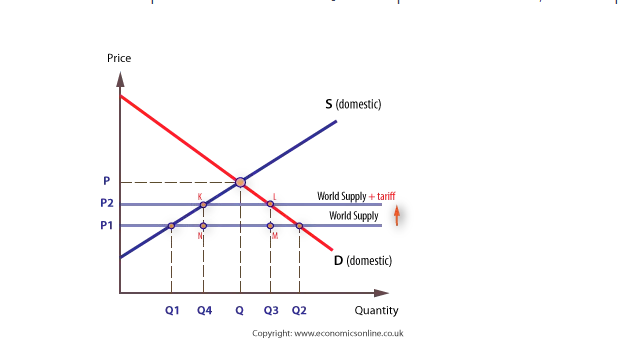
imports fall from Q2 - Q1 to Q3 - Q4
Consumers worse of higher price so buy less of the product as well q3 instead of Q2
Triangle KN is the resource cost as we assume full employment so resources used in this industry will be from elsewhere
Loss to consumers and efficiency loss to producers
(Arg supporting free trade)
Quota
Quantity limits imposed on imports
Use licences with certain number of units allowed per license
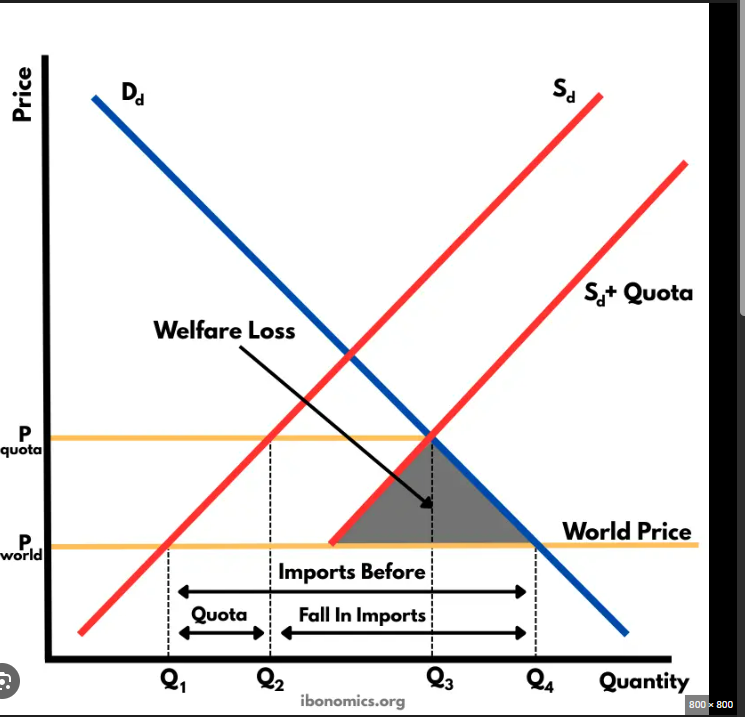
No direct revenue like tarrifs but gov can sell licenses to make the revenue
If licenses free then importers benefit as they buy at world price and can sell at new price
Quotas easier to manage than tariffs as can be measured easily
However may be difficult to change quota amounts if conditions change
Quotas can also cause shortages if domestic supply can’t meet demand
Voluntary Export restraints:
Due to General agreements on tariff and trade (GATT) after 1980s hard to use tariffs to protect domestic economy as against GATT set by WTO
therefore countries voluntarily made agreements that they won’t export beyond a certain amount of a certain good into certain countries.
E.g. Japan made deal with UK that they can’t export more than 15% of the domestic market in the UK worth of cars.
Exchange Control:
Gov ensures limited supply of domestic currency on the forex markets
India has some exchange controls on capital investment abroad
World Bank pushing countries not to do this
Embargoes:
Prevent export of all goods to a particular economy mostly political
E.g. Iran and Cuba
Subsidies:
Payment by a Gov agency to domestic producer of goods which permits them to charge lower prices for there products.
E.g cheap finance offered by Japanese shipbuilders to overseas shipowners to encourage ship buying
Jap Gov met the difference between financing given by banks to ship yards and ship yards deals given to clients
also could be in the form of tax relief on profits or cheaper raw materials. Lower production costs and pricing.
General subsidies also granted which are irrespective of export performance usually funded through tax rises for consumers.
9.9 Criticisms of the free trade argument:
The strong gain: only strong economies are gaining through trade not the weak ones (not seen in asian tigers)
Infant industries: some industries need to be protected to stay afloat e.g. airbus given subsidies by EU to compete with Boeing (Boeing also then received)
Unemployed Resources: if trade rises unemployment could rise in a country not seen in model (though general consensus is the opposite)
Monopoly Elements: used to be argued that models assume trade is in competitive industries when many sectors monopoly or oligopoly. New theories support more trade is better even in oligopoly and monopoly.
9.10 Transport costs and international
Transport costs included if large can greatly increase the price of imports if small can still be modeled the same
Transport costs defined as : costs incurred in the act of transferring the commodity from origin in one country to its final destination in another.
Some goods are therefore not exported as much, for example brewing, very little exporting of beer relative to domestic production as 95% of it is water.
In graphical terms has the same effect as tariffs.
Falling transport costs stimulate trade as now imported goods can compete in the domestic market.
Another graph is the demand supply of imported goods, in this as transport cots rise supply shifts out
new price Pw+t vs Pw quantity also less, consumers pay p to Pw and producers pay pw to pw+t so the cost of transport is distributed amongst priducer and consumer depending on elasticity of the demand curve.
9.11 Developing international trade the role of the WTO:
founded in 1995 replacing GATT
GATT founded for the express purpose of lowerin trade barriers
1947 40% tariffed good vs less than 5% in 1997
WTO: based in Geneva , further trying to limit trade barriers
current round of talks in Doha stalled since 2001 as manufacturing barriers gone only agriculture remain which people are not agreeing to.
Future of shipping growth determined by how much trade can increse.
protests about WTO in Seattle and Genoa