week 2
Biodiversity - a Definition
The definition provided by the convention on biological diversity, agreed at the UN Rio conference in 1992, is useful:
“the variability among living organisms from all sources including, inter alia, terrestrial, marine and other aquatic ecosystems and the ecological complexes of which they are part; this includes diversity within species, between species and of ecosystems’
The Tree (or Circle?)
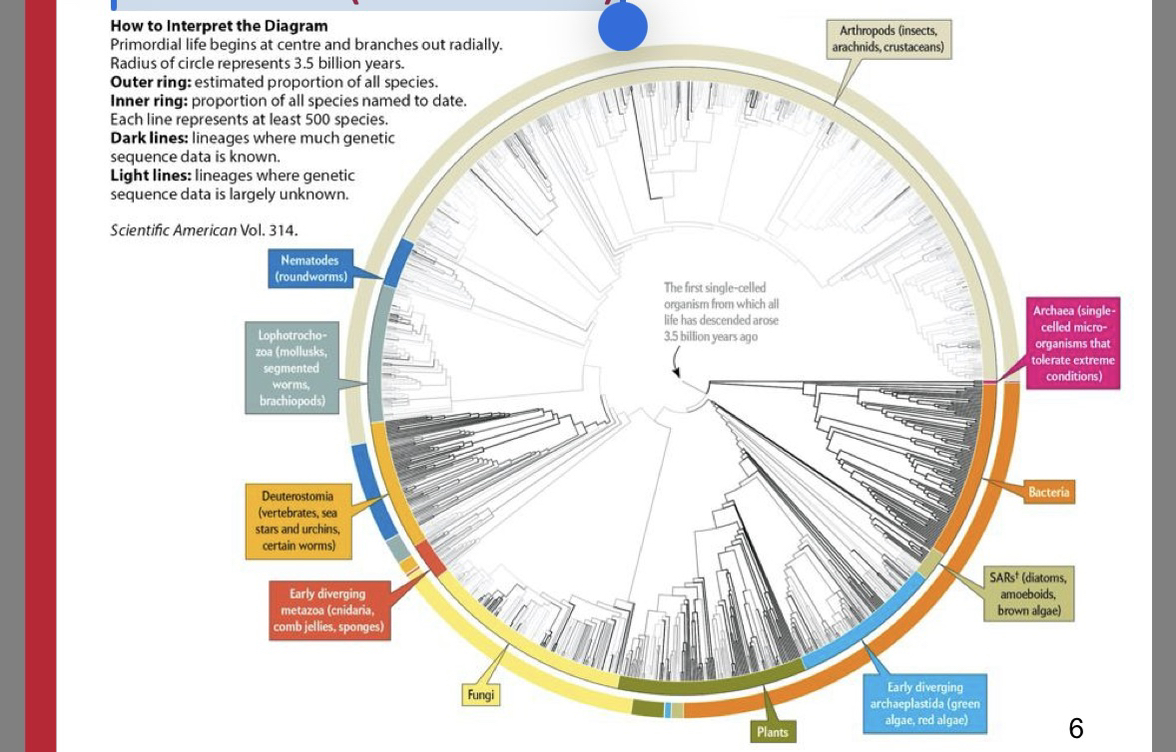
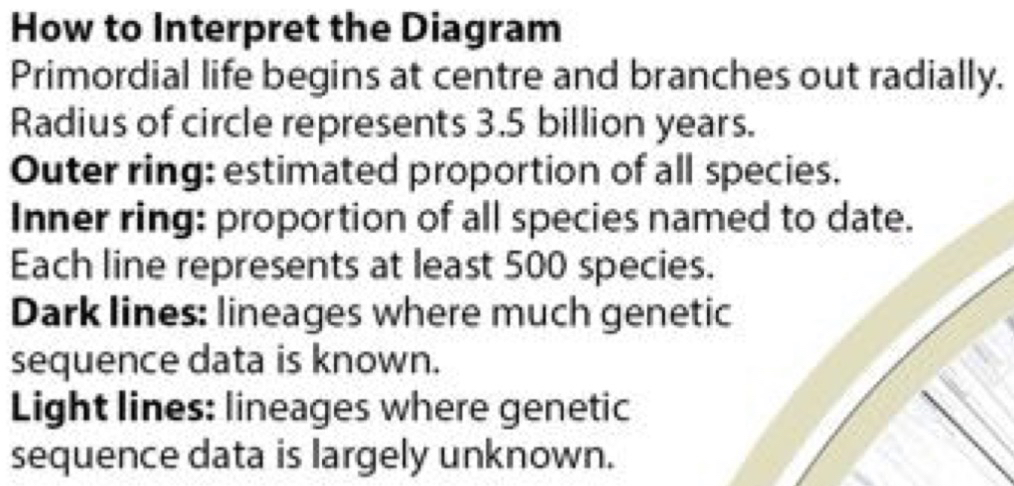
dark=known
light =unknown
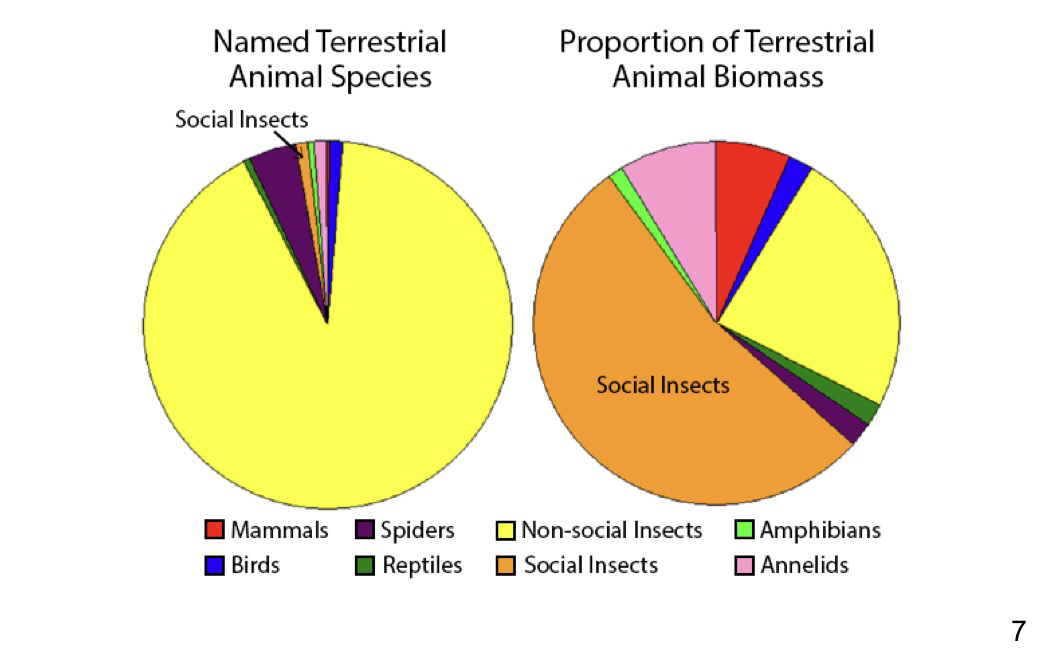
Biodiversity and Biomass (of Terrestrial Animals)
Biogeography - the study of the geographical patterns of plant and animal species.
Ecology - the study of the interactions among organisms.
-zoogeography (animal distribution);
- phytogeography (plant distribution);
- historical biogeography (the study of distribution over time).
Patterns in Global Distribution of Species
Major patterns include:
1. Peak biodiversity in many different taxa is at / just north of equator.
2. Peak biodiversity is at low altitudes.
3. Peak biodiversity is on large land masses.
4. Peak biodiversity is on large contiguous (interconnected) areas of homogenous habitat, which have changed little for long periods.
5. Peak biodiversity is in tropical areas.
Patterns in Global Distribution: Islands
Islands have many endemic species and are very vulnerable to invasive species (which easily drive native endemic species to extinction).
e.g. Chatham Island Robin: Vulnerable to invasive mammals and birds.
Confined to Little Mangere Island
(<0.15 km in size) by 1870.
-World population dropped to 1 adult female and up to 4 males in 1980.
Approx. 250 individuals today.
Patterns in Global Distribution of Species:
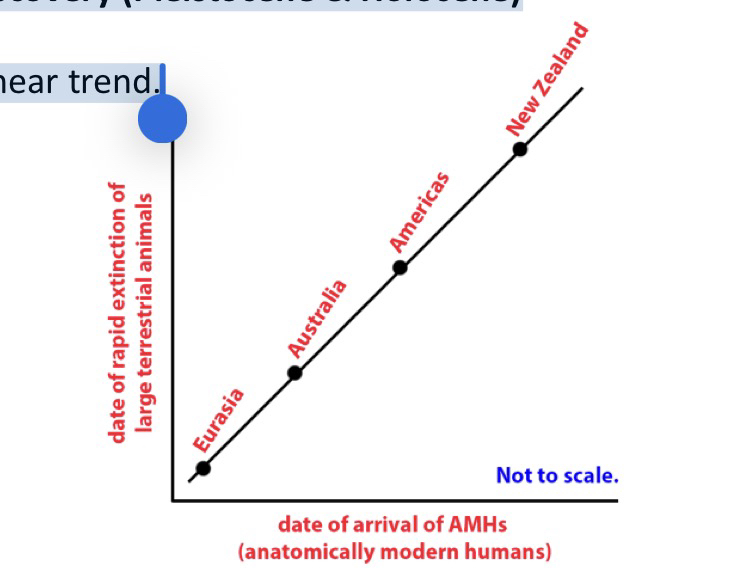
Date of Discovery (Pleistocene & Holocene)
A nearly linear trend.
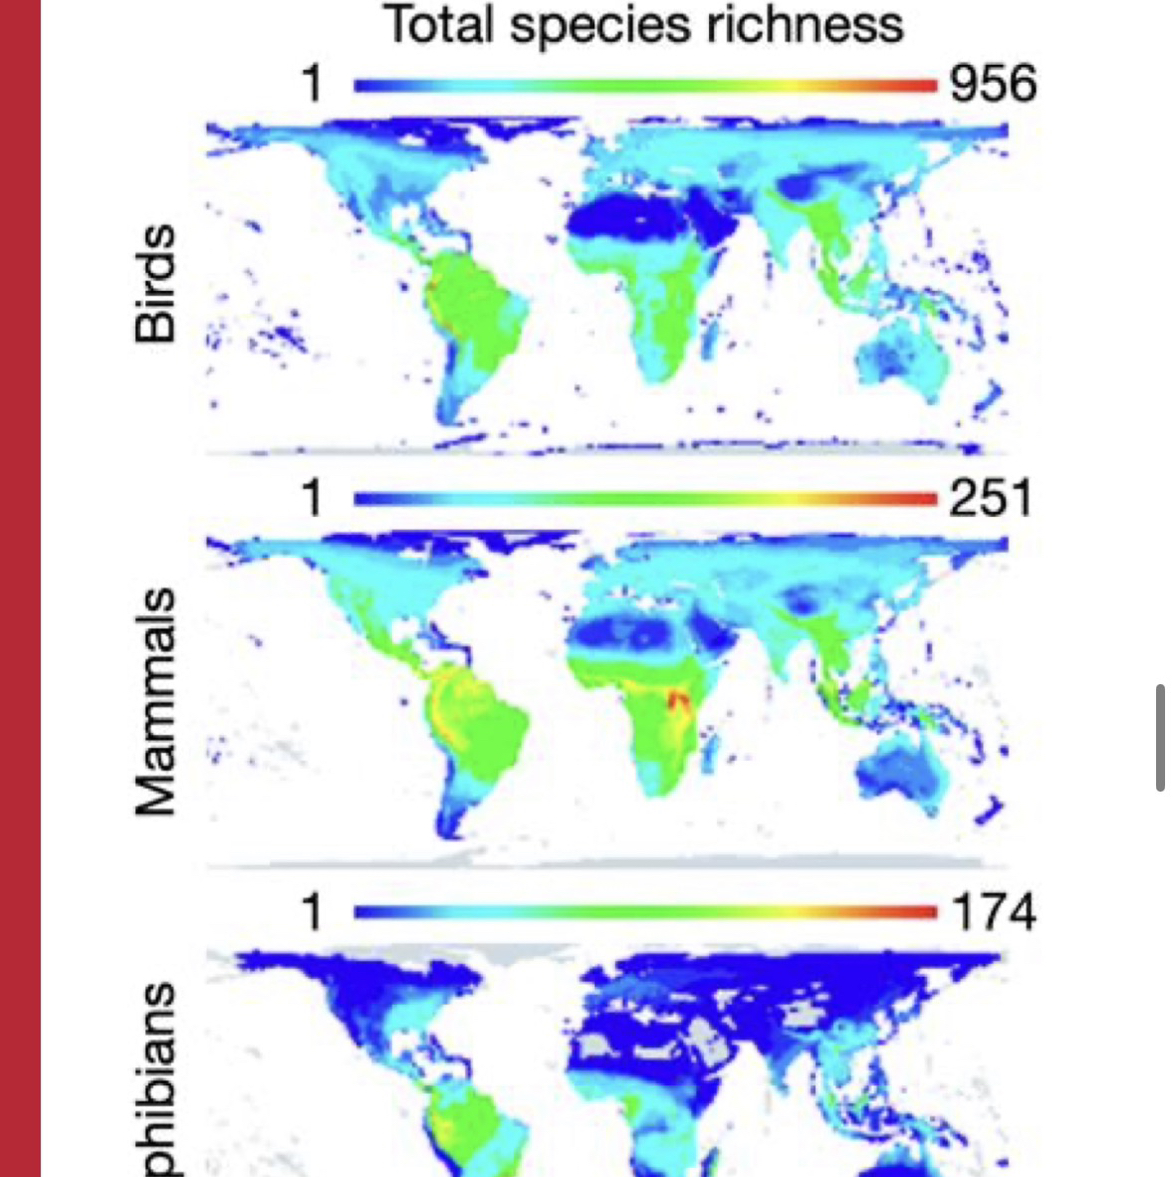
Global Distribution of TOTAL Birds, Mammals and Amphibians
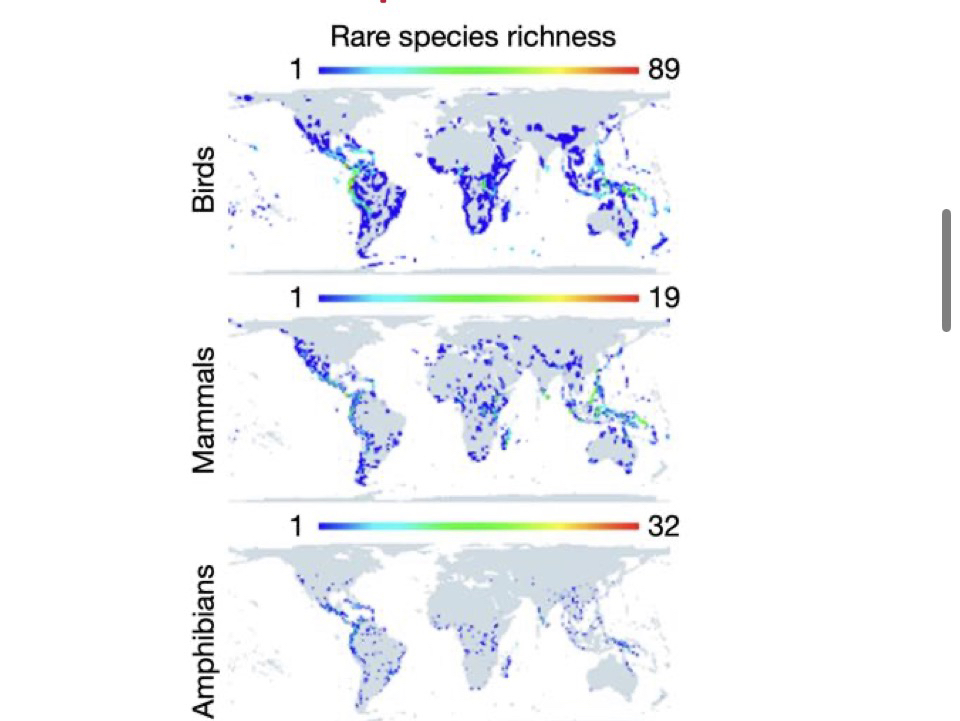
Global Distribution of RARE Birds, Mammals and Amphibians
Global Distribution of THREATENED Birds, Mammals and Amphibians
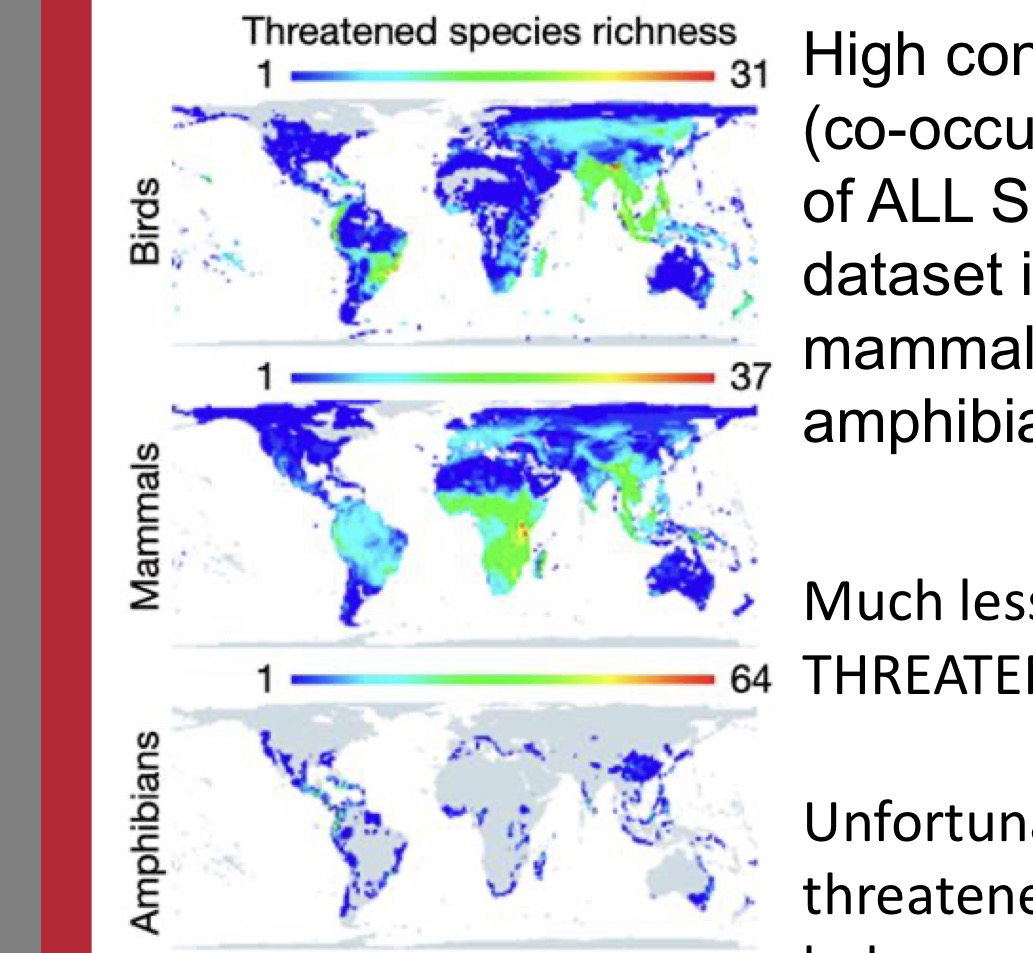
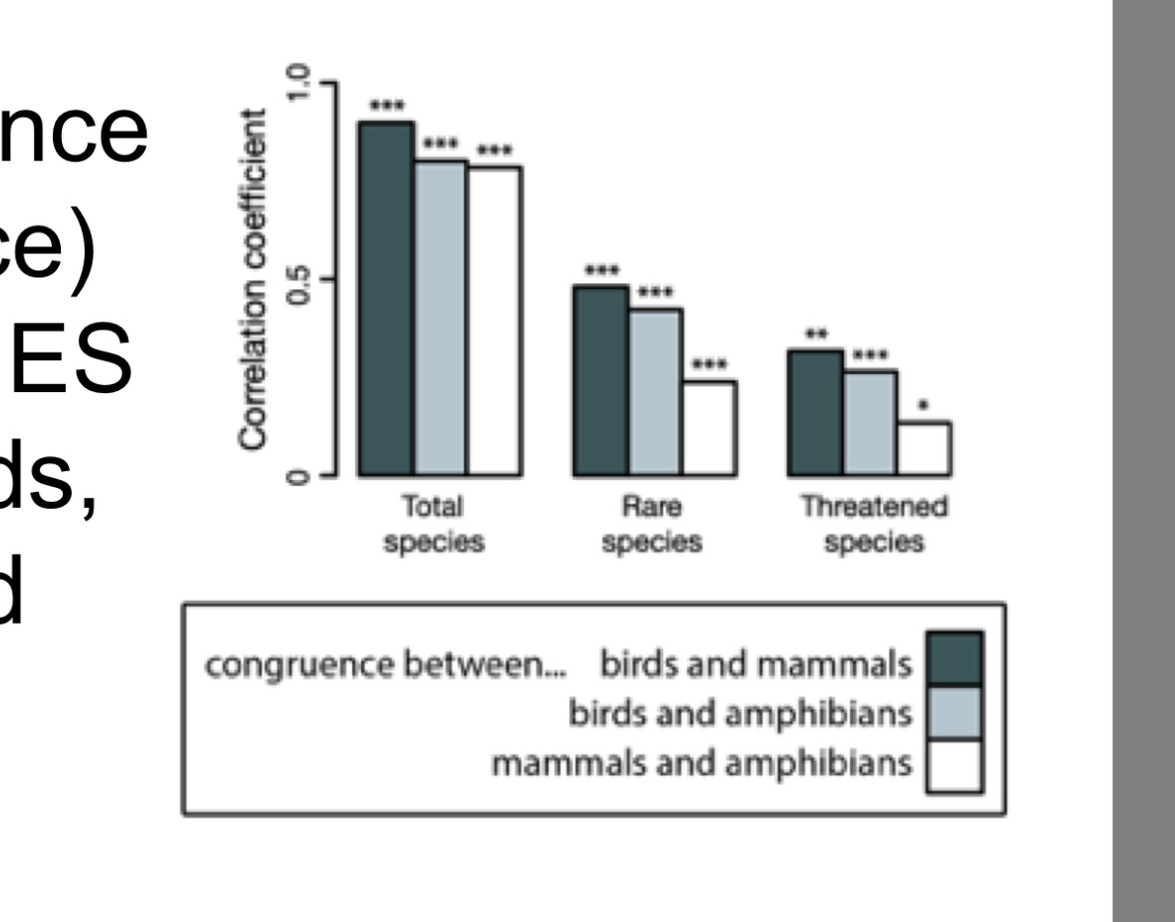
High congruence (co-occurrence) of ALL SPECIES dataset in birds, mammals and amphibians.
Much less congruence in RARE and THREATENED SPECIES of those three taxa
-Unfortunate, because it’s rare and threatened species that we’re trying to help.
Global Distribution of THREATENED Birds, Mammals and Amphibians
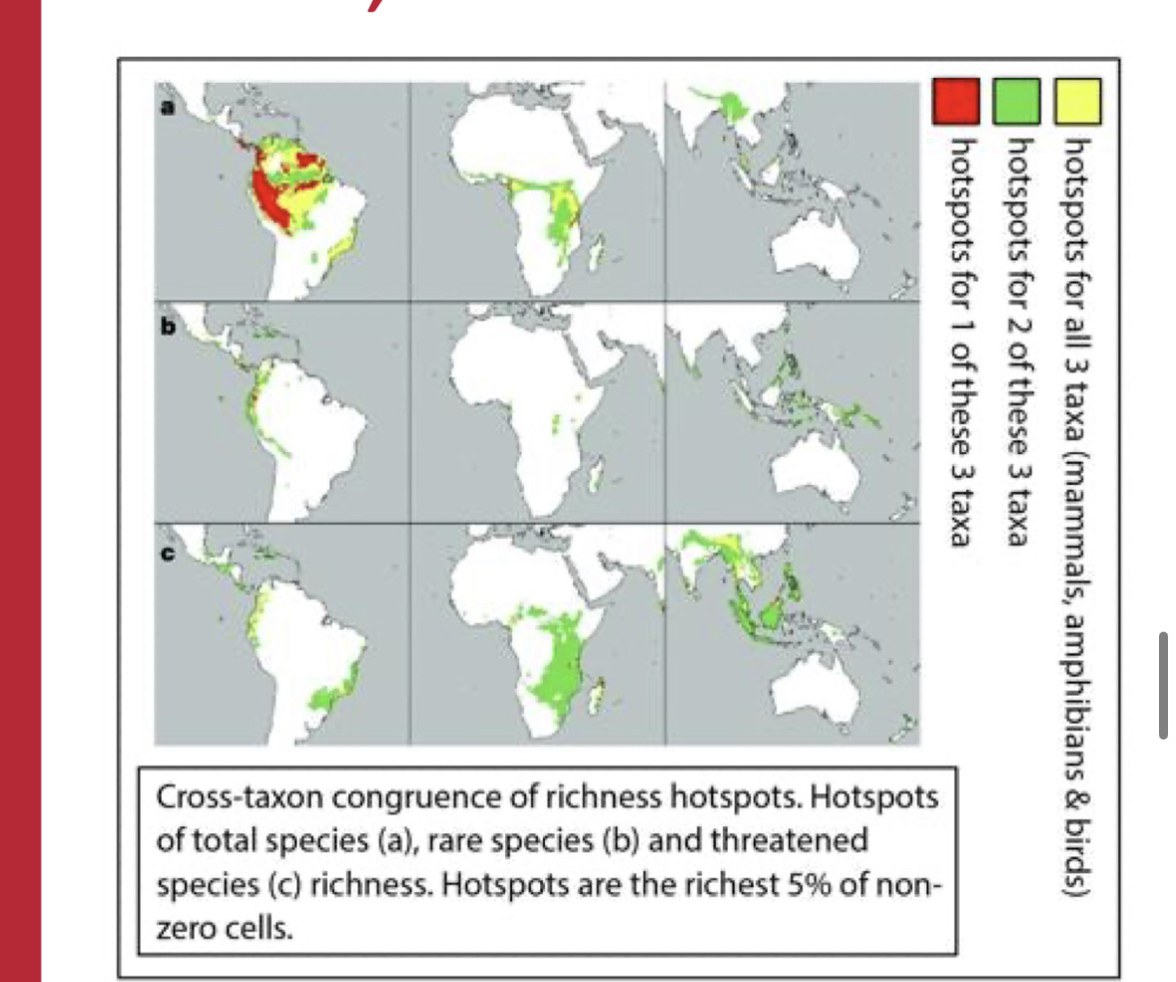
Areas of overall high biodiversity are not the same areas as those of high biodiversity of rare and threatened species.
-the median geographical ranges of the 3 taxa species vary hugely:
birds: 1,001,559 km2
mammals: 574,969 km2
amphibians: 55,642 km
First Complete Dated Phylogeny of all Birds
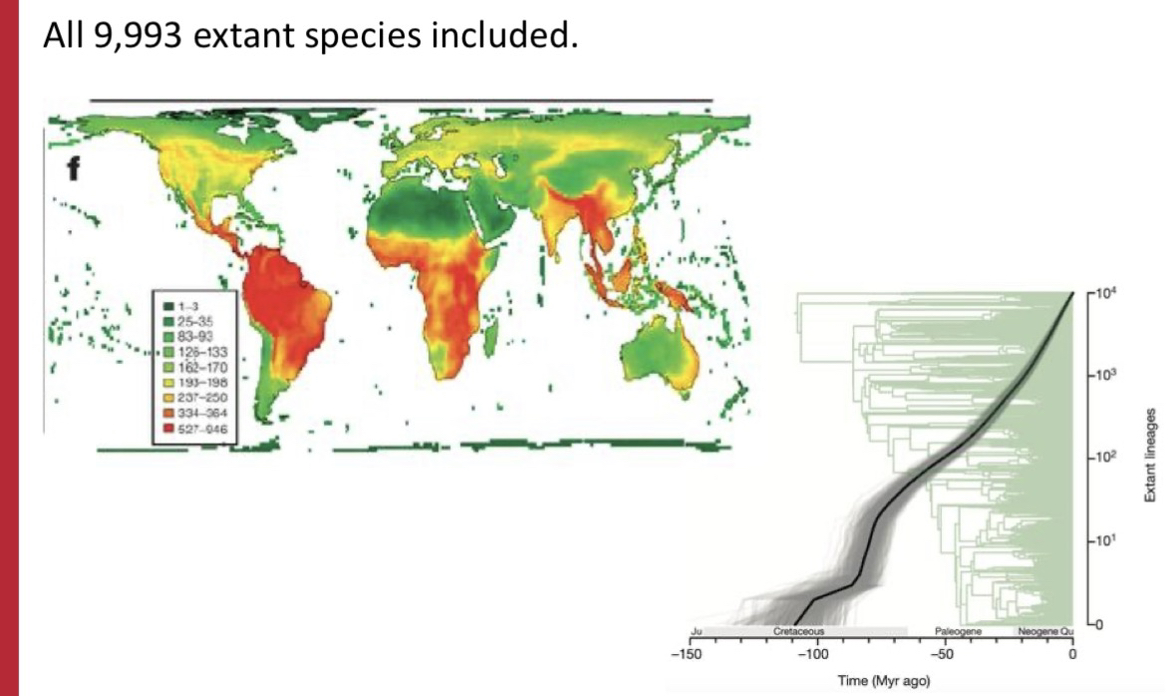
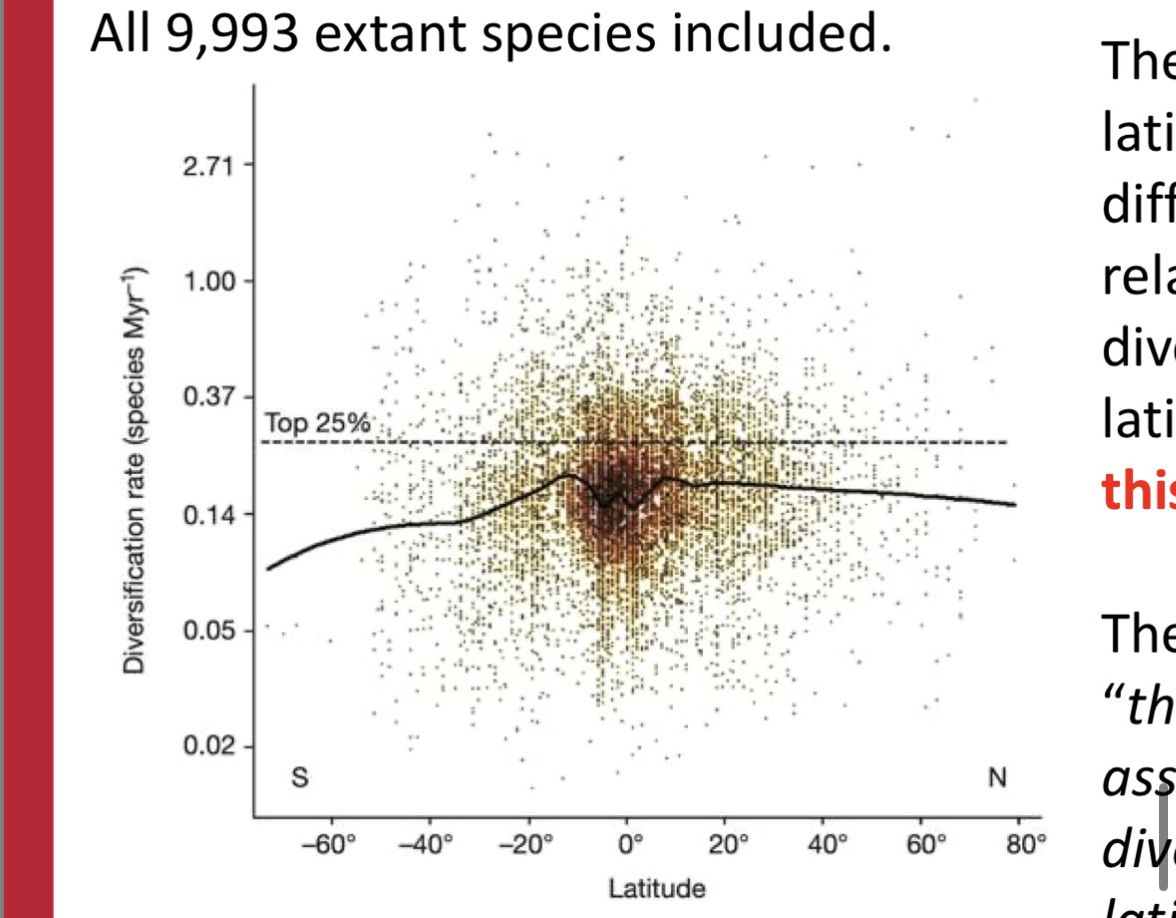
The hypothesis that latitudinal diversity differences result from a relationship between diversification rates and latitude is rejected for this data.
Therefore the greater combined age and area of tropical moist forests (and not greater rates of diversification) has caused greater bird species accumulation in the tropics.
Are the tropics a cradle, a museum or a destination?
The biodiversity : latitude relationship is almost universal across a wide range of taxa (see above).
Three major hypotheses (that are NOT MUTUALLY EXCLUSIVE) are
-CRADLE,
- MUSEUM
-DESTINATION.
1. CRADLE
The tropics are a "cradle" for the generation of biodiversity —
- high speciation rates in the tropics - the tropics are where most species evolve.
A hypothesised reason for this is more molecular evolution (i.e. mutation) in the tropics because they’re warm environments.
2. MUSEUM
The tropics are a ”museum" for already generated biodiversity
— low extinction rates in the tropics.
-Hypothesised reasons for this are the amenable ecological conditions in the tropics and the longevity of many tropical habitats (10s of millions of years in some cases).
3. DESTINATION
The tropics are a ”destination" for already generated biodiversity
– many species accidentally migrate into the tropics and are successful there:
-more than those being successful after moving in the other direction.
Seasonality
- The northern hemisphere’s boreal forests (the world’s largest terrestrial habitat: 17 million km2) which photosynthesise greatly during the northern hemisphere summer;
- The northern hemisphere’s human population’s extreme use of fossil fuels in winter.
Less than 12.5% (1/8) of humans live south of the equator, and 50% of humans live between 20oN and 40oN.
Global Distribution of Humans & of Human Behaviours
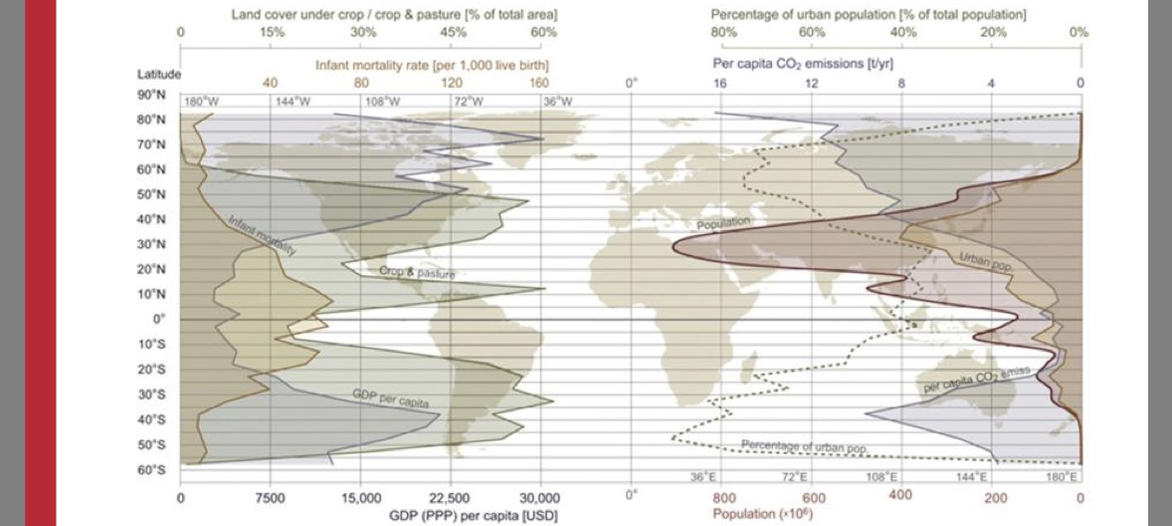
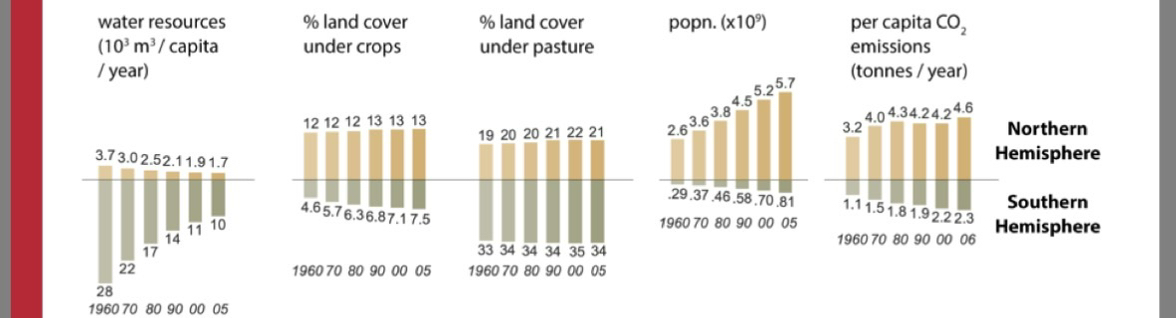
Human development decisions have major effects on biodiversity:
we compete with nature for land, water, sunlight, soil nutrients, food, etc. The Southern Hemisphere (SH) has developed morebrecently than the Northern Hemisphere (NH), broadly speaking.
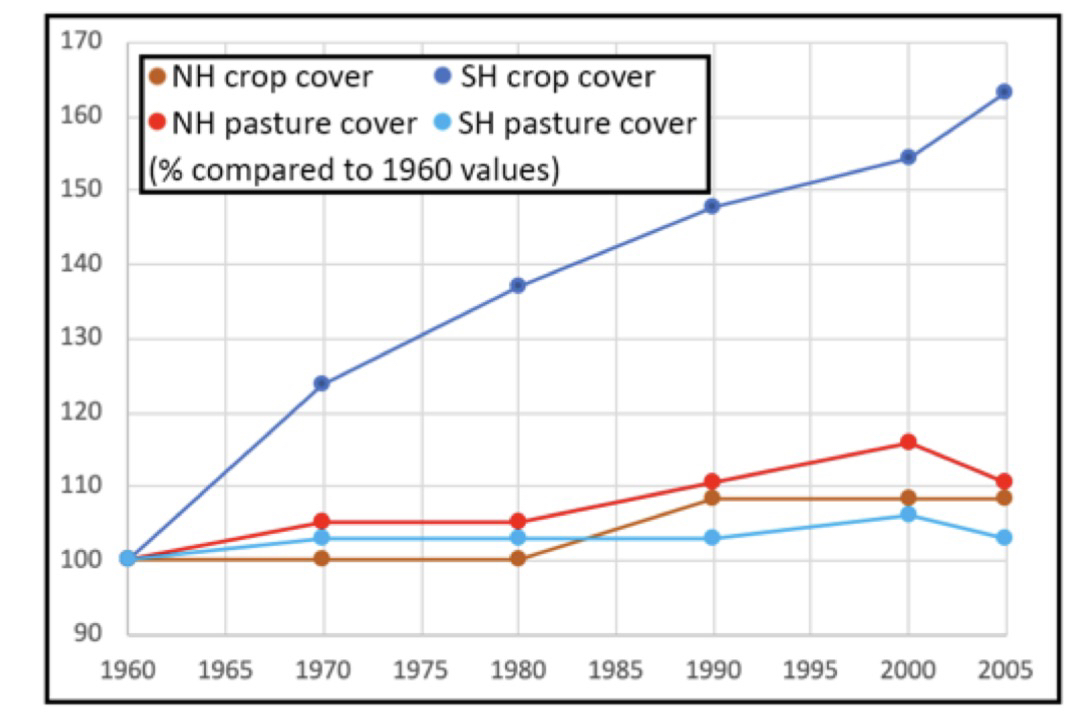
crops worse than pasture
The recent threats to species displaced by SH cropland expansion are likely to be far higher than those affected by SH pasture,
NH cropland and NH pasture, see left.
—
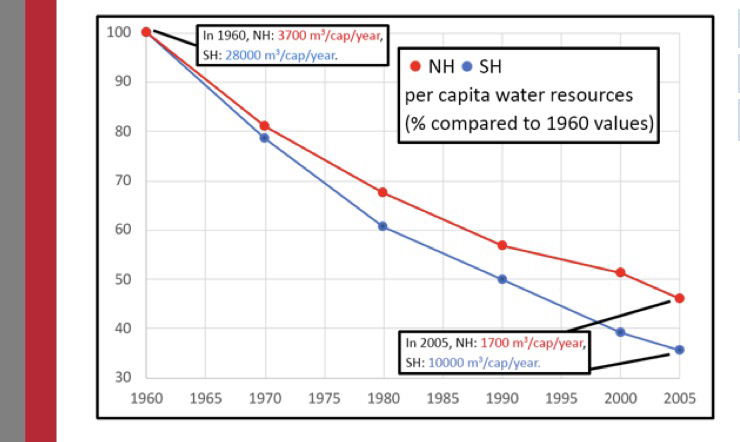
Water resources are far more abundant per capita in the southern hemisphere than in the north,
but per capita water resources have declined greatly since 1960 in both hemispheres,