Dose-Response Concepts in Pharmacodynamics
Dose-Response Basics
Dose–response relationships connect the amount of drug given (dose) to the observed effect (response). Most medicines show little effect at very low doses, a useful range where effect rises with dose, and a ceiling where additional dose does not increase response.
Two key concepts for comparing drugs:
Potency: how much drug you need to produce a given effect (EC50). A lower EC50 is higher potency.
Efficacy: the maximal effect an agonist can produce (Emax).
Graded dose–response curves show a continuous range of effects for a single subject; they are typically plotted with dose on the x-axis and response on the y-axis.
Population considerations lead to quantal dose–response data (e.g., proportion of individuals achieving a predefined effect).
On the dose–response curve, dose increases from left to right, and the response typically increases correspondingly until reaching a plateau.
To titrate safely, clinicians start with a low dose and adjust upward; the goal is a balance between desired effect and risk of toxicity.
Key terms to define and interpret on graded curves:
EC50 (effect concentration 50): the drug concentration that induces the biological response halfway between baseline and maximum.
Emax: the maximum achievable response.
Threshold dose: the lowest dose that produces an observable effect.
S-shaped (sigmoidal) curve: long dose axis showing a threshold, a steep rise, and a plateau.
Practical takeaway: curves provide a common language for titration, anticipating adverse effects, and comparing therapies across patients with different sensitivities.
Potency vs. Efficacy
Potency: the amount of drug needed to produce a specified effect; typically the dose producing a 50% of the maximal effect, i.e., the EC50.
A low EC50 means high potency (smaller dose needed).
Potency is mainly determined by receptor affinity and receptor availability.
Efficacy: the maximal effect an agonist can produce if a dose reaches the highest tolerated level.
Important distinction: a drug can be more potent but less efficacious, or vice versa. Example relationships:
Drug A and Drug B may have the same receptor target; Drug A can produce a larger response than Drug B at the same dose (higher efficacy), while Drug C may have a much lower EC50 (higher potency) than Drug B but reach the same or a lower maximal effect.
A highly potent drug (low EC50) does not necessarily have high efficacy.
Illustrative examples from the lecture:
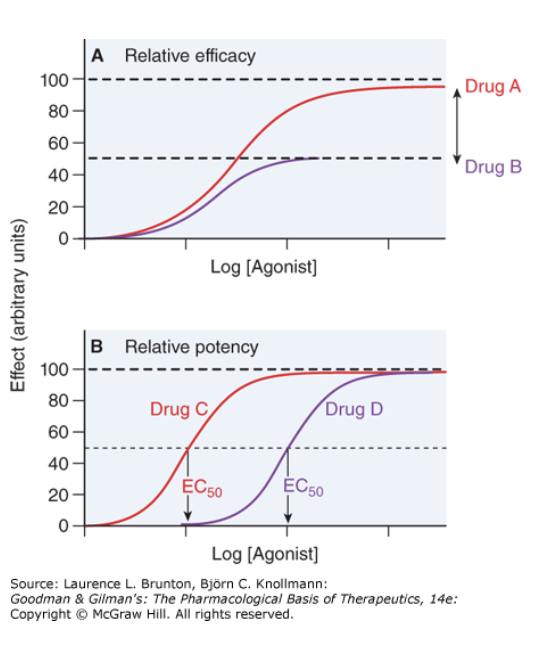
In the upper graph, Drug A (red) is twice as efficacious as Drug B (purple) for the same receptor/tissue.
In the lower graph, Drug C has EC50 one-tenth that of Drug B, so Drug C is tenfold more potent than Drug B.
Full agonist vs. partial agonist:
Full agonist: fully activates the effector system when it binds to receptors.
Partial agonist: produces less than full effect even with full receptor occupancy.
In the presence of a full agonist, a partial agonist can act as an inhibitor by occupying receptors and preventing full activation.
Clinical example: buprenorphine is a partial agonist at the opioid receptor; morphine, heroin, and fentanyl are full agonists.
Antagonists and how they alter the curve:
Antagonist: blocks or counteracts the effects of another drug by binding to the same receptor site or a different site.
Competitive antagonism (reversible): binds at the same site as the agonist; higher agonist concentration can outcompete the antagonist; effect is a rightward shift of the curve with no change in Emax; EC50 increases, but E
a max remains the same.Noncompetitive antagonism (allosteric): binds at a different site and reduces receptor responsiveness; lowers E
a max and cannot be fully overcome by increasing agonist.Irreversible antagonists: bind covalently or for long durations, effectively reducing available receptors until new receptors are synthesized.
The practical implication: early dose increases may temporarily preserve E
a max, but with ongoing receptor loss, Emax declines.
Relationship to enzyme inhibitors (conceptual parallel): competitive antagonists shift the curve to the right; noncompetitive antagonists reduce efficacy rather than shifting EC50 alone.
Dose–response plots across two representations:
Graded curve: response vs dose for a single subject or tissue.
Cumulative (quantile) dose–response curve: response (e.g., fraction of population responding) vs log dose; used to determine population-based metrics like ED50, TD50, and LD50.
Population and Safety Metrics
ED50: the dose that produces a predefined therapeutic effect in 50% of the population.
TD50: the dose that produces a toxic effect in 50% of the population.
LD50: the dose that is lethal in 50% of the population.
ND50 (sometimes used interchangeably in practice with LD50 in analyses): lethal dose in 50% of the population.
Therapeutic index (TI): a simple measure of safety, defined as the ratio between a toxic/toxic (or lethal) dose and the effective dose.
Common definition:
Alternative common form:
Clinical use: TI helps plan titration and monitoring to maximize effectiveness while minimizing toxicity.
Example considerations in dosing:
For pain management, choose a dose high enough to relieve pain but below the level causing toxicity.
In fragile patients, a drug with a wider therapeutic index and gentler slope may be safer and easier to titrate, even if the absolute dose is higher.
Avoid targeting the steep unsafe region of the curve; aim for a balance within the therapeutic window where efficacy is achieved with acceptable safety.
Practical Dosing and Decision-Making
Dosing strategy is to balance desired effect against toxicity; curves help predict how dose changes will affect response.
A joint language for titration exists across patients with different sensitivities.
The overall goal is to maximize benefit while minimizing adverse effects; safety and tolerability influence drug choice as much as potency or efficacy.
When selecting therapies, clinicians consider:
Potency (EC50) and its implications for required dose.
Efficacy (Emax) and how much maximal response is needed.
The slope of the dose–response curve (how quickly responses rise with dose).
The therapeutic index (TI) to gauge margin of safety.
The presence of antagonists or drug interactions that can shift, reduce, or derail expected responses.
Summary and Learning Outcomes
You should be able to define and explain:
Potency (EC50): the dose or concentration that produces a specified effect, and how potency relates to receptor affinity and receptor availability.
Efficacy (Emax): the maximal effect an agonist can produce.
EC50, ED50, TD50, LD50: key benchmarks from graded and quantal dose–response data in individuals and populations.
Threshold dose: the dose at which effects become observable.
The difference between potency and efficacy (they are independent concepts).
Full agonist vs partial agonist and the inhibitory effect of partial agonists in the presence of full agonists.
Competitive, noncompetitive, and irreversible antagonists and how they alter EC50 and/or Emax.
Graded vs quantal dose response data and how to interpret each.
Therapeutic index: , and how it informs safe dosing.
Conceptual and practical takeaways include understanding how dose relates to effect, how to compare drugs, how to tailor dosing to individual patients, and how to anticipate adverse effects as you titrate therapy.