Affinity and Concentration Response Curves
Goals of Drug Treatment:
Drugs are developed to modify biological functions in ways that improve health.
Cure disease
e.g. antibiotics and antivirals.
Alleviate symptoms
e.g. painkillers and medications like salbutamol for asthma.
Prevent disease or complications
e.g. insulin prevents DKA and statins lower cardiovascular risk.
Drug-Receptor Interactions:
A receptor is a protein target that binds a drug (ligand).
Affinity = ability to bind to receptor.
Efficacy = ability, once bound, to activate the receptor and trigger a response.
Drug Classes:
Agonists - high affinity and high efficacy, so produce a response.
Partial Agonists - bind receptors but produce only partial activation, even at full occupancy (such as buprenorphine at μ-opioid receptors).
Antagonists - high affinity, zero efficacy, so block a receptor without activating it (such as propranolol at β-adrenoceptors).
Inverse Agonists - bind and reduce basal receptor activity below resting level (e.g. some β-blockers at β2AR).
Law of Mass Action:
Drug-receptor binding is reversible and follows equilibrium rules:
D + R ⇌ DR
The forward binding rate has equation:
Rate = kon[D][R]
The reverse dissociation rate has equation:
Rate = koff[DR]
At equilibrium:
kon[D][R] = koff[DR]
This is the foundation of pharmacological binding theory.
The Dissociation Constant (KD):
The Dissociation Constant is defined as KD = koff / kon.
It is the equilibrium dissociation constant.
A measure of drug affinity.
Low KD = high affinity.
High KD = low affinity.
It is the concentration of drug at which 50% of receptors are occupied.
A higher affinity means that a lower dose is required, and there is longer therapeutic action.
Receptor Occupancy:
Fractional occupancy (α) is given by: α = [D] / [D] + KD.
The proportion of receptors that are occupied (bound) by a drug at a given concentration.
If [D] = KD, then α = 0.5.
It is also important to note that occupancy is not response, which also depends on efficacy and receptor reserve.
Binding Kinetics:
KD is useful, but isn’t the whole story.
kon is how quickly a drug binds.
koff is how quickly a drug dissociates.
Residence time (average time a drug is bound to a receptor before dissociating) is 1 / koff.
Measuring Affinity - Radioligand Binding Studies:
Radioligands are radioactively labelled drugs that bind receptors.
Radiolabel drug (e.g. with tritium (3H)).
Mix with receptor preparation.
Allow binding to equilibrium.
Separate bound vs free ligand (filtration/centrifugation).
Count radioactivity.
Specific vs Non-Specific Binding
Specific + Non-Specific Binding = Total Binding
Non-Specific Binding = radioligand sticking to membranes, filters etc.
Measure by adding excess unlabelled drugs.
This displaces radioligands from receptors, leaving only non-specific binding.
Saturation and Competition Analysis:
Saturation Binding
Varying concentration of radioligand.
Curve approaches a plateau at Bmax (total receptor number).
KD found at [radioligand] that gives 50% of Bmax.
Competition Binding
Keep the radioligand concentration constant.
Add increasing concentrations of an unlabelled competitor drug.
The competitor displaces the radioligand from the receptor in a concentration-dependent manner.
In a competition binding experiment, you plot % radioligand bound (y-axis) against log[competitor] (x-axis).
As the competitor concentration increases, it displaces more radioligand from receptors.
The resulting sigmoid (“S-shaped”) displacement curve shows the degree of displacement.
IC50 is the concentration of unlabeled competitor drug that displaces 50% of the specifically bound radioligand.
True Affinity (Ki) is calculated using the Cheng-Prusoff equation:
Modern Binding Assays:
Non-radioactive probes (i.e. fluorescent or luminescent etc.).
Allows real-time binding studies in living cells.
Safer and more versatile than radioactive assays.
Example: fluorescent ligand binding to Neuropeptide Y receptors.
Limitations of KD:
KD does not tell you:
Whether the drug activates a receptor (efficacy).
How selective the drug is for one receptor over another.
Its pharmacokinetics (absorption, metabolism, clearance).
Its clinical effect size (which depends on tissue receptor density, spare receptors, signalling pathway etc.).
Why isn’t KD enough?
Affinity (KD) tells us how strongly a drug binds to its target.
However, binding alone doesn’t tell us what the drug does.
A ligand can be an antagonist, agonist or an inhibitor.
Therefore, we need functional bioassays to measure the actual response a drug produces, not just the binding.
Concept of Bioassays:
A bioassay is any experiment that measures the functional response or potency of a drug.
Cellular - measures second messenger production (e.g. cAMP at β-adrenoceptors).
Tissue - contraction of isolated cardiac muscle strips.
Organ - rate and force of isolated heart beats.
Whole System - blood pressure changes in a live animal.
Advantages vs Disadvantages:
Simple Bioassays (e.g. cell lines, recombinant receptors):
✔ Receptor is well-defined.
❌ May be artificial - cell behaviour might not reflect true physiology.
Complex Bioassays (e.g. organ and system level):
✔ Closer to “real” physiology.
❌ Multiple types of receptor, so response may be a composite.
Concentration Basics:
Concentration = amount of drug (moles) per unit volume (litres).
Units: M (molar).
Drug responses typically vary over 1000-fold differences.
For clarity, pharmacologists plot concentration logarithmically.
Each step is a 10-fold step.
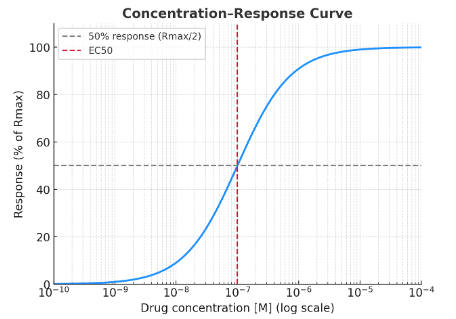
Concentration-Response Curves (CRCs):
Concentration-Response Curves show the relationship between drug concentration and response. It typically follows a sigmoid curve when plotted logarithmically.
Rmax = maximum response a drug can produce in that system.
Reflects the efficacy of the drug.
EC50 = concentration that produces 50% of Rmax.
Reflects the potency of the drug.
A low EC50 means there is a high potency.
→ Potency depends not only on affinity, but also on receptor density and amplification.
EC50 shows how much drug is needed, and Rmax shows the maximum response it can have.
Comparing Agonists:
Full Agonist - achieves the system’s maximum possible response.
E.g. formoterol at β2 receptors in airway smooth muscle.
Partial Agonist - cannot achieve full response even at 100% receptor occupancy.
E.g. salbutamol (lower efficacy than adrenaline).
Partial Agonists in Therapy:
Partial agonists have clinical advantages that full agonists do not have:
Lower maximal effect, which may lead to reduced side effects.
Less likely to cause receptor desensitisation or tolerance.
Interpreting CRCs - The Limitations:
Does a lower Rmax always mean partial agonism?
Yes. It can indicate partial agonism, but not always.
Low receptor expression or downstream signalling bottlenecks can also reduce the Rmax.
Is EC50 the same as KD?
No. Agonist EC50 is often lower than KD due to signal amplification and receptor reserve.
Signal Amplification and Receptor Reserve:
One activated receptor can trigger thousands of signalling events (second messengers, ion fluxes, gene expression etc.).
This amplification means:
Not all receptors need to be occupied to achieve maximal response.
The system appears more sensitive, i.e. EC50 < KD.
Receptor Reserve
The “spare receptors” in a system that aren’t needed for maximum response.
It explains why potency is not the same as affinity.