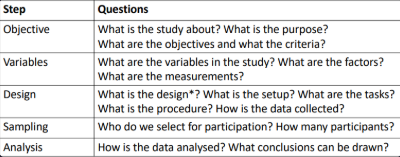
User Studies
Framework
Design has a specific meaning in the context of studies/experiments
Ethics
Any study with human participation requires an ethics review
Any form of study that collects data from humans
Including online surveys
By conducting research ethics reviews and adhering to guidelines we ensure that participation is
Voluntary - do not coerce people into taking part
Informed - provide accurate information about what the study entails
Safe - do not expose participants to unsafe situations or practices
Framework
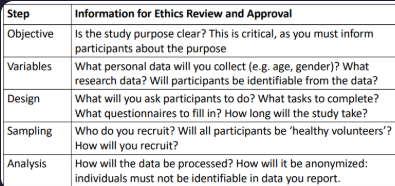
Informed Consent
You need to obtain informed consent from each participant
BEFORE the study begins
Participants must be able to make an informed decision
You must provide participants with an information sheet, time to read and opportunity to ask
Participants must provide explicit consent before you proceed
Study Objectives
What purpose do user studies have?
Some typical evaluation goals:
Comparing products - which is better suited for the tasks we have?
Completing transactions - how easy or difficult are they to complete?
Frequently used systems - how efficient is the interface for experts?
Navigation - can people find the information and features they need?
Safety-critical interface - can users operate the interface without error?
Creating an overall positive experience - do users respond positively?
Impact of subtle changes - how does it affect user behaviour?
Criteria
What criteria are relevant for a given purpose?
General usability criteria
Effectiveness – Can users accomplish their goals with the interface? How easy or demanding is task completion?
Efficiency – How quickly and accurately can users complete the tasks? How much effort is involved?
Satisfaction – How satisfied are users with their experience of using the system?
Other and more specific criteria might be important
Experiment Variables
Independent variables = Factors
Something that is manipulated or systematically controlled
In controlled experiments with users, these are called factors
Each combination of factor and level defines a test condition
Dependent variables = Measurements
Something we measure in an experiment
In user studies - a human behaviour or response
Performance measures
User-reported measures
Identify Factors and Measures
What are the factors and conditions that you want to study and compare?
Focus on one factor if possible (keep it simple)
More factors make it harder to determine cause-effect relationships
But sometimes, we are interested in the interaction between factors
Example - can people select targets faster by touch or by eye gaze on a touchscreen? does that depend on the size of the target?
Choose measures in accordance with your objectives and criteria
In experiments, generally aim for small number of conditions and large number of repetitions
Levels of Measurement
Anything we measure in a study is a variable
Each possible value of a variable is an attribute
The level of measurement of a variable is defined by the relationship among the attributes
Nominal - attributes have names but no relationship
Ordinal - attributes are ordered
Interval - the distance between the possible values is meaningful
Ratio - ratios (multiples, percentages) are meaningful
Levels of measurement define different types of data
Study Design
Once we know what our variables are, we can consider the design of the study. This includes:
Design (= structure of experiment, but just referred to as the design)
Factorial design – how the experiment is structured by factors and levels
Participant grouping – one or more groups
Experimental setup, referred to as apparatus
Hardware and software, spatial arrangement of participant and devices
Tasks and Procedure
The tasks participants are asked to complete
Sequence of events in the study
Within-Subjects or Between-Subjects
Within-subjects design
Each participant performs the same tasks with each of the test conditions
Between-subjects designParticipants are put into groups that each use different test conditions
Some variables (factors) require a between-subjects design
Tasks
Central to usability tests and user studies
If there is no task than what you do is neither a test nor an experiment
In usability tests, users are given typical tasks that users would perform with the user interface, to find out whether they encounter problems
In user studies that measure performance, we have a trade-off
Use typical tasks -> representative of real application
Use abstract tasks -> more control, for observation of how performance depends on
Skills-Based vs Knowledge-Based
Tasks that are skill-based lend themselves to repetition, and to be performed with different test conditions
Examples - reaction time, selection from menus, text entry
Knowledge-based tasks are more problematic as users gain knowledge when they perform the task, and need careful variation
Looking up information on a web site (vary what needs to be looked up)
Finding a train connection (vary the task)
Extract information from visualisations (vary data visualized)
Order Effects
In a within-subject design, there can be order effects on the results
Learning effects
Participants may perform better on a second condition because they benefitted from practice on the first (more practiced with the task)
Fatigue effects
Participants might get tired if the task is demanding, or they might get bored and less attentive if the task is repetitive
Counterbalancing
Used to compensate for any order effect or sequence effect
Divide participants into groups that each are given test conditions in a different order
If we have two conditions A and B:
Half of the users first use A, then B
The other half first use B, then A
If we have more conditions, use Latin squares instead of all permutations
Procedure
Encompasses everything that the participant does or is exposed to, from the moment they arrive for the study until they leave
The tasks that participants perform and the specific instructions, demonstration or practice they are given for their task
The order in which test conditions are administered, and how many repetitions/trials of the task in each condition
Includes consent procedure, and questionnaires that participants are given at the start (demographics) and post-task and/or post-test
Time for breaks between tasks/conditions, and total time for a session
Sampling
The selection of participants, as a sample from a target population
Ideally, the results of a study should hold for people in a target population who were not tested
Sampling is a major concern for survey research (e.g. opinion polls)
Experiments can produce statistically valid conclusions with relatively small samples
Just enough users to have confidence that we would get the same result with any other sample from the target population
Reporting of Participants
Studies collect and report demographic data that describes the study population
Age, gender, and any other characteristics relevant to the study
This helps understanding how representative the sample is
Analysis
When we evaluate designs, we are interested in the differences between the designs, and the effect of those differences on performance and UX
The people participating in a study will also be individually different in their performance and experience, but that is not we are interested in
For data analysis, we consider people a random factor
The data collected from participants is analysed statistically
Averaging performance across participants
Extrapolating from our sample to other users (people who are our target users but who were not tested)
Descriptive Statistics
Used for describing one data set (one group or condition)
Essential for any interval and ratio-level data collected from participants
How did participants rate ease-of-use, on average?
How much did time on task vary from participant to participant?
In what range do we expect the task success rate for our entire target group?
Report mean and standard deviation to show the distribution of the data points collected from across participants
How big an influence are individual differences on our data?
Report the confidence interval to show the range in which we expect the mean value for all potential users
Confidence Intervals (CI)
Represent the range in which we expect the average value for all possible users
EXCEL function:
CONFIDENCE(alpha, standard deviation, sample size)
alpha= 0.05 if we want 95% confidence
More variance (std dev) -> wider CI
More users -> narrower CI (4x as many users -> double the confidence)