Genetic Drift and Population Genetics
Change Not Always Resulting from Selection
Example: Variation in US Sparrows
Context: A colony of sparrows was released in 1852 in Brooklyn, NY.
Observation: By 1940 (less than 100 generations later), differences in size among sparrows were noted.
Question raised: Is natural selection responsible for these differences?
Concepts Introduced: These variations can highlight important concepts of "genetic drift" and "founder effects" which will be explored later.
Genetic Drift
Definition:
Genetic drift refers to random changes in gene frequencies between generations.
Characteristics:
Genetic drift is directionless—meaning neutral alleles can:
Increase in frequency
Decrease in frequency
Stay constant in frequency in each generation.
Population Size Effect:
The rate of change due to genetic drift is influenced by the size of the population.
Drift is more pronounced in small populations.
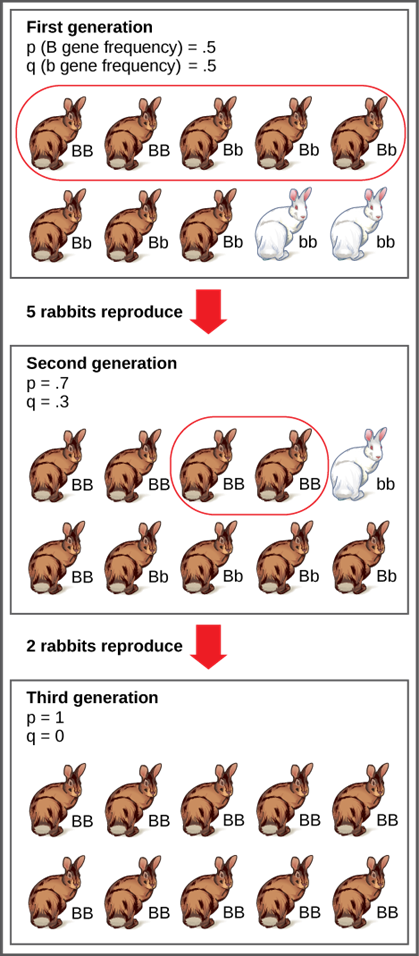
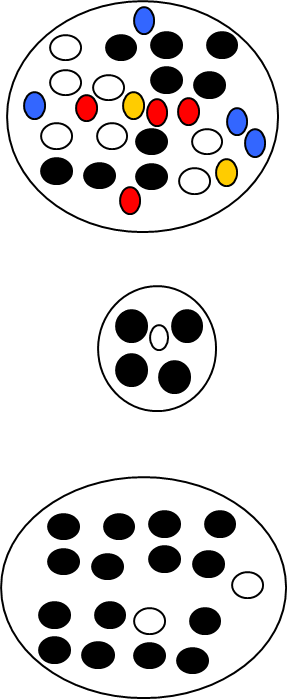
Illustrative Example of Genetic Drift
Population Case Study:
Consider a theoretical population of 10 rabbits:
2 BB (brown)
6 Bb (brown)
2 bb (white)
Random Reproduction Scenario:
By random chance, only 5 rabbits (circled) reproduce, leading to a change in allele frequency.
In the next generation, if only 2 rabbits reproduce by random chance, the b allele can be completely lost.
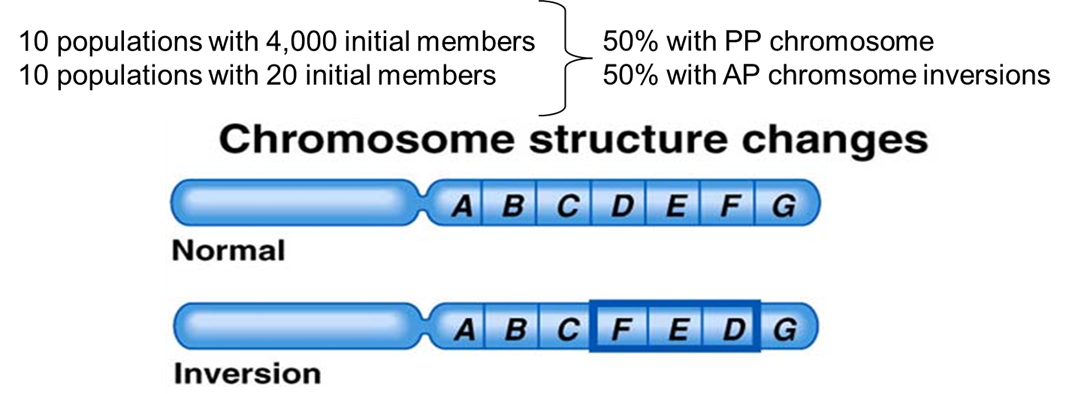
Case study of Genetic Drift
Investigators: Dobzhansky and Pavlovsky (1957) conducted experiments with the fruit fly Drosophila pseudoobscura.
Study Design:
Two different initial population sizes:
10 populations with 4,000 initial members.
10 populations with 20 initial members.
Allele Composition:
50% with PP chromosome
50% with AP chromosome inversions.
Chromosome Structure Variants:
Normal: ABCDEFG
Inversion: ABCFEDG
Natural Populations and Genetic Drift
Factors Affecting Genetic Drift:
Small Population Inception:
Genetic drift often affects populations that are small at their inception, known as the Founder effect.
Periodic Population Reduction:
Genetic drift also impacts populations that occasionally become small, referred to as the Bottleneck effect.
Application to Human Populations:
Many examples illustrating genetic drift have been documented among human populations.
Founder Effect
Case Study:
The Old Order Amish community in eastern Pennsylvania.
Population Statistics:
Contributions to the residency percentage based on adherents reported by the Old Order Amish Church vs. total population as recorded by the U.S. Census Bureau in 2000.
0.1-2.1% reported in certain counties.
Case Study: Ellis-van Creveld Syndrome among the Amish
Population History:
The Amish are descended from about 200 European settlers who immigrated to the U.S. in the 18th century.
Restriction on Out-Breeding:
Out-breeding with the larger U.S. population has been limited, preserving the genetic mix of the original founders.
Genetic Characteristics:
Among founders was Samuel King and his wife; one of them carried the Ellis-van Creveld syndrome.
Syndrome Characteristics: - Phenotype: Dwarfism and polydactyly (six fingers).
Genetic Basis: Caused by a recessive mutant allele on chromosome 4, which has a frequency of about 0.001 in most populations.
Frequency in Amish Population: Approximately 0.07, likely due to genetic drift increasing the allele frequency, originally ~0.005 in the founders.
Case Study: Porphyria among Afrikaners
Origin of Genetic Disease:
Either Gerrit Jansz or his wife Ariaantje Jacobs carried a single mutant gene for porphyria, a metabolic disorder.
Disease Characteristics:
Failure to produce photoporphyrinogen oxidase leads to a metabolic block resulting in:
Red “port red” urine
Light sensitivity
Skin sores
Accumulation of toxins can affect the brain, leading to mental disorders.
Historical Note: The same disease affected historical figure George III.
Population Impact:
Approximately 30,000 Afrikaners are affected by this condition, while it remains rare in the European populations.
Notably, more carriers exist in Johannesburg than in all of Holland.
Predicting Heterozygosity in a Population
Formula:
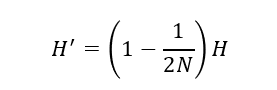
Where:
H' is the predicted heterozygosity of the next generation.
N is the number of individuals in the population.
Heterozygosity Calculation Example
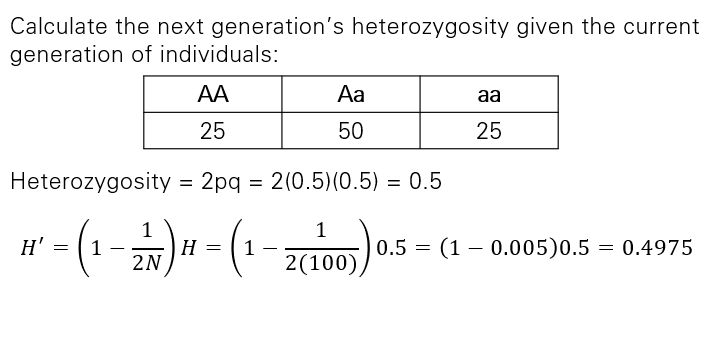
= 0.475$$
Migration or Gene Flow
Definition:
Migration introduces new alleles into a population, impacting gene frequencies.
Effects of Migration:
Increases variation within populations.
Promotes genetic mixing, thus preventing speciation events.
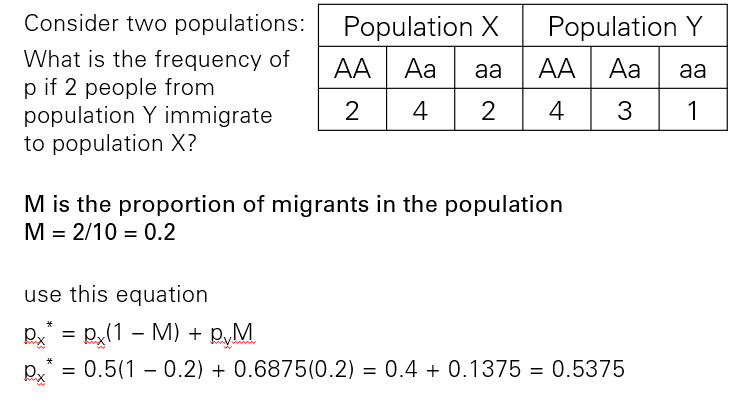
Migration Impact In Hardy-Weinberg
Immigrant Impact Calculation:
Bottleneck Effect
Description:
Occurs in declining populations where the surviving population is not representative of the original group.
Key Observation:
While the size of the population may return to its original level after a catastrophic event, its genetic diversity remains altered.
Example Types:
Causes can include events such as migration or famine.
Case Study: Northern Elephant Seal
Historical Context:
Intense hunting reduced the population of northern elephant seals to as few as 20 individuals in the 19th century.
Reproductive Challenges:
The harem-based mating system further reduces genetic variation in the current day population.
Genetic Findings:
Hoelzel et al. (1993) reported no heterozygosity across 43 loci in 61 individuals tested.
Estimated current heterozygosity (H) to be approximately 0.409, while in populations in South Georgia, H was estimated at 0.980.