Cardiology
Introduction to Cardiovascular Basics
Introduction to Cardiovascular Basics
Describe the physiology of the cardiac system including:
Path of the blood flow through the heart:
The heart is not one unit, but two separate pumps operating in series.
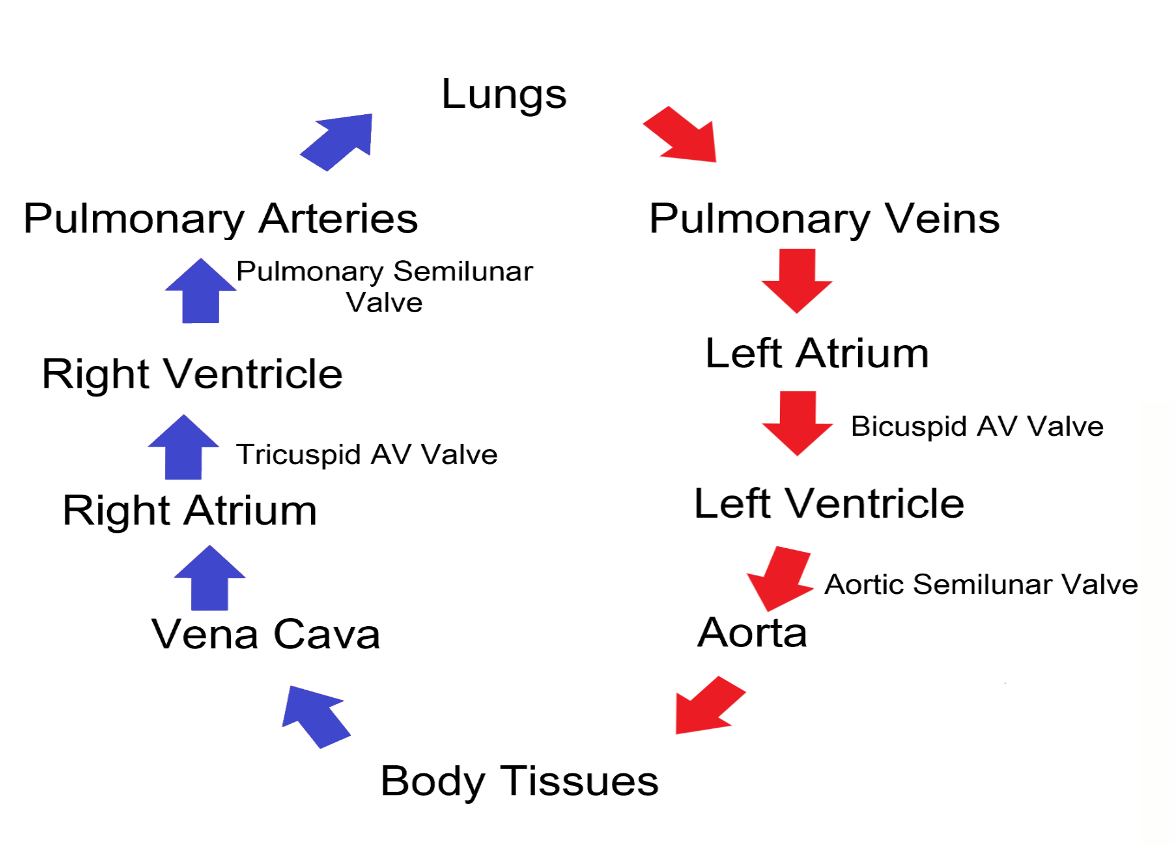
Systemic flow:
SVC deoxygenated blood from the upper body.
IVC- deoxygenated blood form the lower body.
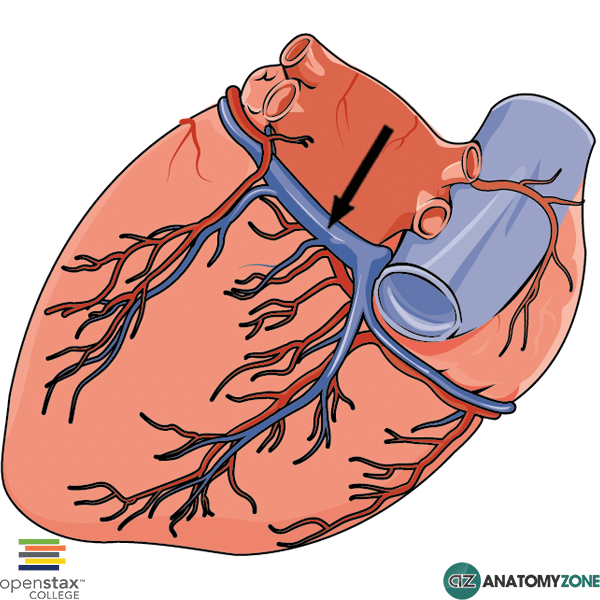
Coronary Sinus- deoxygenated form the myocardium
Coronary sinus (largest vein in the heart)
Physiological significance of the pericardial space and pericardium
—Fibrous pericardium: outermost (tough)
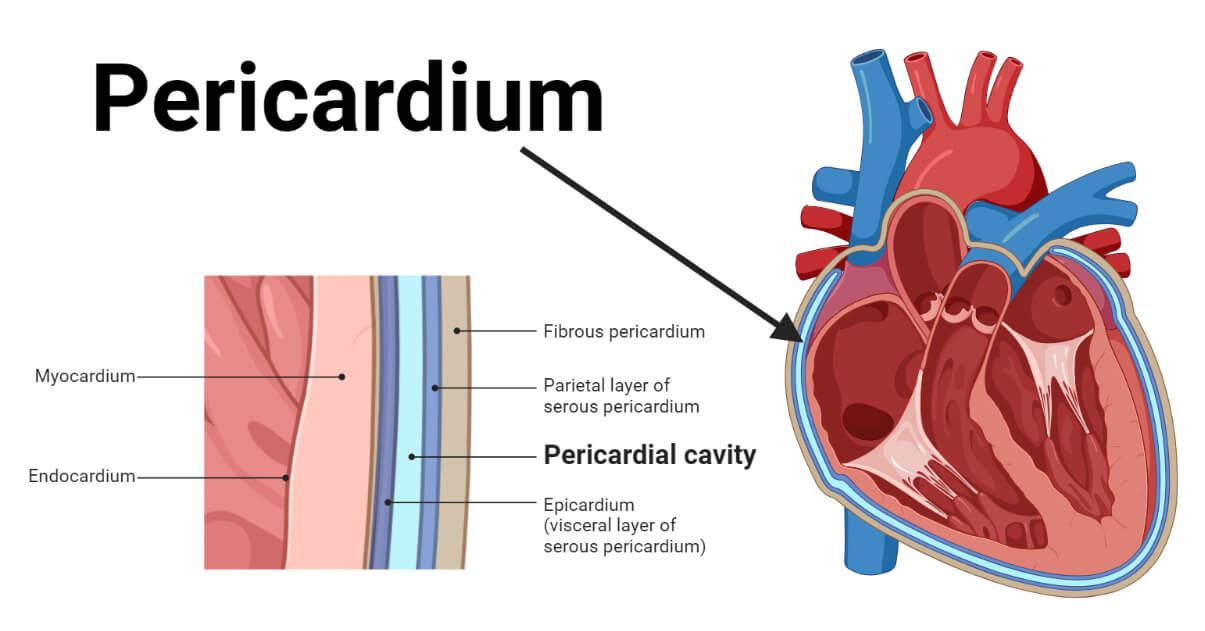
Rapid fluid accumulation causes cardiac tamponade because the inelastic fibrous pericardium cannot stretch quickly, whereas slow fluid accumulation allows the pericardium to gradually expand and accommodate much larger volumes.
—Parietal pericardium: lines inner surface of pericardium
—Visceral pericardium: touches the directly the myocardium.
Location | Function | |
|---|---|---|
Fibrous pericardium | Outermost | Tough protection, prevents overfilling |
Parietal pericardium | Lines fibrous layer | Forms outer serous membrane |
Pericardial space | Between parietal and visceral layers | Contains lubricating fluid |
Visceral pericardium (Epicardium) | Directly on heart surface | Covers myocardium; contains coronary vessels, fat, and nerves |
Pericardial Space: Contains 15-50ml of serous fluid
Functions as a dynamic lubricant to minimize friction during the constant movement of the cardiac cycle.
Physiological significance of the coronary arteries:
—The coronary arteries supply oxygen-rich blood to the heart muscle (myocardium).
Both the right coronary artery (RCA) and left coronary artery (LCA) originate from the aortic root, just above (superior to) the aortic valve.
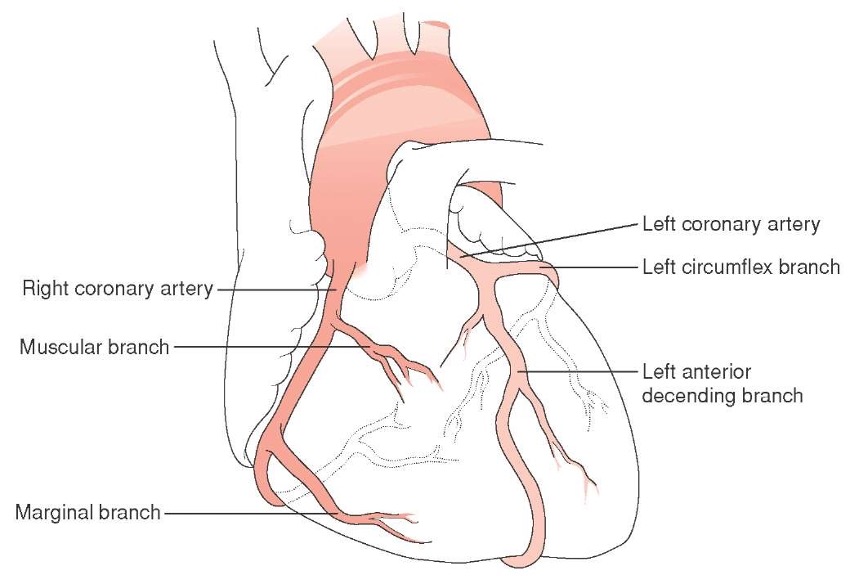
Epicardial Coronary Arteries fill during DIASTOLE (relaxes) when pressures within the Aorta drop.
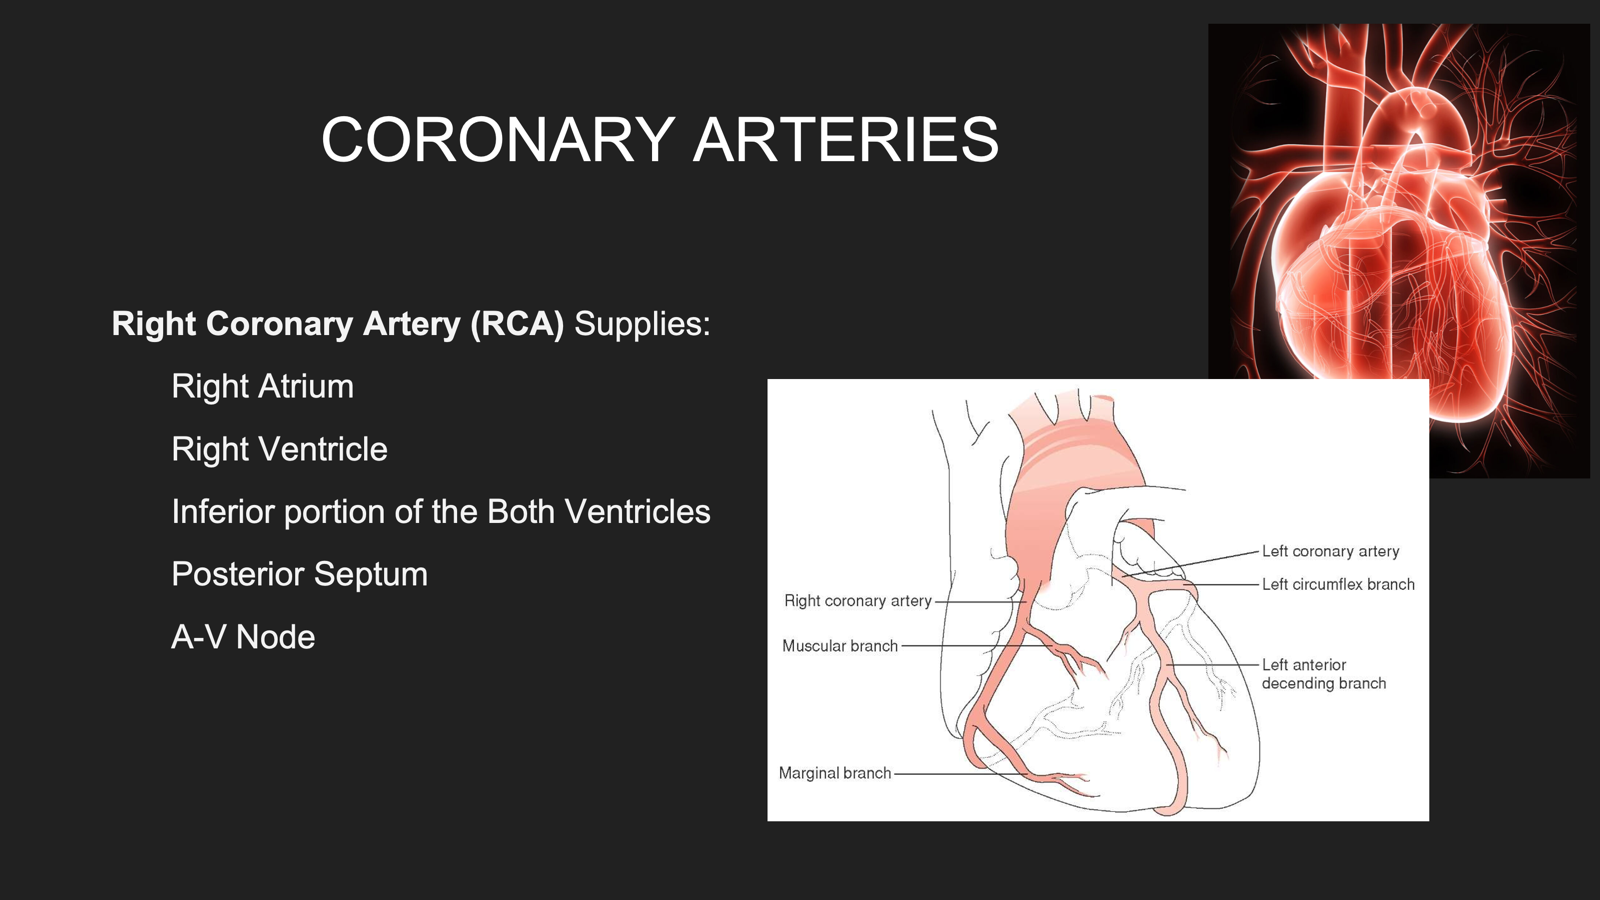
LMCA splits into LAD and LCX.
-LAD supplies the anterior left ventricle, apex, and anterior septum.
LCX supplies the left atrium and the lateral/posterior left ventricle.
LAD occlusion causes a large anterior myocardial infarction and is the classic "widow-maker" artery.

The right coronary artery supplies the right atrium, right ventricle, inferior portions of both ventricles, the posterior interventricular septum, and, in most people, the AV node, making it important for both heart muscle perfusion and electrical conduction.
Coronary artery dominance is determined by the artery that gives rise to the posterior descending artery (PDA): the RCA in right-dominant hearts, the LCX in left-dominant hearts, and both arteries in co-dominant hearts.
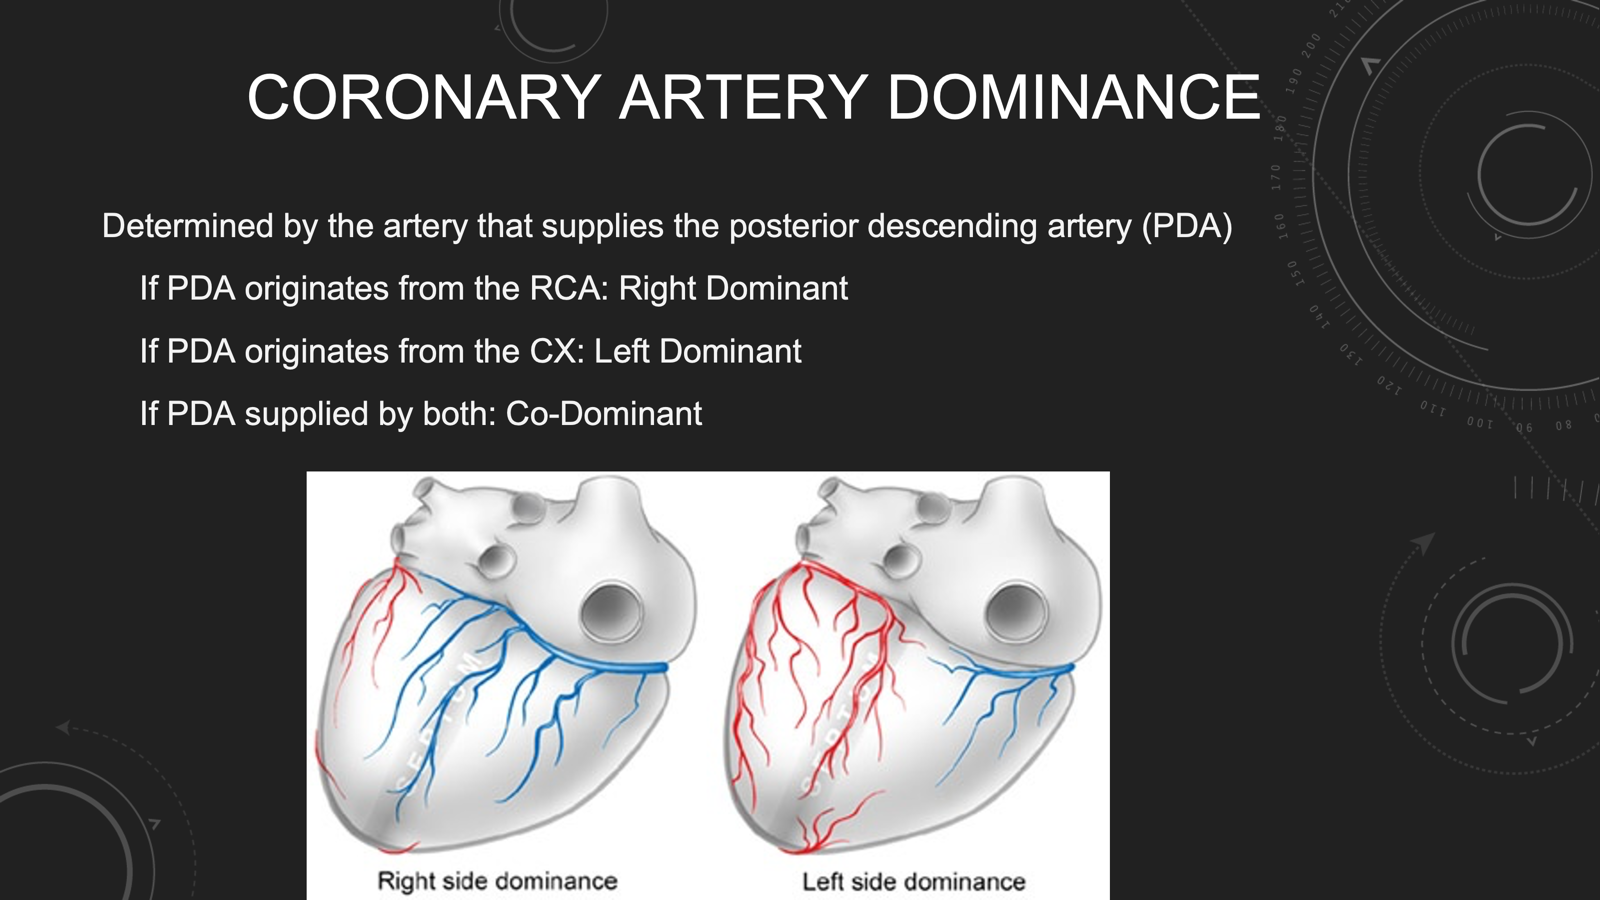
Mnemonic:
RCA → Right dominant
LCX → Left dominant
Both → Co-dominant
—Unlike most arteries, the coronary arteries receive most of their blood flow during diastole because the heart muscle relaxes, relieving compression of the coronary vessels and allowing blood to flow into the myocardium.
Systole (Heart Squeezes) | Diastole (Heart Relaxes) |
|---|---|
Coronary arteries compressed | Coronary arteries open |
Little coronary blood flow | Maximum coronary blood flow |
Aortic valve open | Aortic valve closed |
Heart pumps blood to body | Heart receives its own blood supply |
—During diastole, the ventricles relax and stop compressing the coronary arteries, while the elastic recoil of the aorta pushes blood into the coronary artery openings, allowing the heart muscle to receive oxygen-rich blood.

Path of electrical stimulation through the heart:
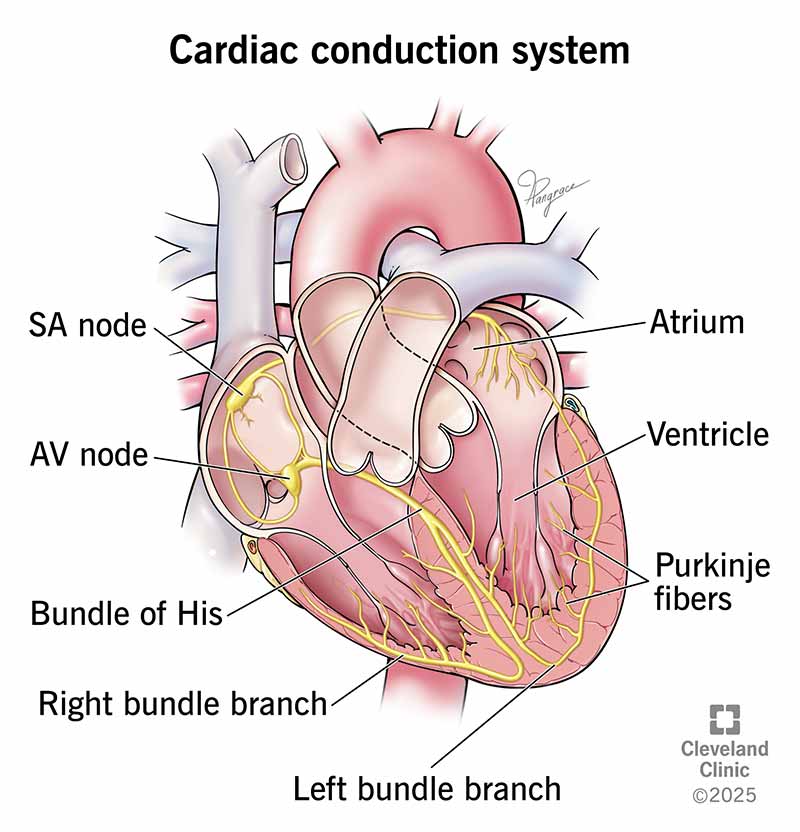
Overview:
Structure | Function |
|---|---|
SA Node | Starts the heartbeat (pacemaker) |
Atria | Contract and fill the ventricles |
AV Node | Delays the signal so ventricles can fill |
Bundle of His | Carries the impulse from atria to ventricles |
Bundle Branches | Carry the signal down the septum |
Purkinje Fibers | Spread the signal rapidly through the ventricles, causing contraction |
Peacemaker cells:
Feature | What Happens? |
|---|---|
Pacemaker cells | Generate electrical impulses automatically |
Na⁺ & Ca²⁺ enter | Slowly make the cell more positive |
Automatic depolarization | Cell reaches threshold and fires on its own |
Sympathetic nervous system | Speeds up depolarization → ↑ Heart rate |
Parasympathetic nervous system | Slows depolarization → ↓ Heart rate |
Pacemaker cells automatically generate electrical impulses because Na⁺ and Ca²⁺ slowly enter the cells, causing automatic depolarization; the sympathetic nervous system speeds up this process to increase heart rate, while the parasympathetic nervous system slows it down to decrease heart rate.
— The SA node is the heart's primary pacemaker because it fires the fastest, suppressing slower backup pacemakers; if these backup or ectopic pacemaker cells become abnormally active, they can produce arrhythmias.
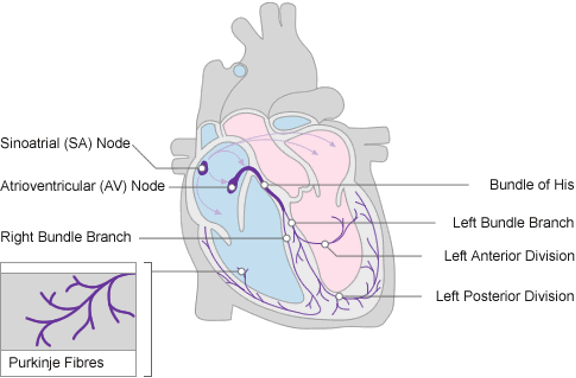
The SA node starts the heartbeat, the internodal pathways carry the electrical signal to the AV node, and Bachmann's bundle carries the signal to the left atrium so both atria depolarize and contract at the same time.
SA = Start
Internodal = Inside the right atrium
Bachmann = Bridge to the left atrium
AV = Arrives after the atria contract
Bachmann's Bundle
Carries impulse across interatrial septum
Right and left atria depolarize simultaneously
AV NODE: AV Node
Located in the subendocardium of the interatrial septum.
Functions:
Slows conduction
Introduces intentional delay
Allows atria to finish contracting
Maximizes ventricular filling
Protects ventricles from rapid rhythms such as atrial fibrillation
Bundle of His
Penetrates fibrous skeleton
Electrical insulator between atria and ventricles
Conduction speeds up
Divides into right and left bundle branches
Purkinje Fibers
Fastest conduction in the heart
Depolarize ventricular myocardium simultaneously
Produce contraction beginning at the apex and moving upward
Conductivity Concerns
Rapid conducting abnormal tracts:
Reentry circuits
Tachycardia
Diseased conduction tissue:
Electrical block
Heart block
Conduction Pathway
SA Node
Internodal Pathways
Bachmann's Bundle
AV Node
Bundle of His
Right & Left Bundle Branches
Purkinje Fiber Network
Pressure-time
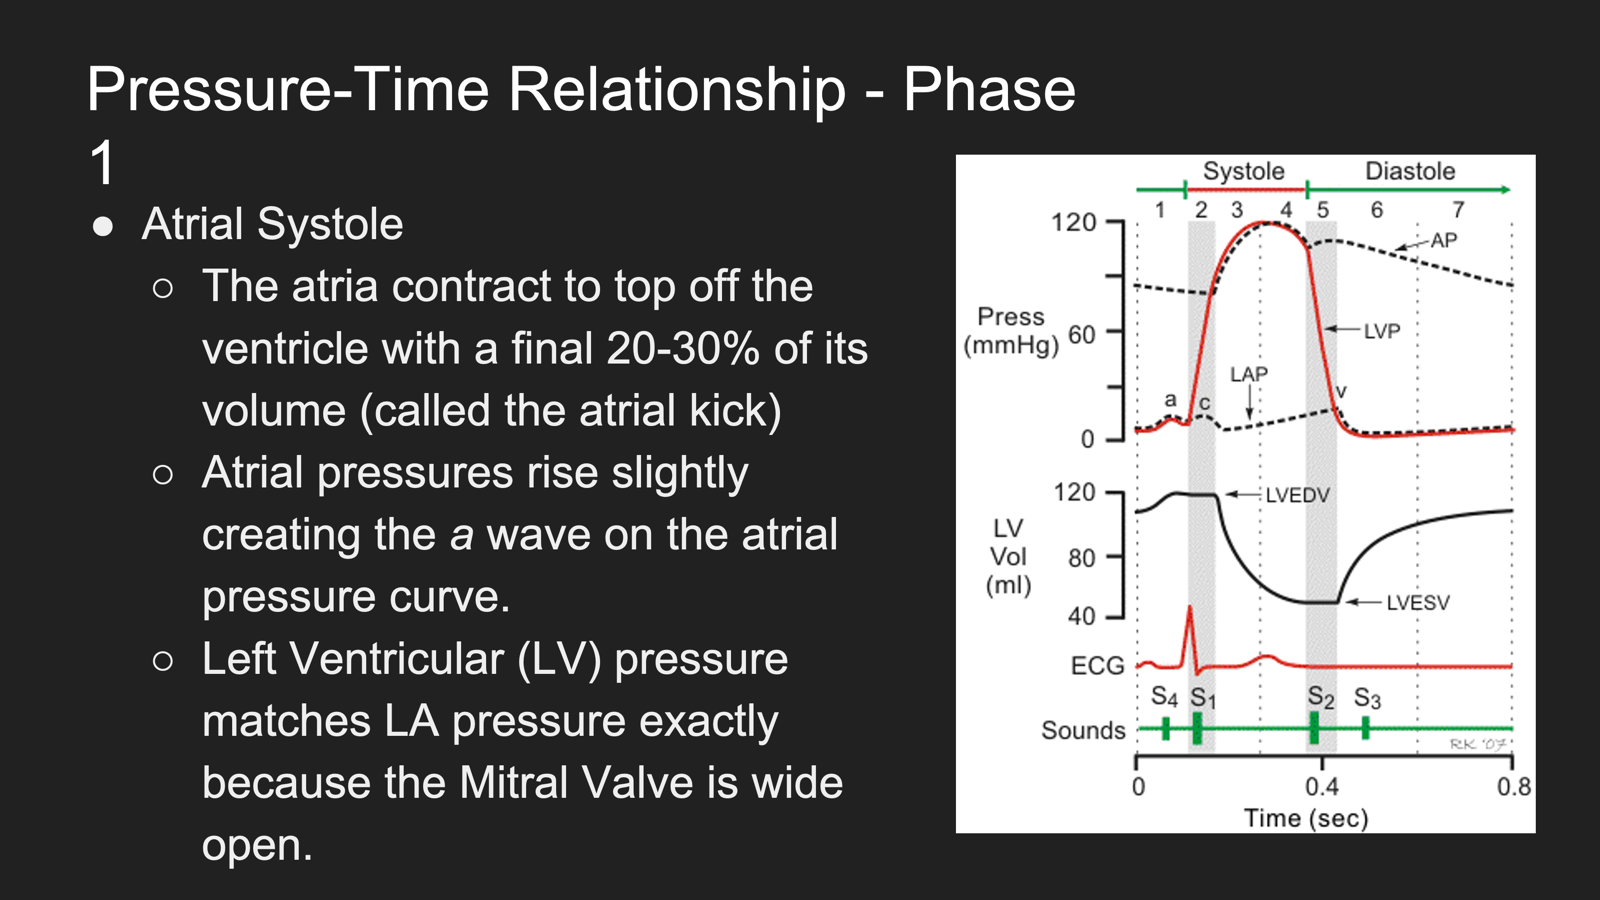
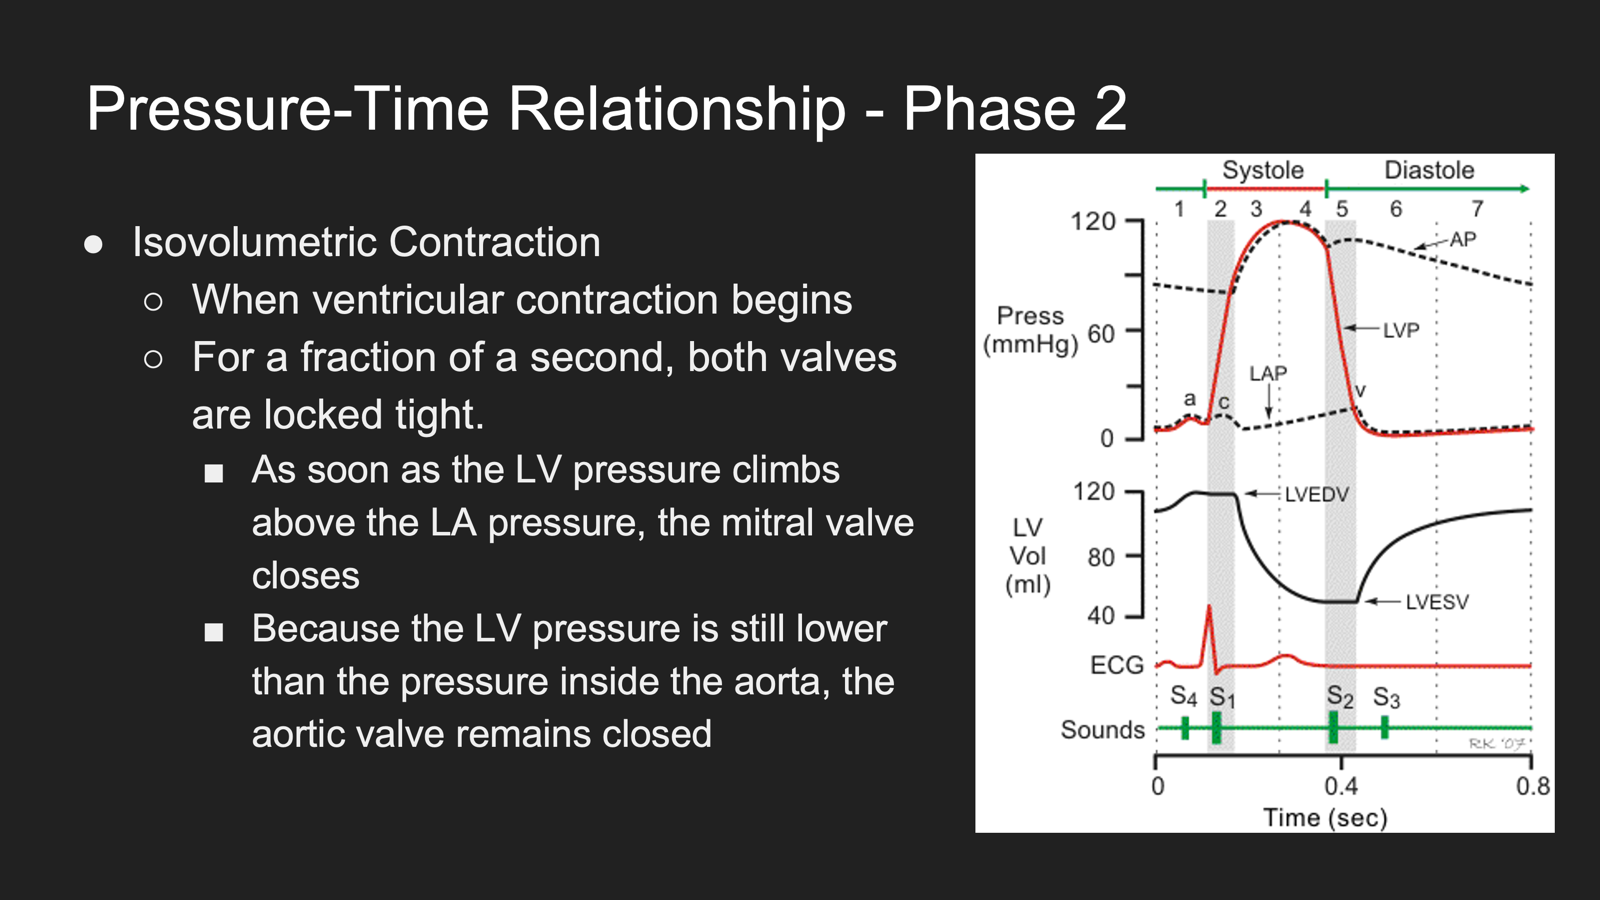
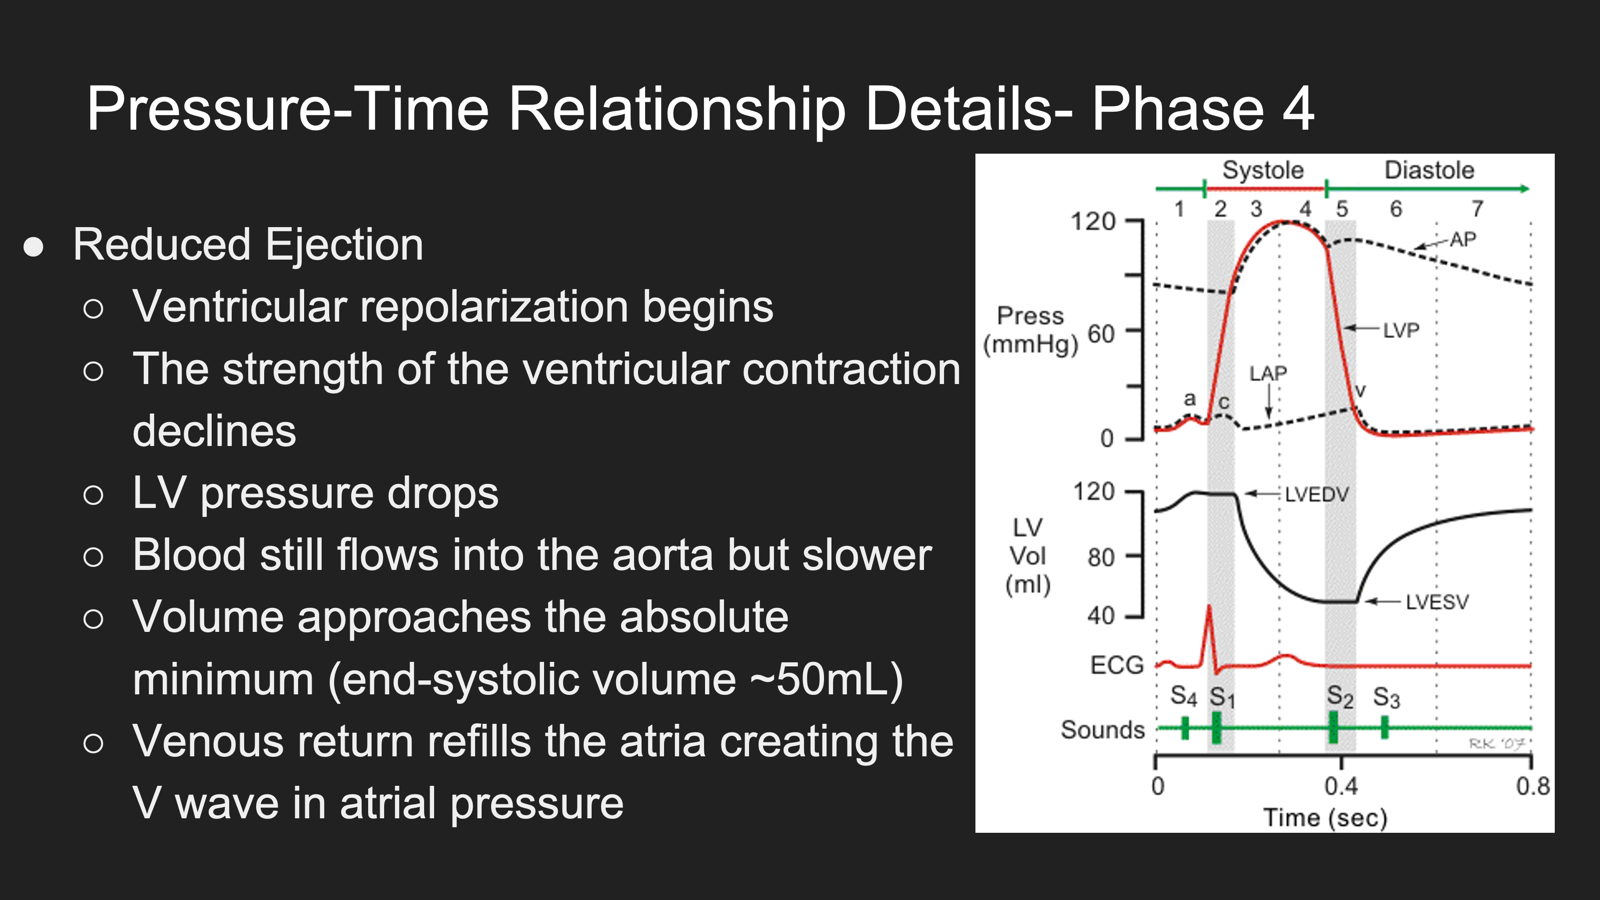
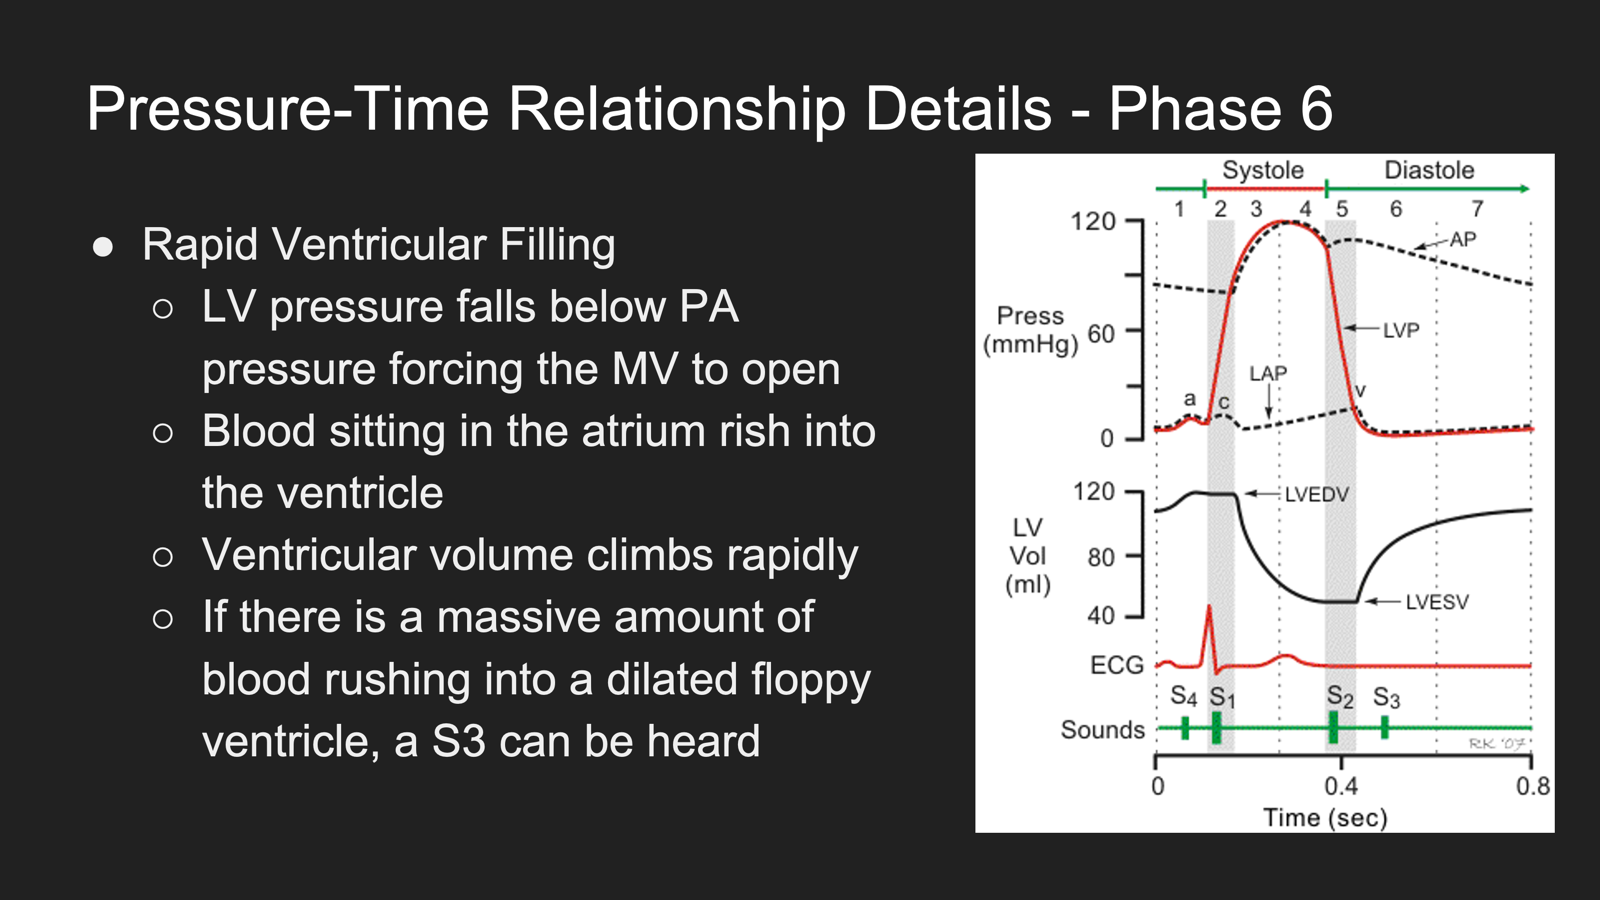
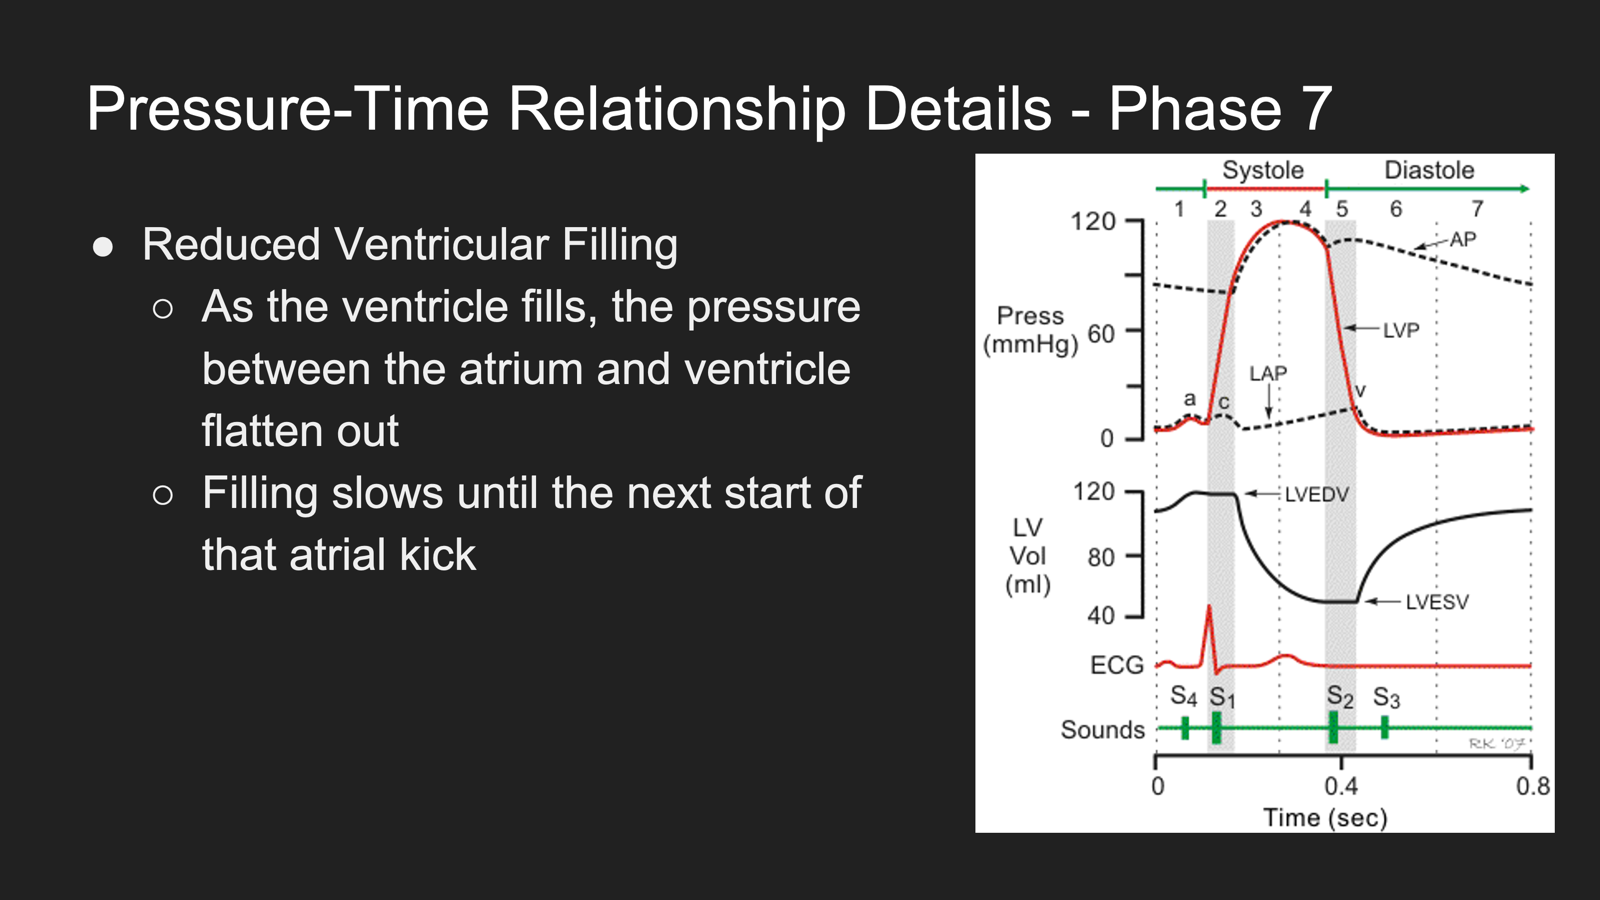
Pressure-Time Relationship (Wiggers Diagram)

Displays:
Left atrial pressure
Left ventricular pressure
Aortic pressure
Ventricular volume
ECG
Phonocardiogram (heart sounds)
Basic concept:
Pressure rises during contraction.
Pressure falls during relaxation.
Valves close when blood attempts to flow backward.
Phases
Atrial systole
Isovolumetric contraction
Rapid ejection
Reduced ejection
Isovolumetric relaxation
Rapid ventricular filling
Reduced ventricular filling


pressure-volume relationship
Pressure-Volume Relationship
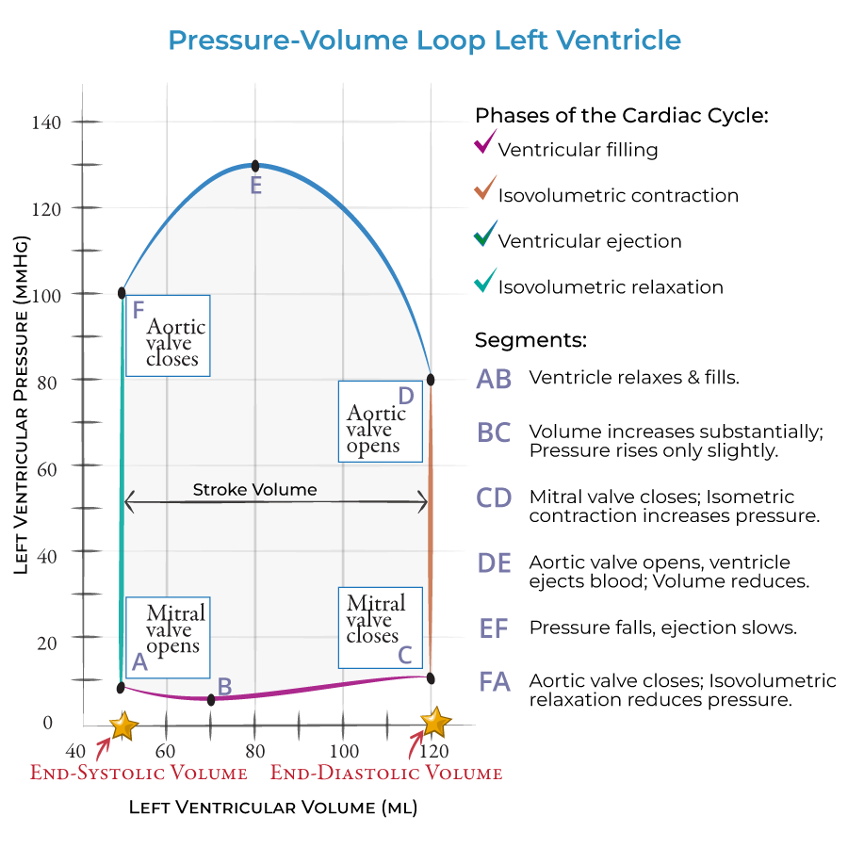
Point A
Mitral valve opens
Segment A→C
Ventricular filling
Volume increases from ESV to EDV
Determined by EDPVR (ventricular compliance)
Point C
Mitral valve closes
Volume = EDV
Segment C→D
Isovolumetric contraction
Pressure rises
Volume constant
Point D
Aortic valve opens
Pressure equals diastolic blood pressure
Segment D→F
Ventricular ejection
Volume falls
Peak equals systolic blood pressure
Point F
Aortic valve closes
Volume = ESV
Segment F→A
Isovolumetric relaxation
Pressure falls
Volume constant
Essential Calculations
Stroke Volume (SV)
SV = EDV − ESV
Represents the width of the pressure-volume loop.
Preload
Amount of blood entering the heart.
As preload increases:
Stroke volume increases.
Ejection Fraction (EF)
EF = (SV / EDV) × 100%
ESPVR
Connects Point F across multiple heartbeats.
Slope measures inotropy (contractility).
Steeper slope = stronger heart.
Phase | Actual Information (From PDF) | Simple Explanation |
|---|---|---|
1. Atrial Systole | Atria contract, adding the final 20–30% of ventricular filling (atrial kick). Atrial pressure rises creating the a wave. LV pressure matches LA pressure because the mitral valve is open. | ❤ Atria give the ventricle one last push of blood before it pumps. |
2. Isovolumetric Contraction | Ventricles begin contracting. Mitral valve closes because LV pressure exceeds LA pressure. Aortic valve remains closed because LV pressure is still lower than aortic pressure. Both valves are closed. Volume remains at EDV (~120 mL)while pressure rises rapidly. The c wave occurs from the mitral valve bulging into the atrium. | 🚪 Both doors are closed. The ventricle squeezes, so pressure goes up, but no blood can move. |
3. Rapid Ejection | LV pressure exceeds aortic diastolic pressure (~80 mmHg). Aortic valve opens. Blood rapidly enters the aorta. LV and aortic pressures rise together to about 120 mmHg. Ventricular volume decreases. | 🚀 Pressure becomes high enough to open the aortic valve, and blood shoots out. |
4. Reduced Ejection | Ventricular repolarization begins. Contraction weakens. LV pressure falls. Blood continues leaving more slowly. Volume reaches ESV (~50 mL). Venous return fills the atria, producing the v wave. | 🩸 The ventricle is still pumping, but it's slowing down. |
5. Isovolumetric Relaxation | Ventricle relaxes. Aortic valve closes. Mitral valve remains closed because LV pressure is still higher than LA pressure. Volume stays constant at ESV while pressure falls rapidly. | 😌 The ventricle relaxes. Both valves are closed again, so pressure drops but blood doesn't move. |
6. Rapid Ventricular Filling | LV pressure becomes lower than LA pressure. Mitral valve opens. Blood rapidly enters the ventricle. An S3 may be heard if a large volume rapidly enters a dilated ventricle. | 💧 The mitral valve opens and blood rushes into the ventricle. |
7. Reduced Ventricular Filling | Pressure between atrium and ventricle equalizes. Filling slows until the next atrial contraction. | ⏳ The ventricle slowly finishes filling while waiting for the next heartbeat. |
Term | Actual Information (From PDF) | Easy Way to Remember |
|---|---|---|
Stroke Volume (SV) | SV = EDV − ESV | ❤ Amount of blood pumped out each heartbeat. |
Preload | Amount of blood entering the heart. As preload increases, stroke volume increases. | 🪣 How full the ventricle is before it pumps. |
Ejection Fraction (EF) | EF = (SV / EDV) × 100% | 📊 The percentage of blood pumped out of the ventricle. |
ESPVR | Slope measures contractility (inotropy). A steeper slope means a stronger heart. | 💪 Steeper line = stronger squeeze. |
Heart Sound | Actual Information | Simple Explanation |
|---|---|---|
S1 ("Lub") | Occurs when the mitral and tricuspid valves close at the beginning of systole. | 🔊 Start pumping. |
S2 ("Dub") | Occurs when the aortic and pulmonic valves close at the beginning of diastole. | 🔊 Start filling. |
Pressure-Volume Relationship (PV Loop)
Point | Valve Event | What It Means |
|---|---|---|
A | Mitral valve opens | Start of ventricular filling |
C | Mitral valve closes | End-Diastolic Volume (EDV) reached |
D | Aortic valve opens | Blood begins leaving the ventricle |
F | Aortic valve closes | End-Systolic Volume (ESV) reached |
The Four Sides of the PV Loop
Segment | What Happens | Pressure | Volume |
|---|---|---|---|
A → C | Ventricular filling | Slight increase | Increases from ESV → EDV |
C → D | Isovolumetric contraction | Pressure rises sharply | No volume change |
D → F | Ventricular ejection | Pressure rises then falls | Volume decreases |
F → A | Isovolumetric relaxation | Pressure falls sharply | No volume change |
Term | Meaning |
|---|---|
EDV (End-Diastolic Volume) | Maximum amount of blood in the ventricle before contraction (~120 mL). |
ESV (End-Systolic Volume) | Blood remaining after contraction (~50 mL). |
Stroke Volume (SV) | Blood pumped out in one beat. SV = EDV − ESV |
Preload | Amount of blood entering the heart. Increased preload increases SV. |
Ejection Fraction (EF) | Percentage of EDV pumped out. EF = (SV / EDV) × 100% |
EDPVR | End-Diastolic Pressure-Volume Relationship; reflects ventricular compliance (stiffness). |
ESPVR | End-Systolic Pressure-Volume Relationship; slope reflects contractility (inotropy). A steeper slope indicates a stronger heart. |
Ultrastructure of the myocytes and excitation-contraction coupling:
Cardiac Myocytes
Characteristics:
Specialized muscle cells
Form the myocardium
Responsible for contraction
Single nucleus
Abundant mitochondria
Highly organized contractile proteins
Myofibrils
Contain hundreds of parallel striated bundles.
Composed of:
Sarcomeres
Sarcomeres are the major contractile unit.
Sarcomeres
Contain:
Actin
Myosin
Cross-bridges
Tropomyosin
Myocytes contract after electrical stimulation.
Excitation-Contraction Coupling
Step 1
Membrane depolarizes.
Action potential travels over sarcolemma and into T-tubules.
Step 2
Calcium influx.
Voltage change opens calcium channels.
Small amount of extracellular calcium enters.
Step 3
Calcium-induced calcium release.
Calcium binds receptors on sarcoplasmic reticulum.
Large amount of calcium released.
Step 4
Conformational shift.
Calcium binds Troponin C.
Tropomyosin moves.
Actin binding sites become exposed.
Step 5
Contraction.
Myosin binds actin.
Myosin pulls actin toward the center of the sarcomere.
Sarcomere shortens.
Relaxation
For relaxation:
Calcium pumped back into sarcoplasmic reticulum.
Calcium pumped out through sarcolemma using the sodium-calcium exchanger.
Structure | Actual Information (From PDF) | Easy Explanation |
|---|---|---|
Cardiac Myocyte | Specialized muscle cell that makes up the myocardium and is responsible for the contractile function of the heart. Elongated cell with a single nucleus, abundant mitochondria, and highly organized contractile proteins. | ❤ The heart muscle cell that does the actual pumping. |
Myofibrils | Hundreds of parallel striated bundles inside each myocyte. | 🏗 Bundles of muscle fibers inside the cell. |
Sarcomere | Major contractile unit of the myocyte. | 💪 The smallest unit that actually shortens to make the heart contract. |
Actin | Contractile protein in the sarcomere. | 🪢 The "rope" that gets pulled during contraction. |
Myosin | Contractile protein connected to actin by cross-bridges. | 🖐 The "hands" that grab and pull actin. |
Tropomyosin | Regulatory protein that lies in the grooves of actin and covers the myosin-binding sites when the muscle is resting. | 🚧 A cover that blocks myosin from attaching to actin. |
Troponin Complex | Regulatory protein complex attached to tropomyosin. | 🔑 Acts like a switch that controls contraction. |
Troponin T | Anchors the troponin complex to tropomyosin. | 📎 Keeps the troponin complex attached. |
Troponin I | Binds actin when calcium is absent and blocks myosin binding. | 🛑 Keeps the muscle relaxed. |
Troponin C | Contains calcium-binding sites. Calcium binding starts contraction. | 🔓 Calcium's docking station that starts muscle contraction. |
Excitation-Contraction Coupling
Step | Actual Information (From PDF) | Easy Explanation |
|---|---|---|
Step 1: Membrane Depolarization | Action potential travels across the sarcolemma and down the T-tubules. | ⚡ An electrical signal tells the heart cell to contract. |
Step 2: Calcium Influx | Voltage change opens calcium channels. A small amount of extracellular Ca²⁺ enters between the T-tubule and sarcoplasmic reticulum. | 🚪 The electrical signal opens a small door, letting calcium into the cell. |
Step 3: Calcium-Induced Calcium Release | Incoming calcium binds receptors on the sarcoplasmic reticulum, causing a large release of stored calcium. | 🌊 A little calcium triggers a huge wave of calcium release. |
Step 4: Conformational Shift | Calcium binds to Troponin C, changing its shape. Tropomyosin moves away from actin, exposing the myosin-binding sites. | 🔓 Calcium unlocks the binding sites so myosin can grab actin. |
Step 5: Contraction | Myosin heads bind exposed actin and pull the actin filaments toward the center of the sarcomere, shortening the cell. | 💪 Myosin pulls actin, making the heart muscle shorten and pump blood. |
Contractile and Regulatory proteins including Actin, Myosin, Troponin, Tropomysin:
Myosin
Contractile protein that binds exposed actin during contraction.
Tropomyosin
Winds into grooves of actin.
In the resting state, covers myosin-binding sites on actin.
Troponin
Troponin T
Anchors troponin complex to tropomyosin.
Troponin I
Binds actin in the absence of calcium.
Maintains inhibitory position to block myosin binding.
Troponin C
Contains calcium-binding sites.
Single functional low-affinity calcium-binding site in cardiac muscle.
Primary switch for contraction.
Troponin as a Serum Biomarker
During severe ischemic injury or acute myocardial infarction:
Cell membranes rupture.
Intracellular proteins leak into the bloodstream.
Cardiac-specific Troponin I (cTnI) and Troponin T (cTnT) are highly sensitive and specific markers of myocardial injury.
Protein | Type | Actual Information (From PDF) | Function | Easy Explanation / Memory Trick |
|---|---|---|---|---|
Actin | Contractile Protein | Contractile protein that forms part of the sarcomere. Myosin binds to exposed actin during contraction. | Provides the filament that is pulled during muscle contraction. | 🪢 The rope that gets pulled. |
Myosin | Contractile Protein | Contractile protein connected to actin by cross-bridges. During contraction, the myosin head binds actin and flexes, pulling the actin filament toward the center of the sarcomere. | Pulls actin to shorten the sarcomere and produce contraction. | 💪 The hands that grab and pull the rope (actin). |
Tropomyosin | Regulatory Protein | Winds into the grooves of the actin filament. In the resting state, it covers the myosin-binding sites on actin. | Prevents myosin from binding to actin when the muscle is relaxed. | 🚧 The cover or gate that blocks the binding sites. |
Troponin T | Regulatory Protein | Anchors the troponin complex to the tropomyosin molecule. | Holds the troponin complex in place. | 📎 T = Ties troponin to tropomyosin. |
Troponin I | Regulatory Protein | Binds to actin in the absence of calcium, helping keep the troponin-tropomyosin complex in its inhibitory position to block myosin binding. | Prevents contraction when calcium is absent. | 🛑 I = Inhibits contraction. |
Troponin C | Regulatory Protein | Has calcium-binding sites. In cardiac muscle, one functional low-affinity calcium-binding site acts as the primary switch for contraction. Calcium binding changes troponin's shape and moves tropomyosin away from actin. | Starts contraction when calcium binds. | 🔑 C = Calcium binds here to start contraction. |
Step | What Happens (From PDF) | Easy Explanation |
|---|---|---|
1 | Tropomyosin covers the myosin-binding sites on actin. | 🚧 The binding sites are blocked. |
2 | Calcium enters the cell and binds to Troponin C. | 🔑 Calcium unlocks the system. |
3 | Troponin changes shape. | 🔄 The switch is turned on. |
4 | Tropomyosin moves away from actin. | 🚪 The gate opens. |
5 | Myosin binds to exposed actin. | 🤝 The hands grab the rope. |
6 | Myosin pulls actin toward the center of the sarcomere. | 💪 The muscle shortens and contracts. |
7 | Calcium is removed, and tropomyosin blocks the binding sites again. | 😌 The muscle relaxes. |