L2 - Imaging the Cell
Background Knowledge in Microscopy:
Anton van Leeuwenhoek(1632-1723):
- Built many simple, single lens microscopes
- First to observe living protozoa and bacteria which he called “animalcules”
- Went on to visualize human red blood cells and sperm
- With great skill at grinding lenses, naturally acute eyesight and lots of patience he was able to achieve a magnification of 200X.
Resolution:
- the ability to distinguish between two very closely positioned object as separate entities,
- distance resolved between 2 points,
- smaller resolution is better.
- To lower the resolution:
- Better objective,
- Oil and water for higher n
- Lower angle.
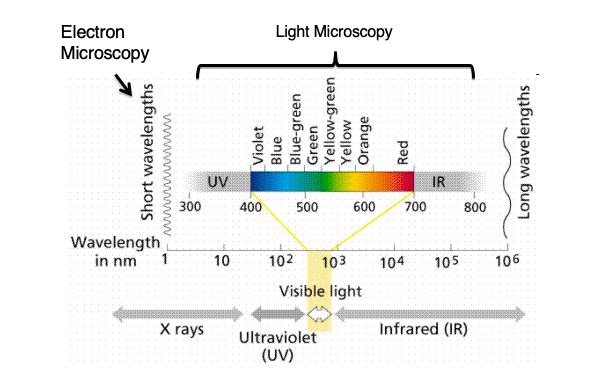
Wavelength Spectrum used in Microscopy:
Modern Compound Microscope:
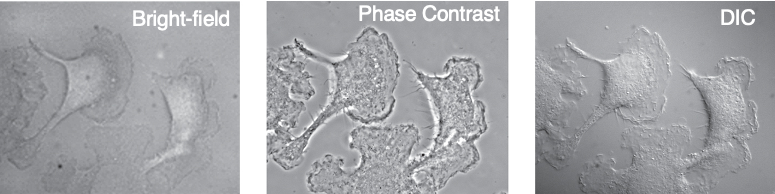
Bright-field Microscopy:
Properties of Bright-field Microscopy:
- typical light microscope magnification is 40 to 1000X
- only structures with a high refractive index (ability to bend light) are observable
- refractive property of the specimen allow us to see with microscopes.
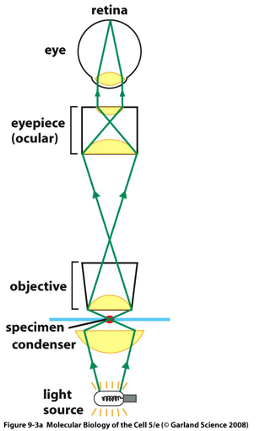
Structure of Bright-field Microscopy:
- light source
- condenser lens to focus light on specimen
- objective lens to collect light after it has passed through specimen
- ocular or eyepiece lens to focus image onto eye
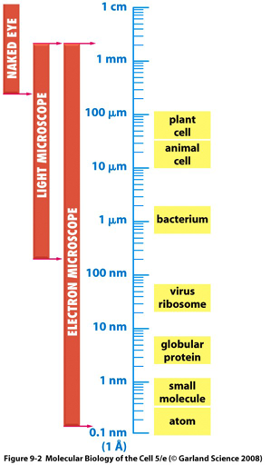
Resolution of Microscopes:
- a conventional light microscope usually cannot resolve objects/cellular features that are less than ~0.2 mM apart.
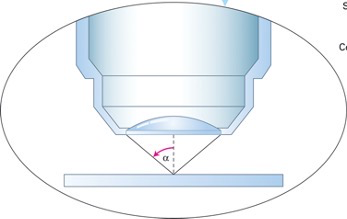
- Resolution = D (of Bright Field Microscope):
- 0.61 = natural wavelength of light passing through the specimen
- λ: wavelength of light
- N sinα: numerical aperture(higher is better)
- N: refractive index of medium between the specimen and the objective lens
- α:1/2 angle of light entering objective
- The limit of resolution is 0.2 mm=200 nm
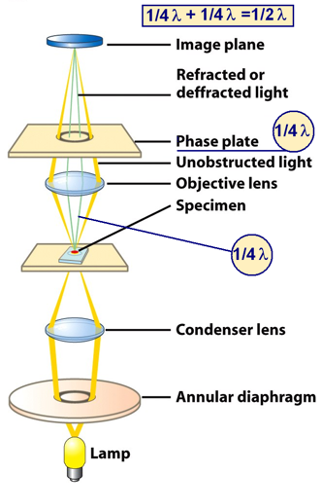
Phase Contrast Microscopy:
Obtaining contrast in light microscopy by exploiting changes in the phase of light:
- Refractive ability = ability to bend light
- Nucleus has dense amino acid, slows down light the most.
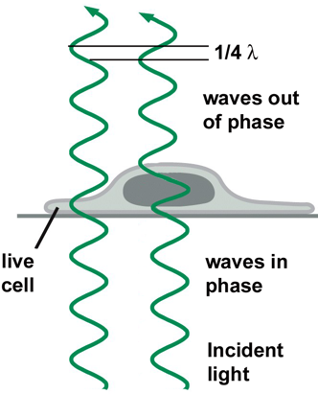
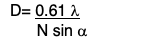
Interference of Light:
- certain parts of the cell (i.e. nucleus) refract light more than other parts
- cellular constituents with high refractive properties can slow the passage of a light beam by a quarter wavelength (~1/4λ)
- two waves out of phase interfere and cancel each other to be dimmer.
Properties of Phase Contrast Microscope:
- Used to examine live “unstained” cells
- Live or fixed
- Small differences in refractive index & thickness within the cell are further exploited and converted into contrast visible to the eye
- allows us to see more details
Mechanism of Phase Contrast Microscope:
- interference of two phases dims light as the two slowed light rays cancel each other
- un-refracted light show the bright background
- light is superposed on the porifera of the cells,
- fast and slow light create a stronger light around the cells as they create a phase
- discern cellular data for both live and dead cells
Differential Interference Contrast Microscopy (Normarski microscopy):
Properties of Differential Interference Contrast Microscopy:
- Small differences in refractive index & thickness within the cell are converted into contrast visible to the eye
- separates light
- Defines the outline of large organelles such as nucleus and vacuole and provides better detail of cell edge
- Sharper image than Phase Contract
- “shadow” primarily represents a difference in refractive index of a specimen rather than its topography (note that AFM visualizes the topography of a cell).
Phase Contrast vs DIC:
- Interfering with phase vs polar reform
- 2d vs 3d topographical shape
- 3D feature is not shadow, but instead a difference in refractive index of a specimen
- DIC has a sharper image
Fluorescence Microscopy:
Fluorescence Microscopy:
Properties of Fluorescence Microscopy:
- can be used for live cells
- uses a property of certain molecules to fluoresce,
- i.e. to emit visible light when they absorb light at a specific wavelength (e.g. invisible UV light).
- location of fluorescent dyes or fluorescent protein molecules can be imaged.
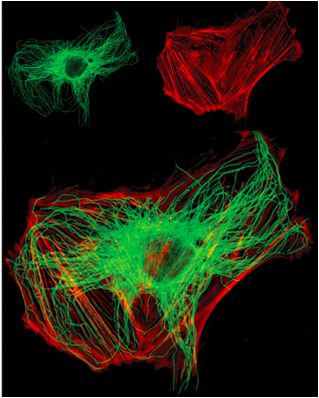
- can visualize more than one protein or cell structure:
- %%Green – Tubulin%%
- ==Red – Mitochondria==
- ^^Blue- Nuclei^^
- Fluorochromes dyes:
- Absorb energy kicking electrons (e-) into a higher orbital (unstable)
- When excited by a certain wavelength of light, it kicks off the out e- of the atoms to an upper energy level, then emits a light at lower energy level as it falls back to ground state.
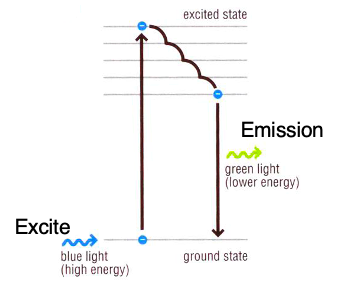
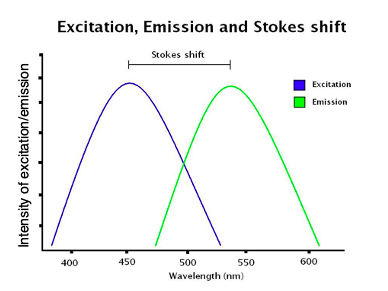
- Stoke shift:
- Difference in color of excitation and emission light
Fluorescence Imaging:
- Light source is very intense, more powerful, broader spectrum of light
- Light pathway of Fluorescence Microscopy:
- both excitation (%%green%%) and emission (==red==) light goes through objective.
- No light passes through the cell specimen
- cell specimen is labelled with fluorescent dyes that have specific excitation and emission wavelengths.
- light source (excitation) = strong, intense, short wavelength
- light output (emission) = weaker, longer wavelength
Structure of Fluroscence Microscopy:
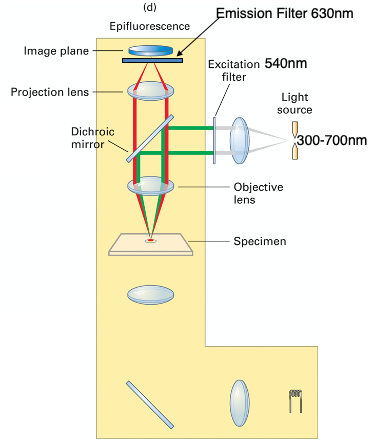
- Excitation Filter:
- Only allows light with certain wavelength.
- Dichroic mirror:
- Only reflects light with lower wavelength,
- Allows lights with longer wavelength to pass.
- Emission Filter:
- Only allows lights with certain wavelength.
- Use appropriate filters for the specific fluorochrome to optimize fluorescence images
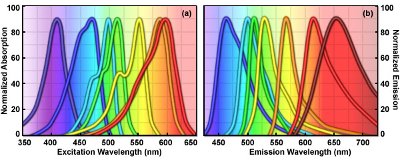
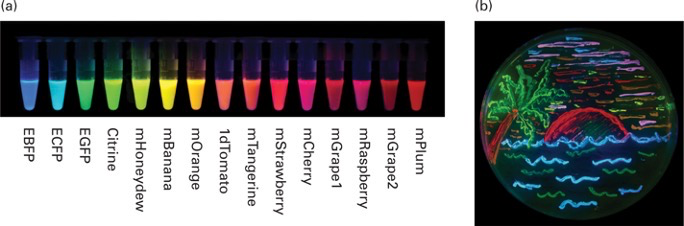
The many colours of fluorochromes:
- Signals are bright on a black background.
- A variety of fluorochromes exist with different excitation and emission wavelengths that allow labelling of more than one protein or organelle at the same time
- Chemicals linked to fluorochromes are available to stain cell structures and organelles
- Attempt to pick fluorochromes with distinct emission colour for clear presentation
- ^^DAPI to stain nuclei blue^^,
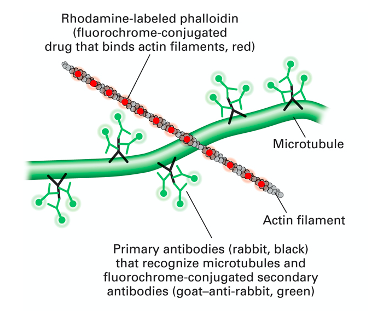
- ==Mitotracker Red or Rhodamine-labeled phalloidin to stain mitochondria or actin filaments red== respectively).
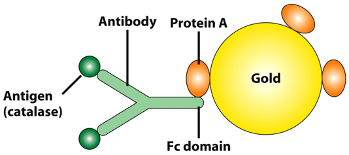
- a dye can be conjugated with antibodies to localize any molecules of your interest in cells (immunofluorescent staining).
- Antibodies with fluorescent property can be used to target specific protein
- Antibodies with fluorescent property can be used to target specific protein
Immunofluorescence Microscopy:
Monoclonal Antibody Production:
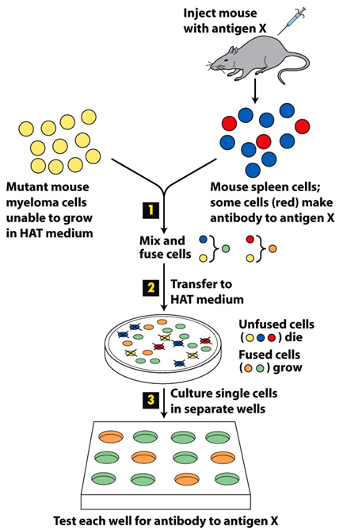 Helps to scale up the antibody for researchers and clinical use:
- HAT medium
- (a selection medium) is toxic for myeloma cells, which have mutation of specific genes.
- Kills all of the unfused myeloma cells as they are transformed and
- Hybrid cells
- survive in HAT medium because they obtain a missing gene from spleen cells,
- Spleen cells + transformed cell = cells without missing genes that can make antibody for antigen X
Properties of Immunofluorescence Microscopy:
- Restricted to fixed dead cells
- Antibodies are made to specific proteins (i.e. microtubules)
Preparation of Immunofluorescence Microscopy:
- Fixation
- Freezing, a snapshot preserving all the ultrastructure in the dead cell
- Primary antibody binding
- Antibodies are added to cells fixed on a slide which bind the specific protein they were designed to recognize
- Invisible
- Fluorochrome conjugated secondary antibody bonding
- Secondary antibodies with attached fluorochromes are added and bind the primary antibody
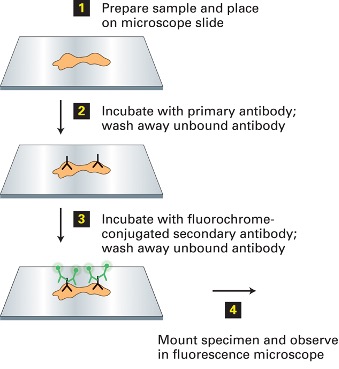
- Each fluorochrome has a unique excitation and emission wavelength that can be detected with appropriate filters in the microscope.
Dual Label Fluorescence Microscopy:
- Use appropriate microscope filter set for each fluorochrome then digitally overlay images
- Immunofluorescence is only performed on fixed (i.e. dead) cells.
- Combination of Antibodies and stains
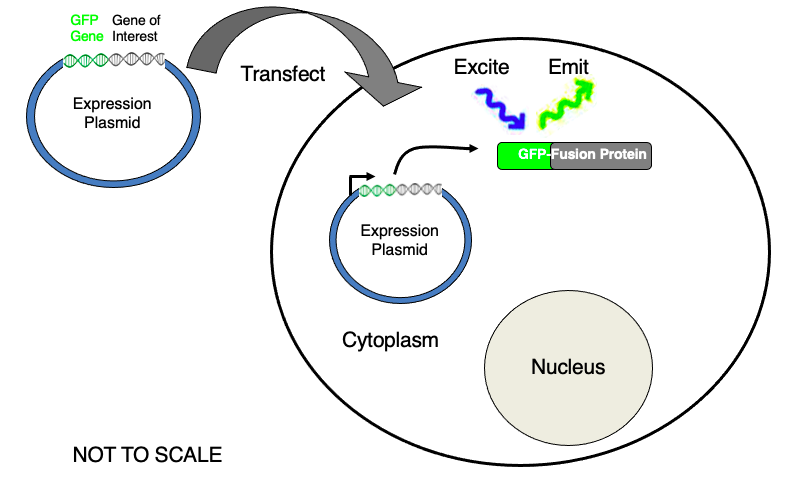
Fluorescent Imaging in Live Cells: Green Fluorescent Protein (GFP):
Fluorescent Protein
- Green Fluorescent Protein (GFP):
- Derived from a naturally occurring protein
- found in a bioluminescent jellyfish
- contains a short sequence of amino acids (chromophore) that
- fluoresce when excited with blue light
- Fluorescent proteins come in many different flavors:
- By mutating various amino acids in GFP, new types of fluorescent proteins were created with different excitation and emission profiles
- All have their own excitation and emission profile
Mechanism of Fluorescent Imaging
- Gene isolated and heavily modified to encode for a protein with properties ideally suited for live cell fluorescent imaging
- GFP-Fusion proteins allow fluorescent imaging in live cells:
- emitting green light in live cells to identify protein of interest
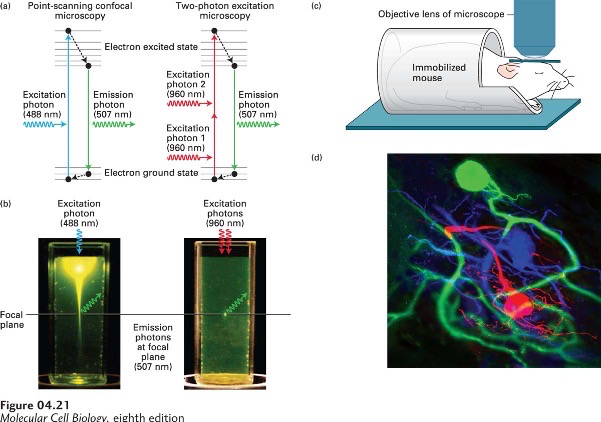
Two-Photon Excitation Microscopy for Imaging Deep into Tissue Samples:
Mechanism of Two-Photon Excitation Microscopy
- Certain fluorochromes can be excited by either by a single photon or by two photons at half the energy
- 1 *** 488 nm or 2 * 960 nm – will generate the same emission wavelength
- Two-photon microscopy can be used to explore much thicker samples (longer wavelength)
- Because only fluorochromes in the focal plane are excited,
- there is no need for a pinhole to exclude out-of-focus light.
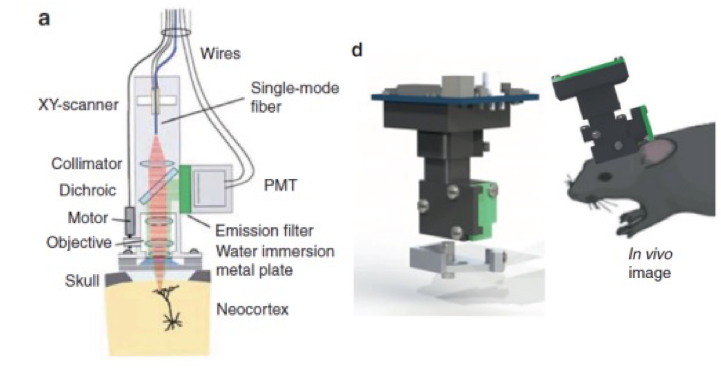
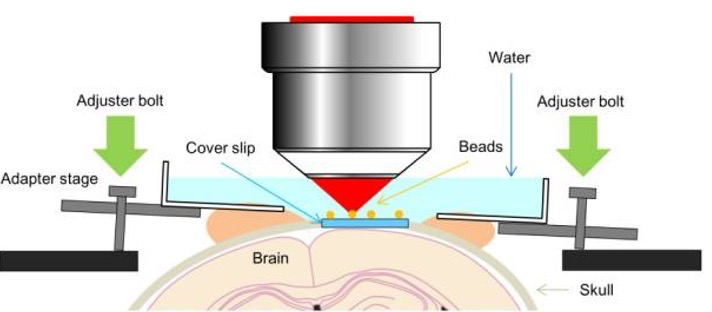
Mini Scope
- Attach the scope to the head of the animal
- Fibre optic cables
- Allow the ability to visualize with two fluoroscope (two photon microscopy)
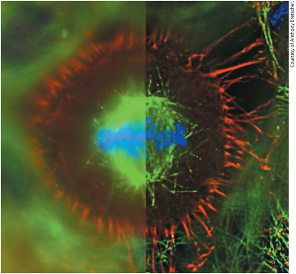
Fluorescence resonance energy transfer (FRET) to measure protein interactions in live cell:
Mechanism of FRET:
- If no protein interaction occurs then excitation of cyan fluorescent protein (CFP) will only result in cyan fluorescence (480 nm)
- If protein interaction occurs then excitation of CFP will result in yellow fluorescence (535 nm)
- In picture, protein interaction detected at front of migrating cell \n
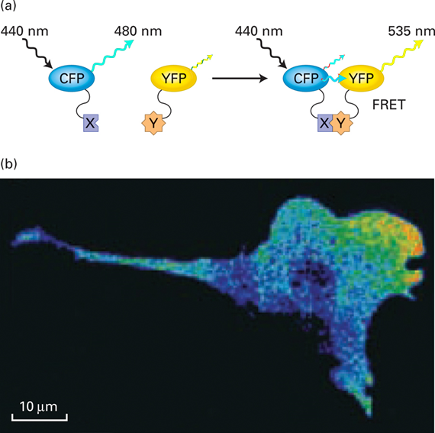
- When protein/enzyme X and Y interact with each other:
- CFP is brought close enough for the emission of CFP to excite YFP
- Filters for the fluorescent microscope:
- Excitation filter for CFP
- Emission filter for YFP
Excitation wavelength is always shorter than emission wavelength
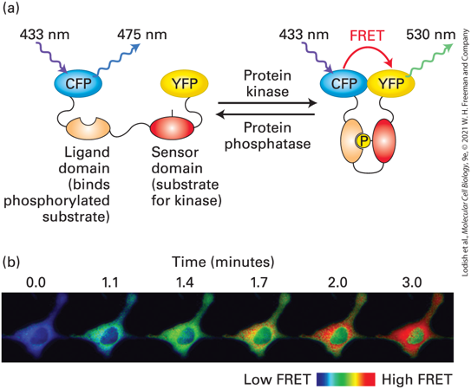
FRET Biosensors:
- Used in live cells and real time to monitor and observe protein, kinase activities
- CYP and YFP physically linked by large protein domains (i.e. Sensor and Ligand domains) that prevent close interaction between fluorescent proteins
- Phosphorylation of sensor domain allows ligand binding domain to interact and bring CFP and YFP close together to permit a FRET signal
- A link group of protein
- Adding P makes ligand domain recognizable by the sensor domain
Laser Microscopy:
Laser Scanning Confocal Microscope:
Properties of Laser Scanning Confocal Microscope:
- Exceptional clarity
- 3D reconstruction
Principle of Confocal Microscopy:
- designed in a way that only allows light from in-focus points to reach the detector
- fluorescent light is emitted after laser shines on the dyed specimen
- emission from in-focus focuses reaches the detector
- emission from out-of-focus focuses is largely excluded from detector
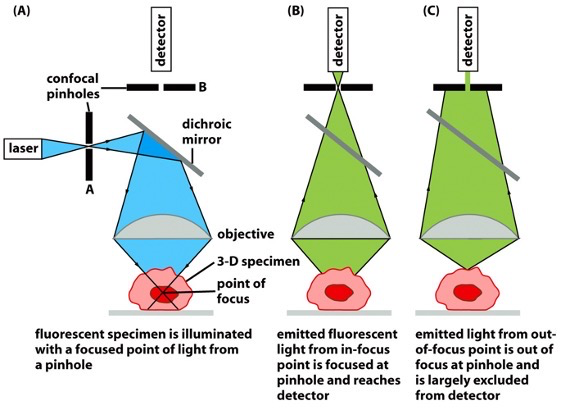
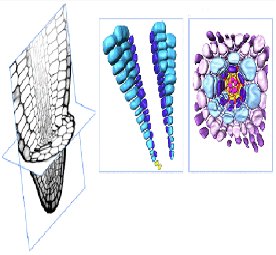
Image Acquisition:
- A mitotic fertilized egg from a sea urchin:
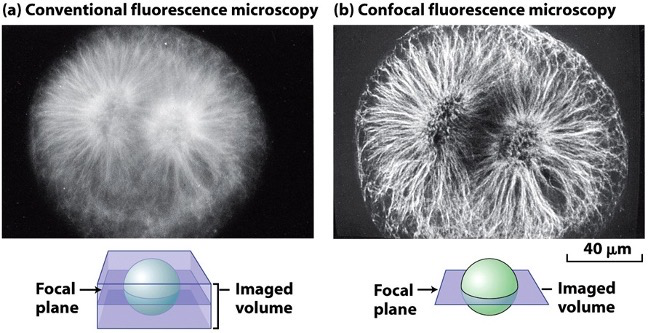
- The mitotic spindle composed of tubulin is blurred because fluorescence is detected from above and below the focal plane.
- Detecting fluorescence only from the focal plane produces a sharp image (thin optical section).
Deconvolution Microscopy:
- A computationally intensive math procedure to remove fluorescence contributed from out-of-focus parts of the stained sample
- considers so-called point spread function which determines the degree of blurriness by comparison to a reference set of tiny fluorescent beads
- Images are taken at different focal planes (called a ) by means of a precisely controlled robotic microscope stage
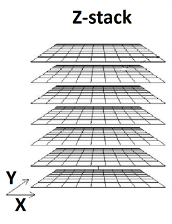
- Programmed to captured the bottom layer of the cell of the layer.
- Layer below might be in excited state and emit some light too
- With point spread computer algorithms.
- %%Quick scan, do not cause photon toxicity as the time is shorter%%
Electron Microscopy:
Electron Microscopy vs Fluorescence Microscopy:
- EM provides better resolution than FM.
- EM, however, needs ==fixed and sectioned samples== or @@metal-coated samples@@,
- living cells cannot be imaged.
Electron Microscopy Essentials:
- wire filament is an electron source & when it’s heated, electrons accelerate towards anode
- Beam of electron
- a magnetic (not glass) condenser focuses electrons on specimen
- Directs the beam of electron
- specimen is stained with electron-dense heavy metals (lead, uranium, osmium tetroxide)
Types of Electron Microscopy:
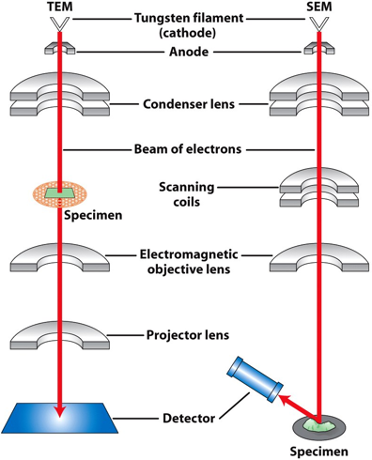
Transmission Electron Microscope
- thin layers, section of cells, for details
- samples are stained
- Whenever the beam hits parts of heavy metal, heavy metal stain, interfere with the transmission of electron
- Some will bounce away once it hits heavy metal and shows black on the image as lack of electron
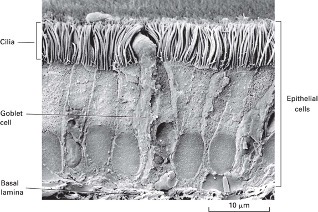
Scanning Electron Microscope
- Uniformly cover everything in metal
- Structure is preserved
- Imaging based on the degree of electron reflection,
- Electron beam reflected by specimen to the detector
- computer generates the image
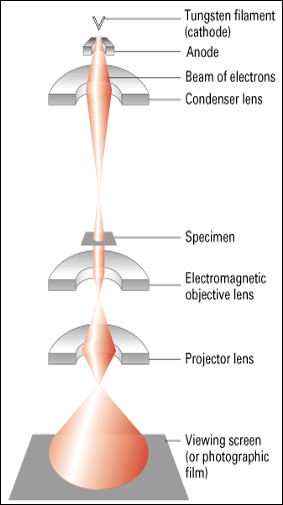
Transimission Electron Microscopy:
Resolution of TEM:
- very fine “D”

- there is no n, because nothing will interfere with the electron beam
- no “N” as light is replaced by electrons in a vacuum
- sin α is now α since electron scatter is almost 0
- Theoretical resolution is 0.005 nm; the effective resolution is (2000X greater than light microscopy).
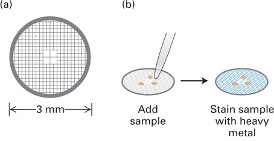
Sample preparation for TEM:
- Fixing the cell (chemically)
- into plastic-embedded specimen and on copper grid
- with aldehyde then dehydrated
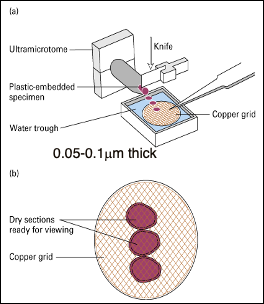
- Stain it with heavy metal
- and treat with stains
- \
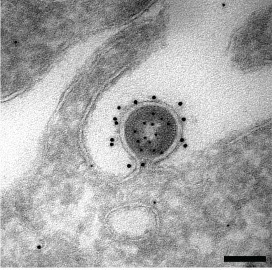
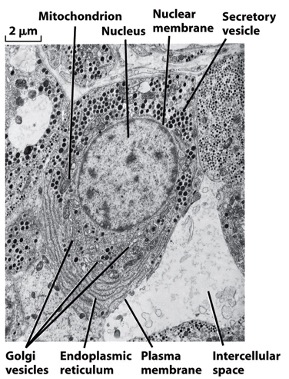
Imaging with TEM:
- electrons hit specimen but deflect due to metals deposited on organelles,
- unobstructed electrons are focused by lenses onto a phosphorescent screen,
- crystals in the screen, excited by the electrons, give off energy as visible light,
- B&W image is made up of shadows where electrons failed to penetrate.
\n