Maths Skills: Stats Tests
__Chi-Squared
- __%%Compare pattern in data with expected by chance pattern
- %%Usually used to %%check results of genetic crosses
- %%Best laid out as a table

| Observed (O) | Expected (E) | (O-E) | (O-E)^2 | (O-E)^2 / E | |
|---|---|---|---|---|---|
| Tall pea plants | 69 | 72.75 | -3.75 | 14.06 | 0.19 |
| Dwarf pea plants | 28 | 24.25 | 3.75 | 14.06 | 0.58 |
Therefore answer is 0.77 (0.19 + 0.58)
- If the chi-%%squared value represents a larger probability than the critical probability%% then it can be stated that the differences between the expected and observed results are %%due to chance
- %%If it represents a %%smaller probability than the critical probability%% then the differences in %%results are significant%% and %%something else may be causing the differences
- %%To determine the critical probability biologists generally use a %%probability of 0.05%% (they allow that chance will cause five out of every 100 experiments to be different)
- The number of comparisons made must also be taken into account when determining the critical probability. This is known as the degrees of freedom
__Student T-Test
- __The Student’s t-test is a statistical test that %%compares the mean and standard deviation of two samples to see if there is a significant difference between them
- %%Null Hypothesis**:** "There is %%not a significant difference%% between the two groups; any observed differences may be %%due to chance and sampling error%%."
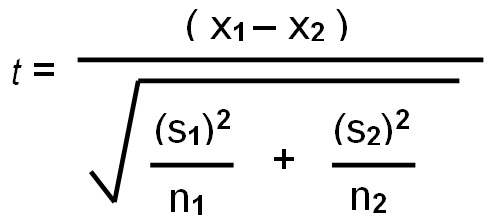
- x1 is the mean of sample 1
- s1 is the standard deviation of sample 1
- n1 is the sample size of sample 1
- x2 is the mean of sample 2
- s2 is the standard deviation of sample 2
- n2 is the sample size in sample 2
| Site 1 | Site 2 | |
|---|---|---|
| n | 28 | 28 |
| Mean limpet diameter (mm) | 35.64 | 37.36 |
| Variance (s^2) (square of standard deviation) | 77.17 | 74.4 |
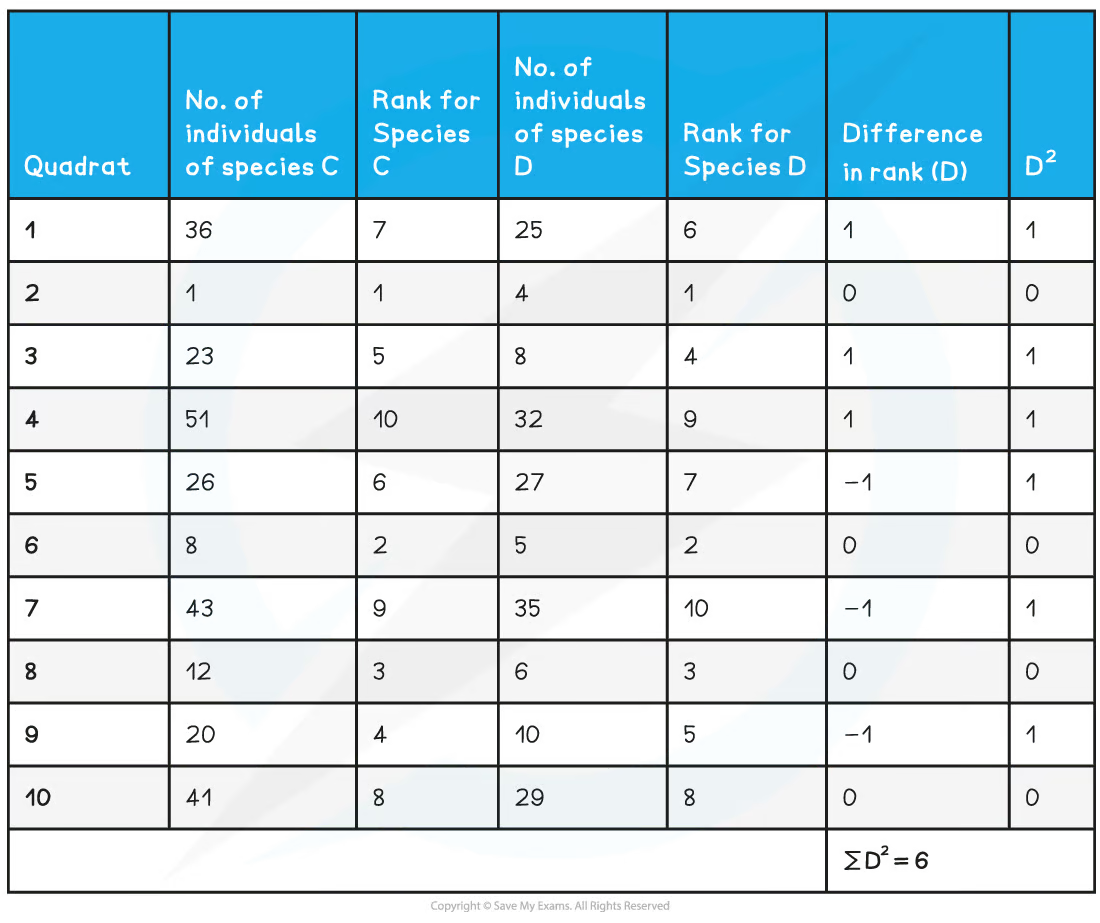
__Spearman’s Rank
- __Spearman’s rank correlation determines %%whether there is correlation between variables that don’t show a normal distribution
- %%Step 1: Create a scatter graph and identify possible linear correlation
- Step 2: State a null hypothesis
- Step 3: Use the following equation to work out Spearman’s rank correlation coefficient r

- rs = spearman’s rank coefficient
- D = difference in rank
- n = number of samples
- If the value calculated for Spearman’s rank is %%greater than the critical value%% for the number of samples in the data ( n ) at the 0.05 probability level (p), then the %%null hypothesis can be rejected, meaning there is a correlation between two variables
- %%%%Correlation does not always mean causation%%. Just because there is a correlation between the abundance of species A and species B it does not mean that the presence of species A causes the presence of species B.