AP Econ Unit 5 (Microeconomics)
AP Econ – Unit 5
Topic 5.1 - Introduction to factor markets
A firm’s marginal product revenue curve
 Demand comes from firms and supply comes from people
- Labor markets differ from typical product markets; here, the demand for labor comes from firms, not individual consumers.
- The tutorial uses a competitive car wash as an example to explain the dynamics of a firm that's a price taker, with an equilibrium price of $5 per car wash.
- It introduces the concept of marginal product of labor, showcasing how the number of employees affects the total productivity of the firm. This is illustrated by the number of cars washed per hour concerning the quantity of labor (workers).
- The marginal product of labor is presented in terms of its relation to the quantity of labor, demonstrating how the additional worker affects the number of cars washed.
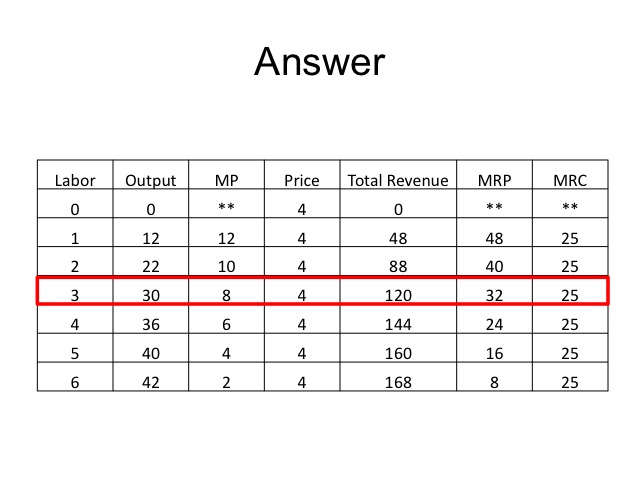
- The concept of marginal product revenue (MPR) is introduced, showing how the value of each additional worker translates into revenue for the firm. The MPR is calculated based on the constant marginal revenue of $5 per car wash and the number of additional cars washed with each extra worker.
- The MPR curve is depicted, showcasing the incremental revenue generated by each added worker and essentially forming the demand curve for the firm as it hires more labor.
- MPL and MRP are linear downward-sloping curves when plotted on a graph of quantity
- MRP = Demand curve
How many people to hire given MPR curve
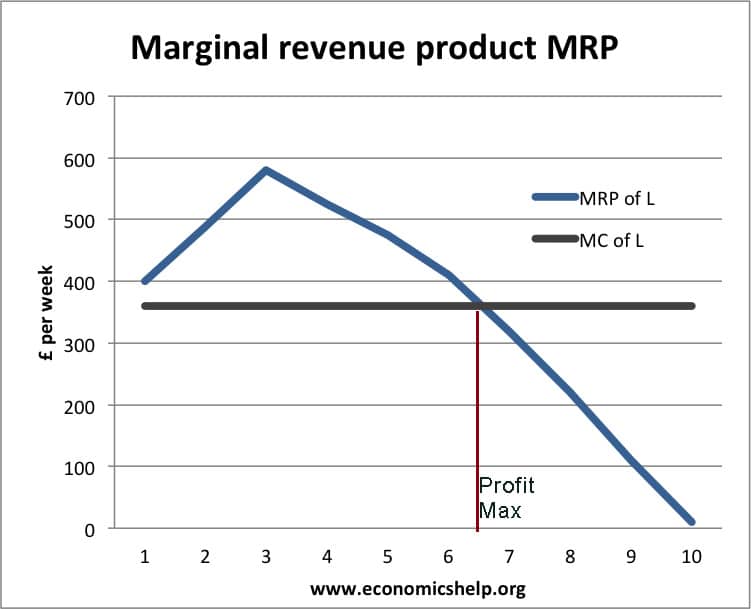 Marginal Product Revenue Curve: Explores the curve's significance as the marginal benefit curve for a firm, using a car wash as an example. ($/person per hour)
 - Interpretation: Relates the horizontal axis to the quantity of labor per hour and the vertical axis to the marginal product revenue (the incremental revenue per person per hour).
- Calculations: Demonstrates how to compute the incremental revenue gained by hiring additional individuals, breaking it down from 0 to 1 person, 1 to 2, 2 to 3, and so on.
- Comparing Benefit and Cost: Compares the marginal revenue with the marginal cost to determine the rational number of employees to hire, considering market wages and cost per employee.
- Competitive Firm in Labor Market: Discusses the assumption of being a competitive buyer in the labor market, necessitating consideration of market wages for hiring.
- Optimal Employee Quantity: Emphasizes that the rational hiring strategy involves continuing to add employees until the point where the marginal benefit equals the marginal cost, after which hiring more becomes cost-efficient.
Introduction to labor markets
 Labor markets, as a factor of production, are crucial and are the focus of this discussion.
- The lecture breaks down the perspective of firms in hiring, emphasizing concepts like marginal revenue product to assess the value of hiring additional workers.
- It explores the market labor demand and supply curves to determine the equilibrium wage and quantity of labor in the market.
- In a perfectly competitive labor market, firms can't set wages and hire workers based on the equilibrium wage, aiming to balance incremental revenue and labor costs.
- MFC = Wage that a company must pay their workers
- Marginal revenue product of labor (MRPL) = Marginal revenue (MR) x Marginal product of labor (MPL)
- MRPL = P x MPL
Topic 5.2 – Changes in factor demand and supply
Adding demand curves
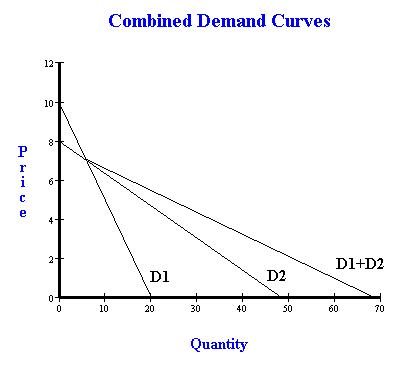 Understanding the addition of demand curves in economics is the central focus.
- The text demonstrates the construction of demand curves for two firms, illustrating their demand for labor.
- It explains the process of horizontally adding these individual demand curves to create a combined market demand curve.
- Emphasizes the non-intuitive nature due to economic axis definitions, where price is on the vertical axis.
- The combined market demand curve is obtained by adding the quantities each firm demands at various price levels.
- It elucidates that combining demand curves involves adding the demands of different firms at each price point to derive the overall market demand curve.
Changes in labor supply
 Changes in immigration policy, leading to increased immigration, raising the labor supply, lowering the equilibrium wage, and increasing labor quantity in the market.
- Factors like societal acceptance, such as women joining the workforce, can also boost labor supply, shifting the market curve to the right.
- Conversely, net migration out of a country or changes in preferences, societal norms, or better-paying industries can decrease labor supply, raising market wages and decreasing labor quantity.
- In a perfectly competitive labor market, firms adjust production based on market wages; a decrease in wages prompts increased hiring, while higher wages result in reduced labor hiring for a firm.
- REFER TO NOTES FOR SPECIFIC SHIFTERS IN LABOR SUPPLY AND LABOR DEMAND
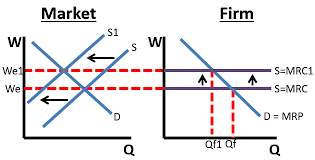
Shifts in the demand for labor
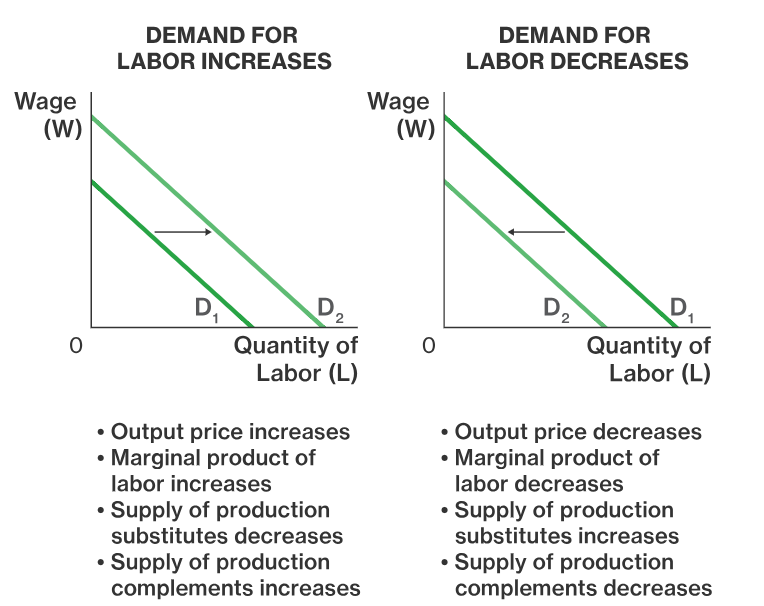 Market Shifts: Explains how a sudden rise in demand for bell bottoms leads to increased marginal revenue for pant-making firms, resulting in a shift to the right in the marginal revenue product curve.
- Impact on Labor Demand: Describes how the increased demand for bell bottoms leads to an increased demand for labor in the pant-producing industry, consequently shifting the market labor demand curve to the right.
- Equilibrium Changes: Notes that the equilibrium wage and quantity in the labor market rise due to the rightward shift in the demand curve, with a corresponding increase in marginal factor cost.
Key Points
- Increases in marginal revenue for products lead to a higher demand for labor, shifting the market labor demand curve rightwards.
- Decreases in marginal revenue cause a decrease in labor demand, shifting the demand curve to the left and negatively affecting wages and labor quantities.
Topic 5.3 - Profit-maximizing behavior in perfectly competitive factor markets
Cost-minimizing choice of inputs
- Firms make decisions about how much labor and capital to hire based on the marginal revenue product and marginal factor cost.
- The marginal revenue product curve for labor is downward sloping, indicating diminishing returns.
- The marginal factor cost of labor is determined by the wage rate in a competitive labor market.
- Firms continue to hire labor if the marginal revenue product of labor is higher than the marginal factor cost of labor.
- A similar analysis can be done for capital, with the marginal revenue product of capital and the marginal factor cost of capital.
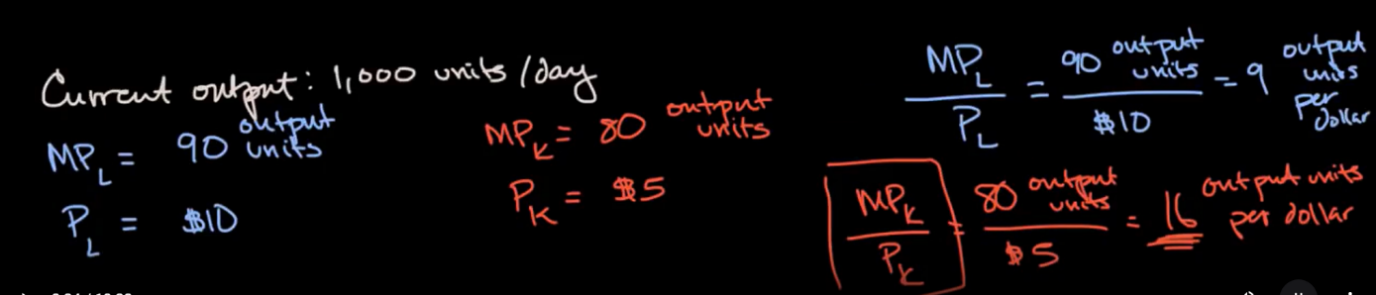
- Firms consider the relative value of labor and capital in terms of output per dollar when making investment decisions.
- The firm will invest in the factor with the best bang for the buck, where the marginal product divided by the price is the highest.
- A firm may be indifferent between labor and capital when the marginal product divided by the price is equal for both factors.
- The efficient combination of inputs occurs when the marginal product divided by the price is equal for all factors.
Factor markets worked example
- The text explains how to draw side-by-side graphs for the labor market and the firm Epic Eats.
- It discusses the market labor demand curve and the market labor supply curve.
- The equilibrium wage and the quantity of workers hired in the market are labeled and explained.
- The text introduces the marginal factor cost curve and the marginal revenue product curve.
- It explains the wage paid by the firm and the quantity of workers hired by the firm.
- The text discusses the short-run effects of an increase in the price of Epic Eats' stuffed sandwiches on the wage paid by the firm and the number of workers hired.
- It explains how to determine the wage rate when given the marginal product of capital, the marginal product of labor, and the rental rate of capital.
- Value of a firm’s marginal product of labor (VMPL) = the value generated by each additional unit of labor employed. This is because a profit-maximizing firm looks particularly at the money it can make by selling its products.
- The marginal revenue product of labor equals the wage rate
Topic 5.4 – Monopsonistic markets
A monopsonistic market for labor
 Labor Market Dynamics: Explores the quantity of labor employed by a firm against the wage rate in an economic context.
- Marginal Revenue Product: Describes the incremental revenue gained by employing an additional unit of labor and its tendency to decrease due to diminishing returns.
- Monopsony vs. Perfect Competition: Compares a monopsony, a market with one buyer and many sellers, specifically in the context of labor markets, with a perfectly competitive market.
- Supply and Demand in Labor: Illustrates the relationship between wage rates and the supply of labor in a monopsonistic scenario, where lower wages attract fewer workers and higher wages draw more labor.
- Marginal Factor Cost of Labor: Discusses how the cost of each additional unit of labor differs in a monopsonistic scenario, rising at a faster rate than the labor supply curve due to the necessity of paying the same wage to all employees.
- Rational Employment Quantity: Considers the rational quantity of labor for a firm, determined by the intersection of the marginal revenue product of labor and the marginal factor cost of labor.
- Wage Determination: Emphasizes that the wage a firm pays for a specific quantity of labor isn't solely based on the firm's preference but is also influenced by the labor supply curve in the market.
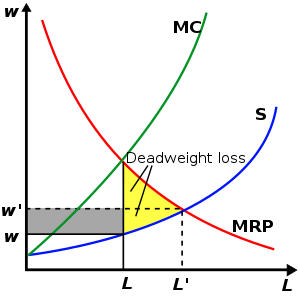
Monopsony employers and minimum wages
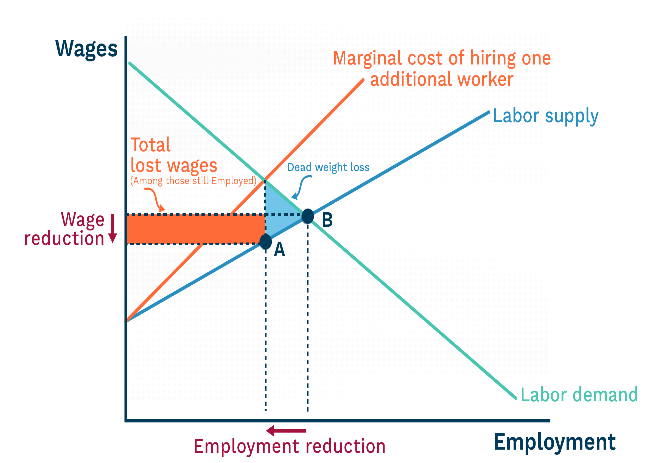 Marginal Revenue Product Curve: Describes the incremental revenue from hiring additional labor, showing diminishing returns as more labor is added.
- Marginal Factor Cost Curve: Differs for a monopsony employer due to the need to raise wages for all workers if one's wage increases.
- Employment Rationality: Despite expectations, a higher minimum wage, within a certain range, can lead the monopsony employer to hire more labor as the cost dynamics change.
- The shift caused by a minimum wage challenges the traditional understanding of reduced hiring, illustrating that within a specific range, higher minimum wages for monopsony employers can result in increased employment. However, the extent of this effect and potential adverse outcomes needs to be carefully considered, as excessive minimum wages might reduce employment, and the surplus the employer previously had would now be more distributed to the workers.
Additional Notes
- Supply curve for labor = The number of workers who are willing and able to work at various wage rates
- Demand curve for labor = The number of workers a firm is willing and able to hire at various wage rates
- Improving education leads to a higher wage
- MP x MR = MRC
- Assume that both the product and labor markets are perfectly competitive. It would be profitable for a firm to hire additional labor if the ratio of the wage to the marginal product of labor is less than the output price
- Continue to hire until MPL x P = wage
- Change in marginal product = Change in output
- Change in marginal revenue product = Change in output x price