MAT 3: SAMPLING DISTRIBUTION
Sampling Distribution
The Sampling distribution of sample means is a frequency distribution using the means computed from all possible random samples of a specific size taken from a population. The means of the samples are less than or greater than the mean of the population.
SAMPLING ERROR
- The difference between the sample mean and the population
Steps in Constructing the Sampling Distribution of the Means
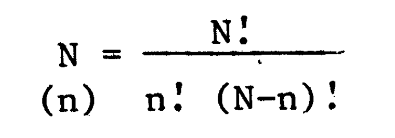
- Determine the number of sets of all possible random samples that can be drawn from the given population by using the formula, NCn, where N is the population size and n is the sample size.
- List all the possible samples and compute the mean of each sample.
- Construct the sampling distribution.
- Construct a histogram of the sampling distribution of the means.
]]Example. A population consists of the numbers 2, 4, 9, 10, and 5. Let us list all possible sample sizes of 3 from this population and compute the mean of each sample.]]
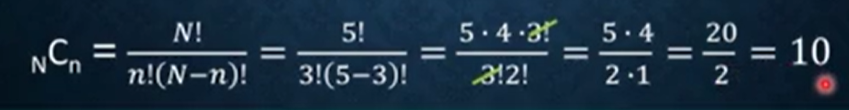
- Determine the number of sets of all possible random samples that can be drawn from the given population by using the formula, NCn, where N is the population size and n is the sample size.
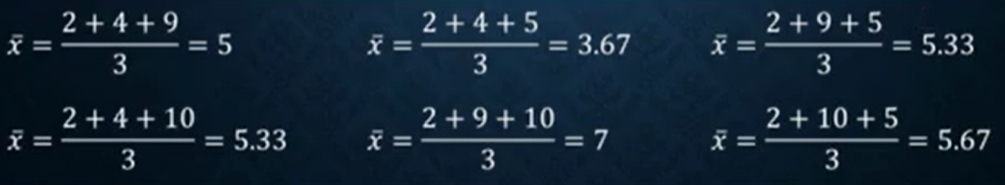
- List all the possible samples and compute the mean of each sample.
NCn = 10
2, 4, 9, 10 , 5
| sample | 2, 4, 9 | 2, 4, 10 | 2, 4, 5 | 2, 9, 10 | 2, 9, 5 | 2, 10, 5 | 4, 9, 10 | 4, 9, 5 | 4, 10, 5 | 9, 10, 5 |
|---|---|---|---|---|---|---|---|---|---|---|
| Mean | 5 | 5.33 | 3.67 | 7 | 5.33 | 5.67 | 7.67 | 6 | 6.33 | 8 |
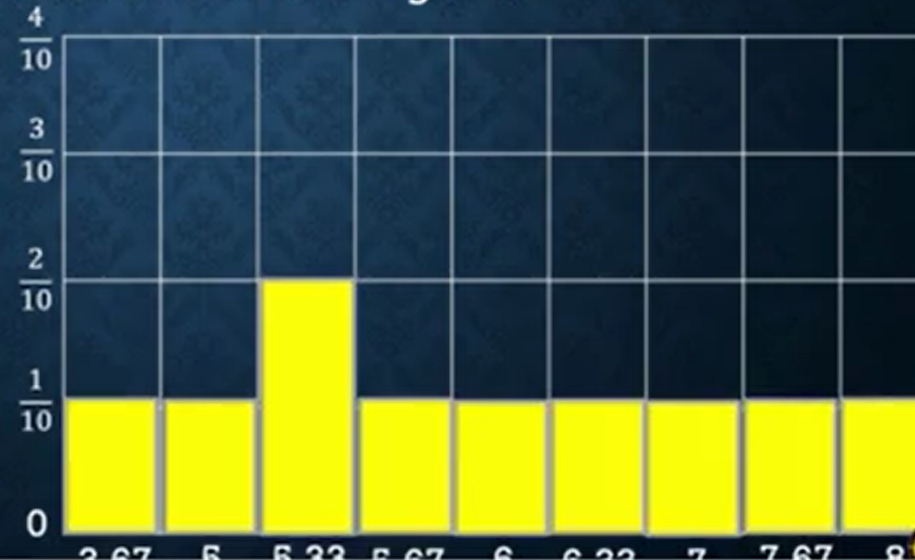
- Construct the sampling distribution. (sample mean should be lowest to highest)
| Sample Mean (x) | Frequency | Probability |
|---|---|---|
| 3.67 | 1 | 1/10 = .10 |
| 5 | 1 | 1/10 = .10 |
| 5.33 | 2 | 2/10 = .20 |
| 5.67 | 1 | 1/10 = .10 |
| 6 | 1 | 1/10 = .10 |
| 6.33 | 1 | 1/10 = .10 |
| 7 | 1 | 1/10 = .10 |
| 7.67 | 1 | 1/10 = .10 |
| 8 | 1 | 1/10 = .10 |
| total | 10 | 1.00 |
- Construct a Histogram
]]Example 2. Adrian Cedrick receives 82 or 83 as his grade on his three major subjects. Construct the sampling distribution of his mean grade.]]
- List all the possible samples.
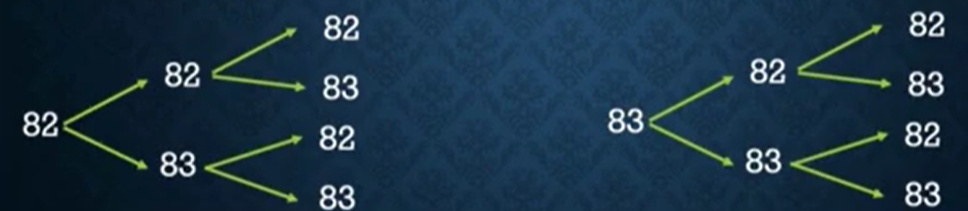
| A | B | C | A | B | C | |
|---|---|---|---|---|---|---|
| 82 | 82 | 82 | 83 | 82 | 82 | |
| 82 | 82 | 83 | 83 | 82 | 83 | |
| 82 | 83 | 82 | 83 | 83 | 82 | |
| 82 | 83 | 83 | 83 | 83 | 83 |
- Compute the mean of each samples.
| A | B | C | x (divide by 3(subjects) |
|---|---|---|---|
| 82 | 82 | 82 | 82 |
| 82 | 82 | 83 | 82.33 |
| 82 | 83 | 82 | 82.33 |
| 82 | 83 | 83 | 82.67 |
| 83 | 82 | 82 | 82.33 |
| 83 | 82 | 83 | 82.67 |
| 83 | 83 | 82 | 82.67 |
| 83 | 83 | 83 | 83 |
- Construct the sampling distribution. (sample mean should be lowest to highest)
| Sample Mean | Frequency | P (x) |
|---|---|---|
| 82 | 1 | 1/8 = .125 |
| 82.33 | 3 | 3/8 = .375 |
| 82.67 | 3 | 3/8 = .375 |
| 83 | 1 | 1/8 = .125 |
| TOTAL | 8 | 1.00 |
- What is the probability that his mean grade is lower than 83?
P(x < 83) = .125 + .375 + .375
P (x < 83) = .875 / 87.6%
- What is the probability mean that his grade is higher than 82.33?
P(x>82.33) = 3.75 + .125
P (x>82.33) = .5 . 50%