Biodiversity
Habit diversity
how many different habitats are present in an area
Species diversity
species richness ( number of different species) and species evenness ( how balanced out the abundance of each species is)
genetic diversity
variety of genotypes within species or between species
biodiversity hotspot:
area under threat from development that has high concentrations of biodiversity and endemism
what is endemism:
the degree to which the plants and animals of a particular area are both native and restricted to it
why do we measure biodiversity
helps us to understand the impact of human activity:
generally e.g. the impact of climate change
specific situations e.g. building new roads
helps us to understand which species are under threat of extinction
help with conservation work
useful resources for humans e.g. potential sources of medicines
e.g.
Sickle cell anaemia is a trait found most commonly in countries affected strongly by malaria, such as sub Saharan Africa, but less so in other areas.
State which level of biodiversity this variation represents, explain your reasoning.
(2)
genetic diversity
as it describes variation between individuals of the same species
Explain the difference between species diversity and genetic diversity. (2)
species diversity considers the number of species and the number of individuals of each species within a specified area
genetic diversity looks at the range of genes within the individuals of the population of a species
Biodiversity exists at different scales.
Name and define three types of biodiversity, each at a different scale. ( 6)
genetic diversity: this is a measure of the variation within a population of the same species
species diversity: this is a measure of the number of species and the number of individuals within each population in a define area
ecosystem diversity: this is a measure of the number of different habitats in an ecosystem
what is a species:
a species is a group of organisms with similar morphology, physiology and behaviour, which can interbreed to produce fertile offspring, and which are reproductively isolated from other species
why can it be difficult to define a species:
species may breed but produce infertile offspring ( hybrids)
may be physiologically compatible but not mate due to:
different mating cells
living in different habitats ( e.g. water vs land)
mating seasons vary
species may be extinct so we cant test if they would successfully interbreed
species problem:
if two populations are geographically isolated, it can be difficult to tell if they are capable of interbreeding to produce fertile offspring.
e.g. are the Bengal tiger and the Siberian tiger two different species
species richness:
the simplest way to measure biodiversity is to count the number of species but it doesn’t take into account the population size of each species
species evenness:
a community in which all species have a similar abundance has a high evenness, where no single species dominates
a diverse habitat should have a high species richness and evenness
a community which has a large number of species, but which is dominated by one of them has a low evenness and is less diverse.
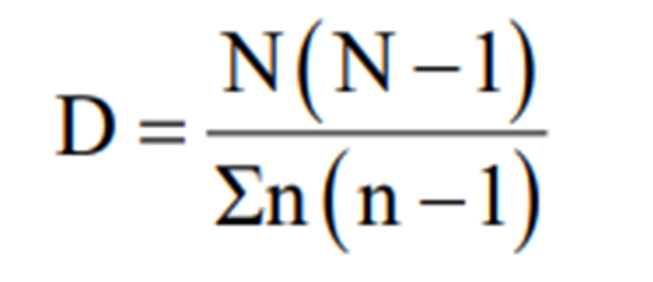
species Diversity Index
a diversity index can also be used as a mathematical way of taking into account species richness and evenness
D = N (N-1)/£n (n-1)
N = the total number of organisms of all species
n = the total number of organisms of each species
Species | Wood A |
Blue tit | 28 |
Robin | 15 |
Wren | 11 |
Blackbird | 6 |
TOTAL | 60 |
D = ___________60(60-1)__________
(28x27) + (15x14) + (11x10) + (6x5)
= 3540/1106
= 3.2
The higher the diversity index, the higher the biodiversity of the area
it’s most useful when you are making a comparison
Step 1: Write out equation
Step 2: Calculate the total number of organisms present (N)
Step 3: substitute the numbers of individuals in each species into the equation (n)
Step 4: Compare index and biodiversity
Species | Field A | Field B |
A | 16 | 13 |
B | 10 | 16 |
C | 17 | 9 |
D | 8 | 3 |
E | 2 | 14 |