Graphs (3.1 - 3.2)
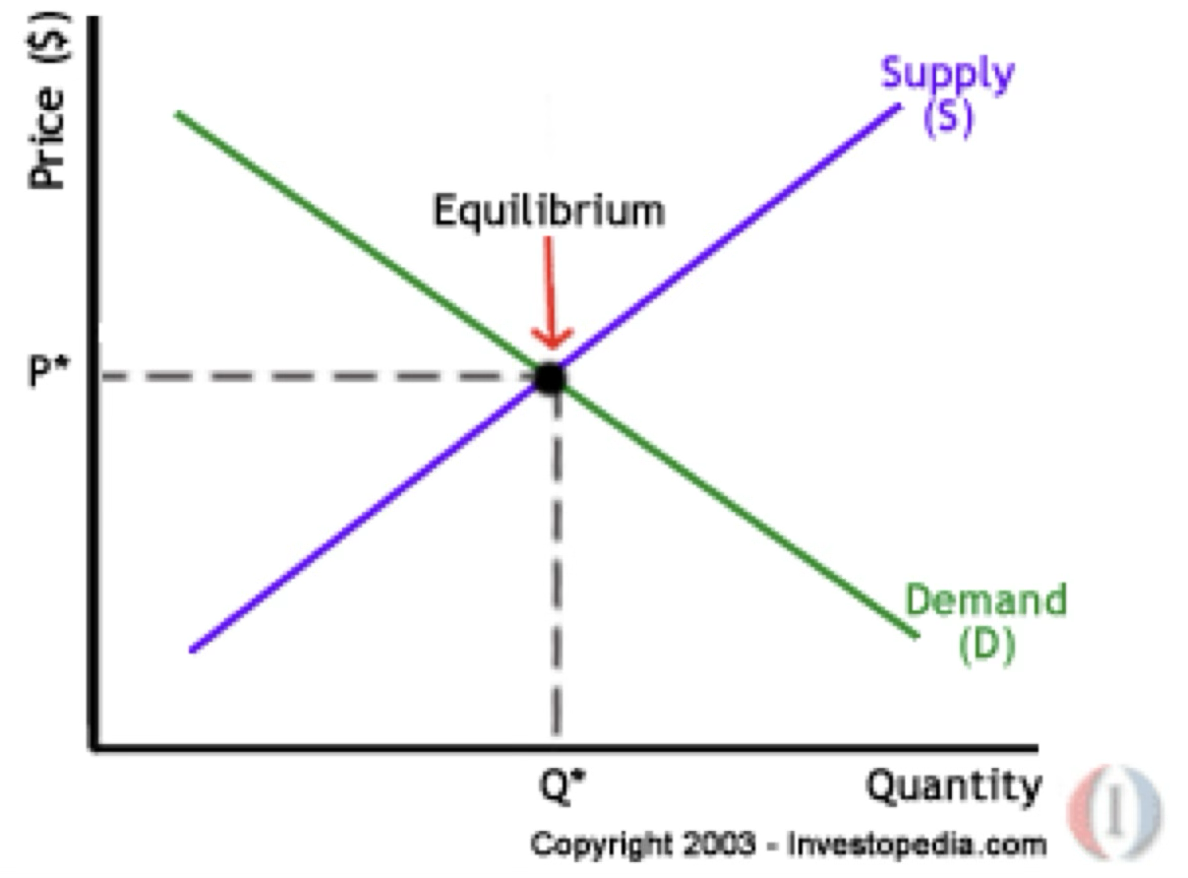
okay so.. this is an example of market equilibrium, where supply and demand are balanced.
example: sa presyong P*, ang konsyumer at prodyuser ay nagkasundo sa dami ng demand at suplay. ang konsyumer ay gustong bumili ng Q* na notbuk at ang suplayer ay handang magbenta ng Q* na notbuk. sa presyong P*, ang demand at suplay ay pantay o equal.
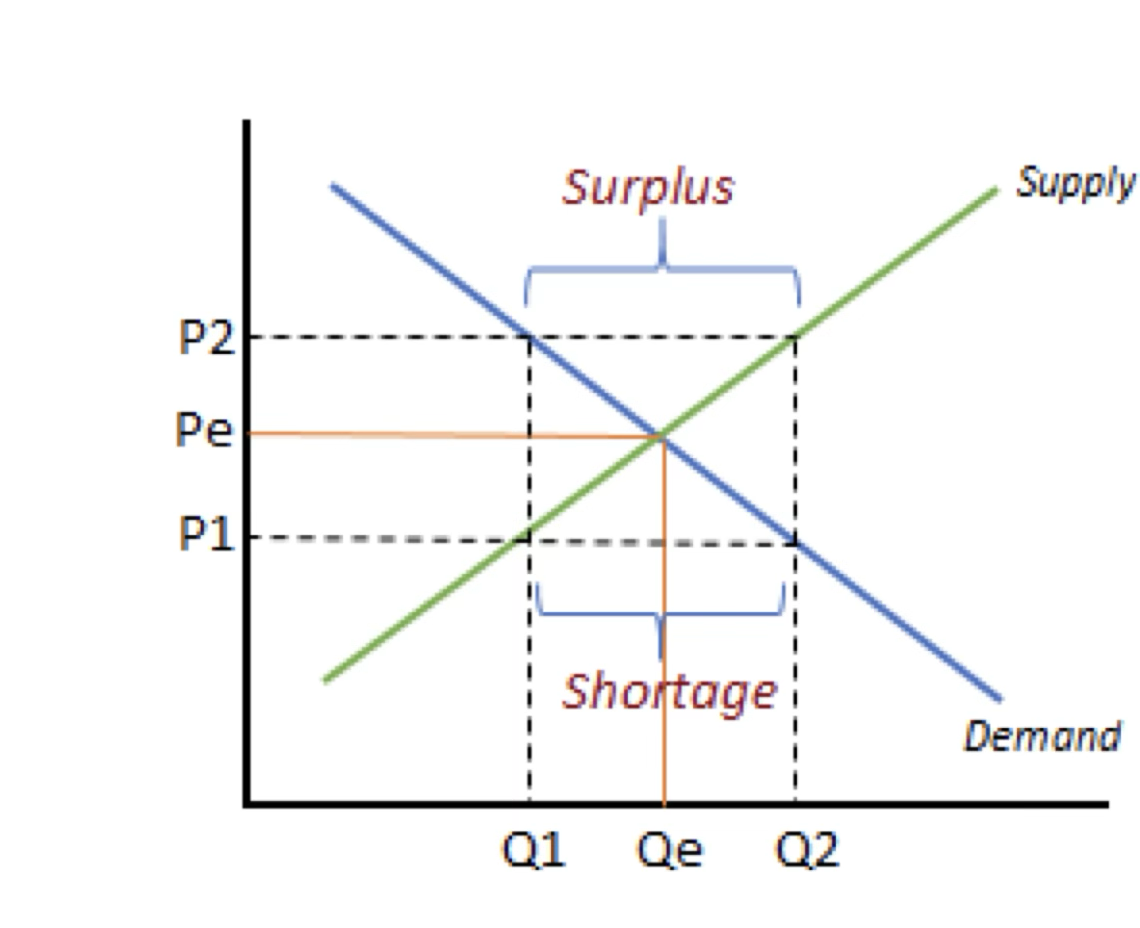
NEXT…. !!! this one demonstrates how a shortage or surplus happens when the market price departs from the equilibrium price (Pe)
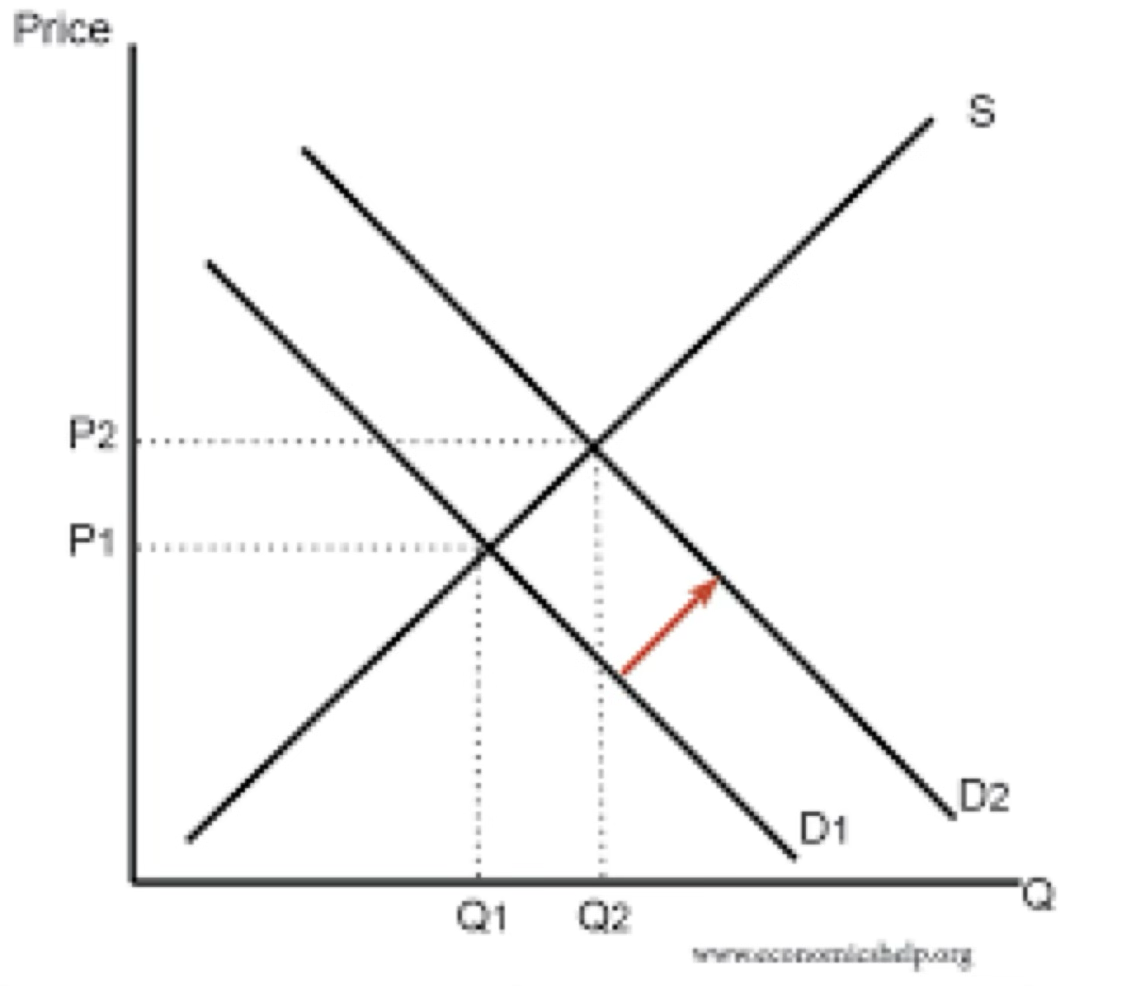
anyway, this one has a rightward shift meaning the price and quantity increases (opposite for the other graph that has a leftward shift)
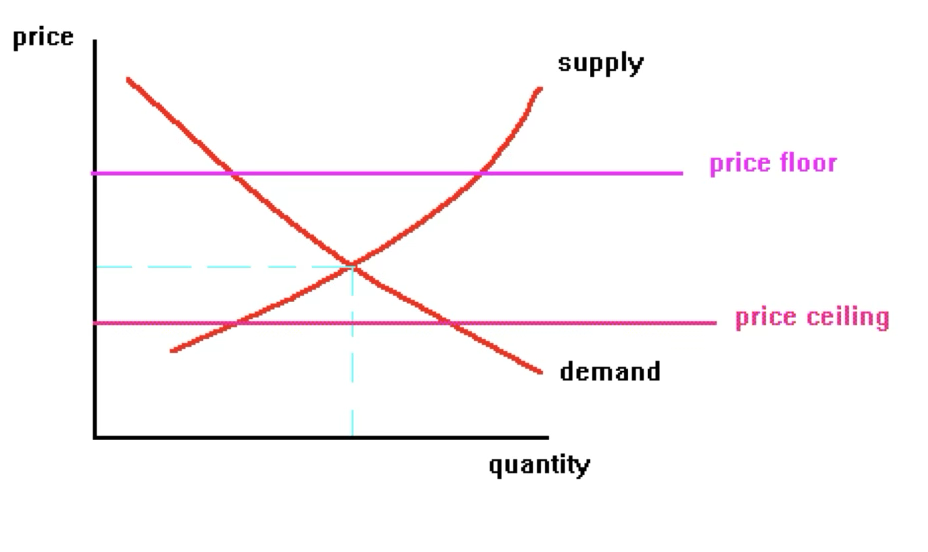
Price Ceiling → Below Equilibrium → Shortage → Excess Demand
Price Floor → Above ““ → Surplus → Excess Supply