Chapter 6 Notes — Page-by-Page (Energy and Metabolism)
Page 1
Chapter 6 – How Cells Utilize Energy
Chapter outline:
Energy and chemical reactions
Enzymes
Metabolic pathways
Cellular respiration overview
Glycolysis
Breakdown of pyruvate
Citric acid cycle
Oxidative phosphorylation
Connections among carbohydrate, protein, and fat metabolism
Anaerobic respiration and fermentation
Page 2
6.1 Energy and Chemical Reactions
Learning Outcomes
Define energy, and distinguish potential and kinetic energy.
State the first and second laws of thermodynamics, and discuss how they relate to living things.
Explain how the change in free energy determines the direction of a chemical reaction.
Distinguish between exergonic and endergonic reactions.
Describe how cells use the energy released by ATP hydrolysis to drive endergonic reactions.
Page 3
6.1 Energy and Chemical Reactions
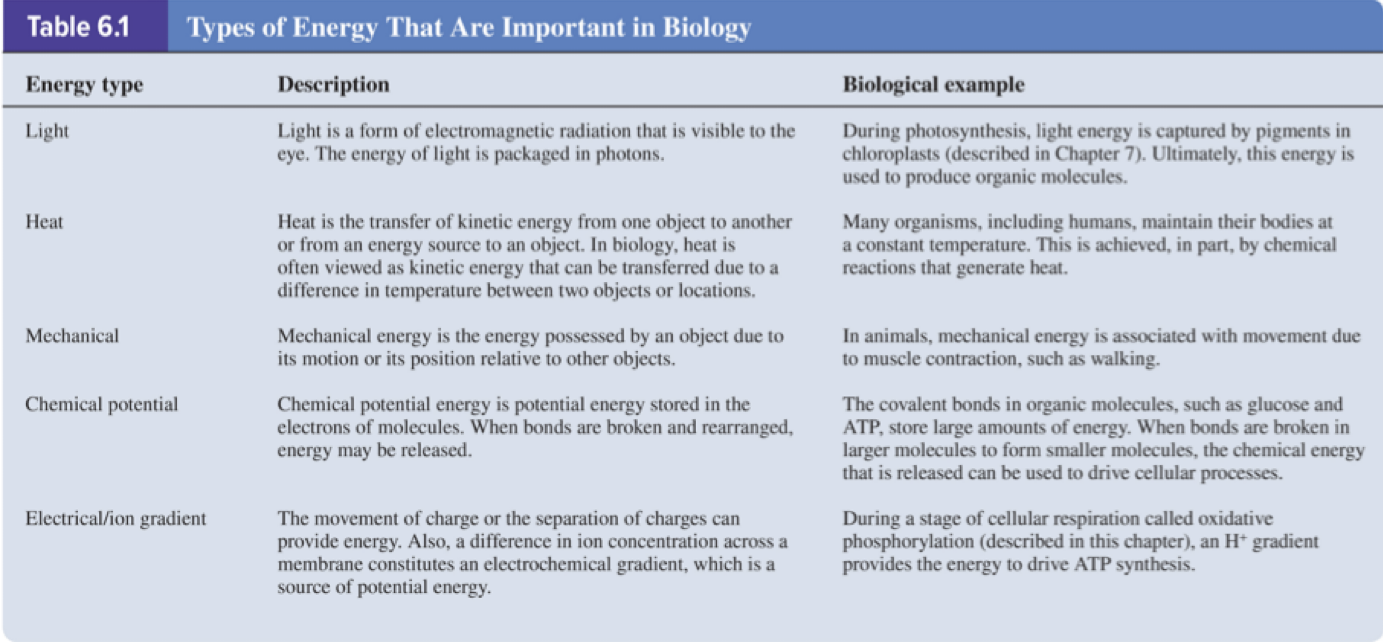
Energy is the ability to promote change or do work.
In biological systems, energy exists in various forms that enable cellular processes.
Page 4
6.1 Energy and Chemical Reactions – Energy Exists in Different Forms
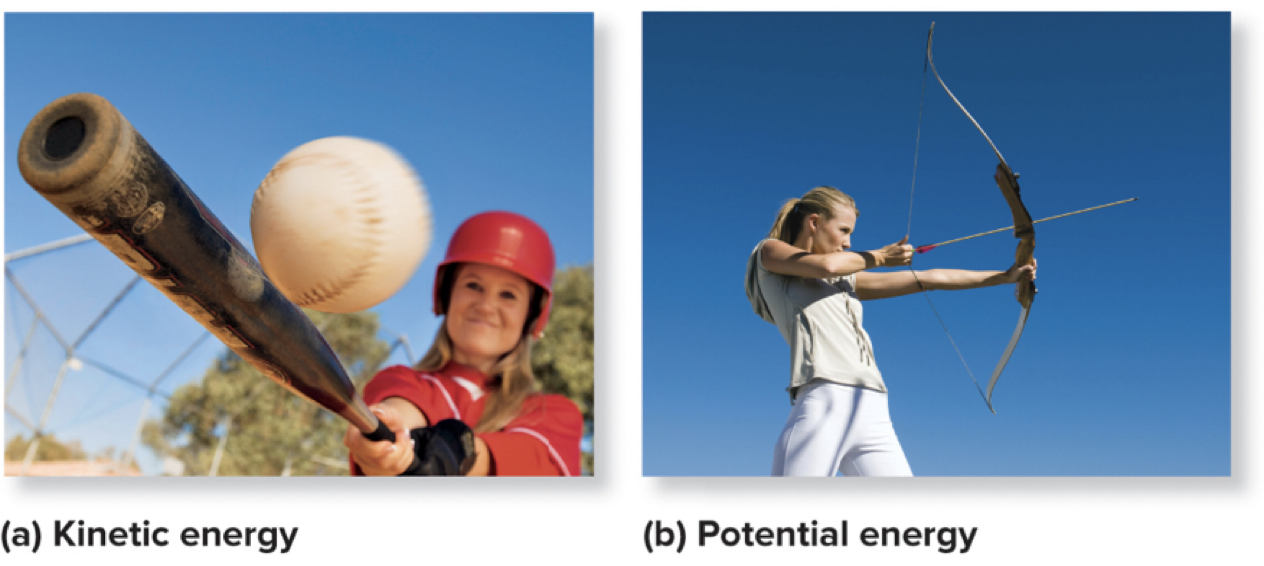
Two general forms of energy:
Kinetic energy: energy of motion.
Potential energy: energy due to structure or location.
Chemical potential energy: the energy stored in chemical bonds between atoms; this is a biologically important form of potential energy.
Page 5
6.1 Energy and Chemical Reactions – The Laws of Thermodynamics
First law of thermodynamics: energy cannot be created or destroyed, but it can be transformed from one form to another.
Second law of thermodynamics: when energy is transformed, entropy (degree of disorder) tends to increase.
As entropy increases, less energy is available for organisms to use to promote change.
Page 6
6.1 The Change in Free Energy Determines the Direction of a Chemical Reaction
Distinction between usable energy (free energy that can do work) and unusable energy.
Total energy = usable energy + unusable energy.
Entropy is a major component of unusable energy.
The free energy, symbolized as G, is the usable energy available to do work.
The direction of a reaction is determined by the change in free energy, ΔG.
A spontaneous reaction is one that proceeds in a particular direction without input of external energy.
Spontaneous reactions can be very slow unless coupled to other processes.
Page 7
6.1 Free Energy Change and Reaction Spontaneity
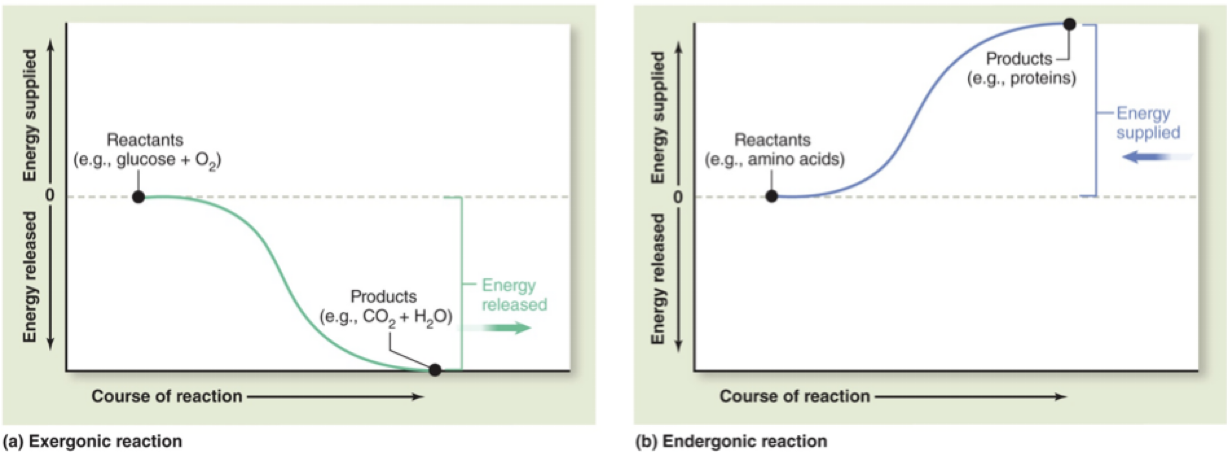
In an exergonic reaction, products have less free energy than reactants; free energy is released.
ΔG < 0; the reaction is spontaneous.
In an endergonic reaction, products have more free energy than reactants; energy must be added.
ΔG > 0; the reaction is not spontaneous.
Reference: McKinley et al., 2016; McGraw Hill.
Page 8
6.1 ATP and Endergonic Reactions
Many cellular reactions are endergonic and require input of energy.
Endergonic reactions can be coupled to exergonic reactions to become spontaneous when the overall ΔG for the coupled processes is negative.
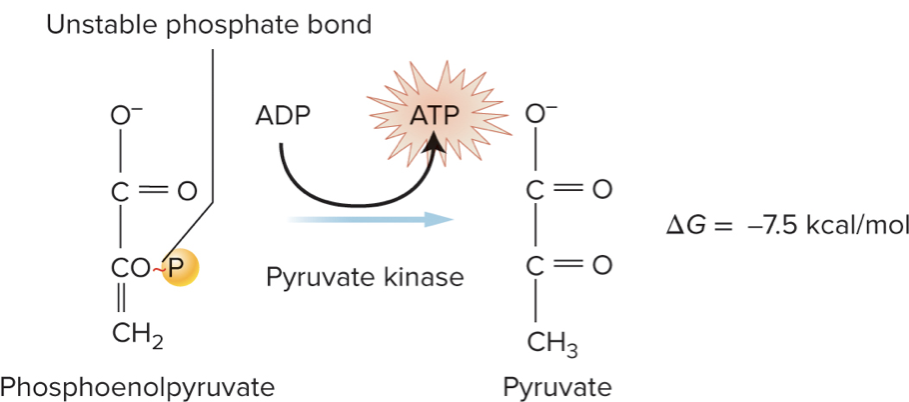
ATP hydrolysis is an exergonic reaction that is often coupled to other endergonic reactions in the cell.
Energy released from ATP hydrolysis is used to drive other endergonic reactions.
Common coupling example:
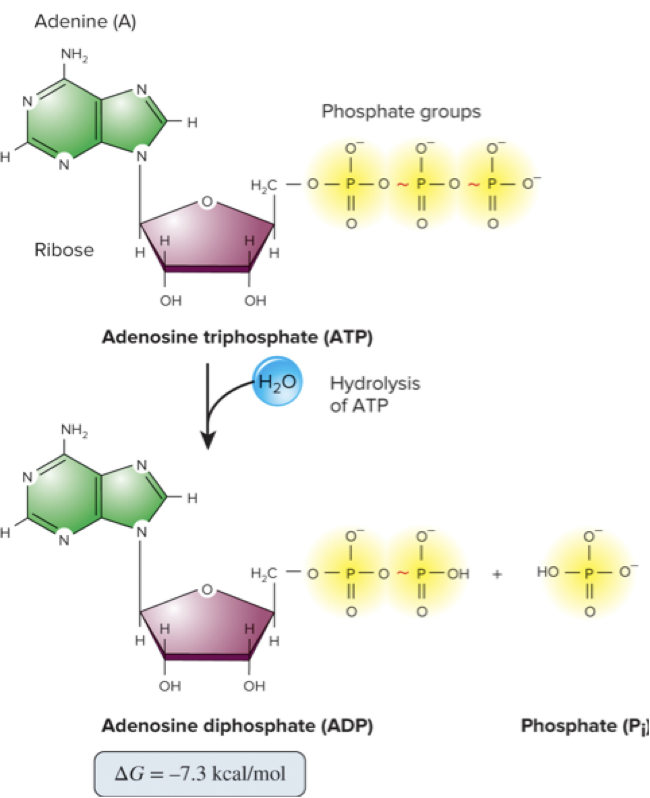
ATP hydrolysis
The released energy drives endergonic processes elsewhere in metabolism.
Page 9
6.2 Enzymes – Learning Outcomes
Explain how enzymes increase the rates of chemical reactions by lowering the activation energy.
Describe how enzymes bind their substrates with high specificity and undergo induced fit.
Explain how Vmax and KM are used to quantify enzyme activity.
Contrast the effects of competitive and noncompetitive inhibitors.
Explain how factors such as non-protein molecules or ions, temperature, and pH influence enzyme activity.
Page 10
6.2 Enzymes – Enzymes Increase the Rates of Chemical Reactions
A spontaneous reaction is not necessarily fast.
A catalyst speeds up a reaction without being consumed.
Enzymes are protein catalysts in living cells that dramatically increase reaction rates.
In cells, enzyme-catalyzed reactions are typically millions of times faster than the uncatalyzed forms.
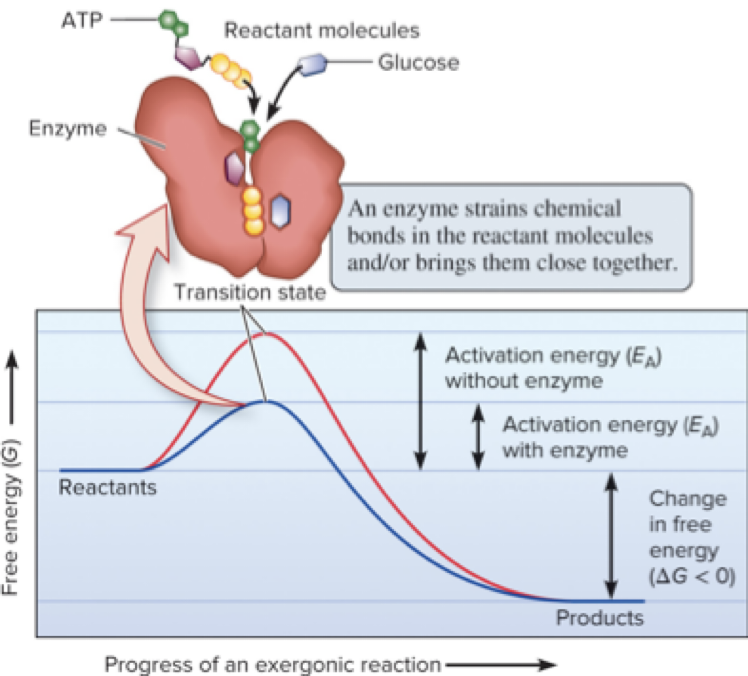
Activation energy (EA) is the initial energy input required to start a reaction; it enables molecules to reach the transition state where bonds can be rearranged.
Page 11
6.2 Enzymes – Lowering Activation Energy
The activation-energy barrier must be overcome to achieve the transition state.
Enzymes lower the activation energy barrier to allow the reaction to proceed more rapidly.
Common mechanisms for lowering EA include:
Straining substrates to distort bonds and promote bond rearrangement.
Positioning reactants close together to increase collision frequency and proper orientation.
Page 12
6.2 Enzymes – Substrate Specificity and Induced Fit
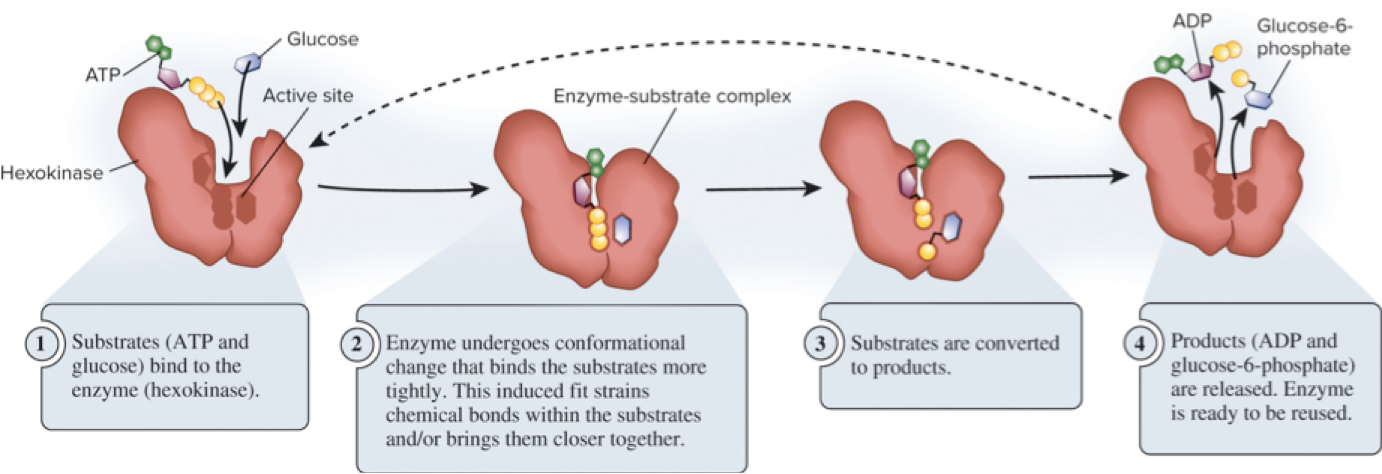
The active site is where the reaction takes place; substrates bind to the active site.
Enzymes show high substrate specificity.
When bound, the enzyme-substrate complex forms.
The enzyme often undergoes conformational changes upon substrate binding, a phenomenon known as induced fit.
Page 13
6.2 Enzymes – Influence of Substrate Concentration and Inhibitors
Affinity describes how strongly an enzyme binds its substrate.
High affinity: binding occurs even at low substrate concentration.
Low affinity: binding requires higher substrate concentration.
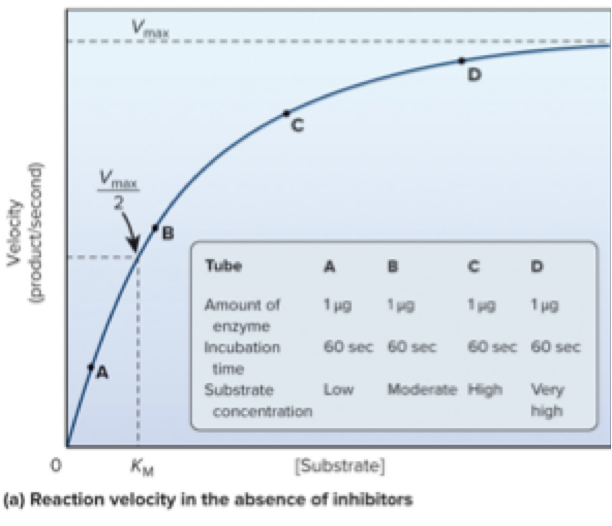
For a given enzyme concentration, increasing substrate concentration raises reaction velocity until saturation occurs.
Saturation: nearly all active sites are occupied.
Vmax: maximal rate of the reaction.
KM: substrate concentration at which velocity is half of Vmax.
Page 14
6.2 Enzymes – Inhibitors
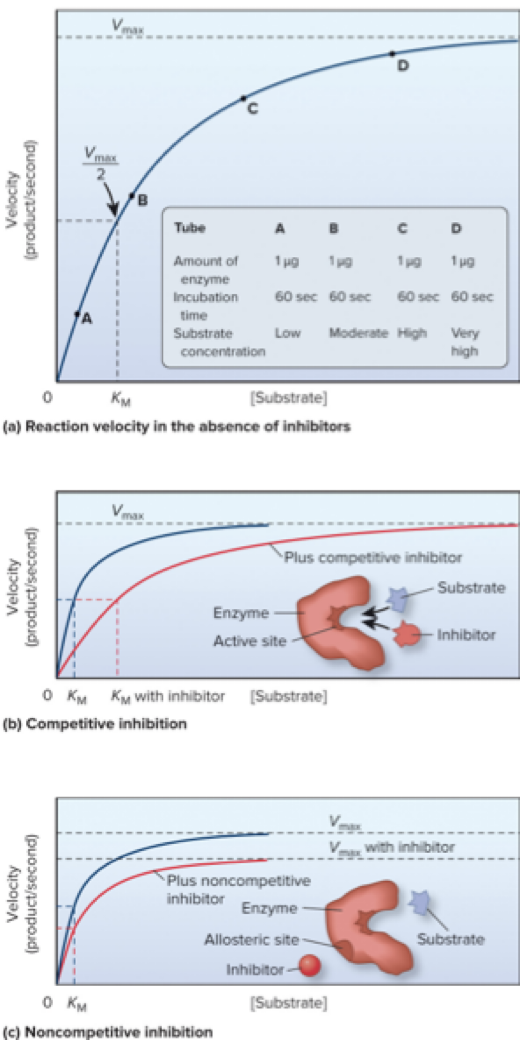
Cells often use reversible inhibitors to regulate enzyme activity.
Competitive inhibitors bind noncovalently to the active site.
Effect: apparent KM increases, requiring more substrate to achieve the same velocity.
Noncompetitive inhibitors bind to an allosteric site (distinct from the active site).
Effect: lowers Vmax without affecting KM.
Page 15
6.2 Enzymes – Additional Factors Influence Function
Some enzymes require non-protein molecules or ions to function:
Prosthetic group: a small molecule permanently attached to the enzyme (e.g., heme in hemoglobin).
Cofactor: an ion that temporarily binds to the enzyme (e.g., Fe3+, Zn2+).
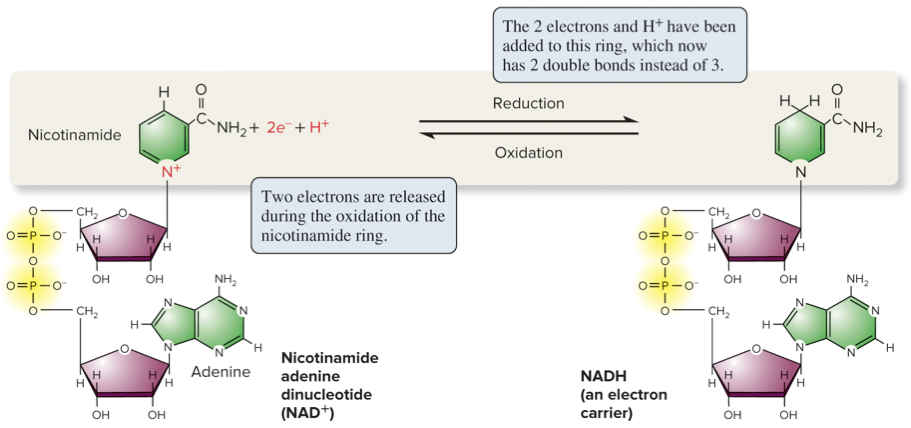
Coenzyme: an organic molecule that participates in the reaction but is left unchanged afterward (e.g., NAD+/NADH as electron carriers).
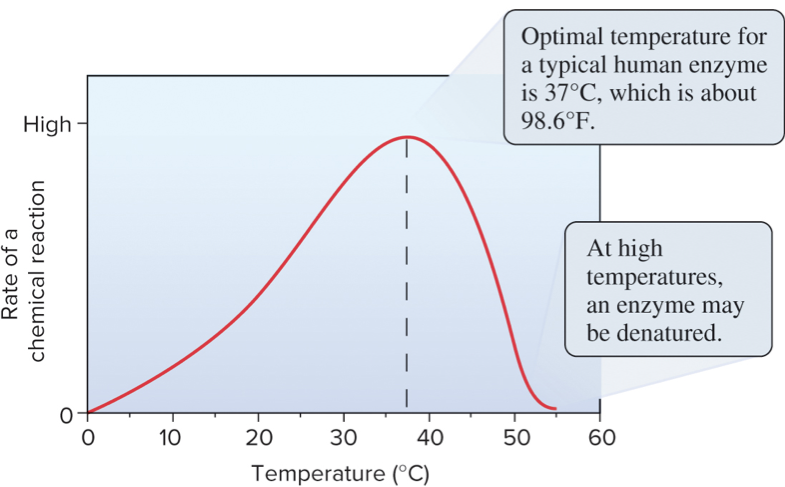
Temperature, pH, and ionic conditions influence enzyme structure and function.
Most enzymes have maximal activity within a narrow range of temperature and pH.
Page 16
6.3 Metabolic Pathways – Learning Outcomes
Describe the concept of a metabolic pathway.
Distinguish between catabolic and anabolic reactions.
Explain how catabolic reactions generate building blocks and energy intermediates.
Define redox reactions and diagram an example reaction.
Contrast three ways metabolic pathways are regulated.
Page 17
6.3 Metabolic Pathways – Overview
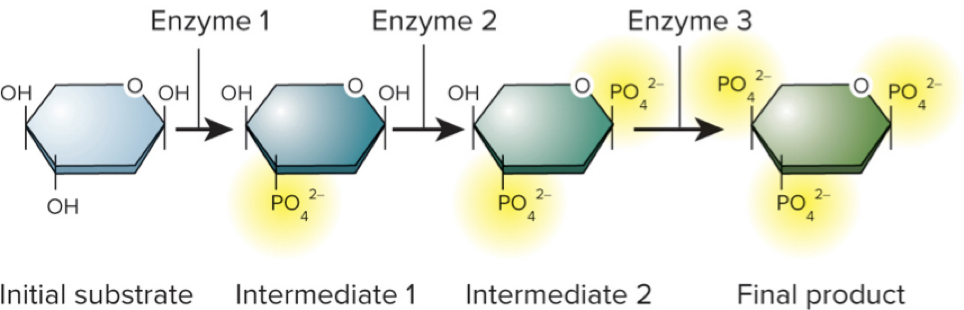
In living cells, chemical reactions are coordinated in a series of steps called a metabolic pathway.
Each step is catalyzed by a different enzyme.
Catabolic reactions break down larger molecules into smaller ones and are typically exergonic.
Anabolic reactions synthesize larger molecules from smaller ones and are typically endergonic; they must be coupled to an exergonic reaction to proceed.
Page 18
6.3 Metabolic Pathways – Catabolic Reactions
Catabolic pathways recycle organic building blocks and produce energy intermediates such as ATP.
Examples:
Recovery/recycling of amino acids from damaged proteins.
Breakdown of glucose during cellular respiration to generate ATP.
Lipolysis: the process of breaking down fats into glycerol and fatty acids for energy use.
As a larger molecule (ex: glucose) is broken down, energy is often stored in an energy intermediate such as ATP or NADH
6.3 Metabolic Pathways – Redox Reactions
Oxidation: removal of electrons.
Reduction: addition of electrons.
Redox reactions are coupled: the electron removed from one molecule is transferred to another.
Ae - + B → A + Be-
Generally, oxidized substances have lower bond energy; reduced substances have higher bond energy.
Cells use NAD+/NADH in many redox reactions, including breakdown of glucose and fats.
Page 20
6.3 Metabolic Pathways – Regulation of Pathways
Regulation occurs at three levels: genetic, cellular, and biochemical.
Gene regulation: adjusts expression levels of genes encoding enzymes.
Cells integrate environmental signals and adjust metabolic activity via signaling pathways.
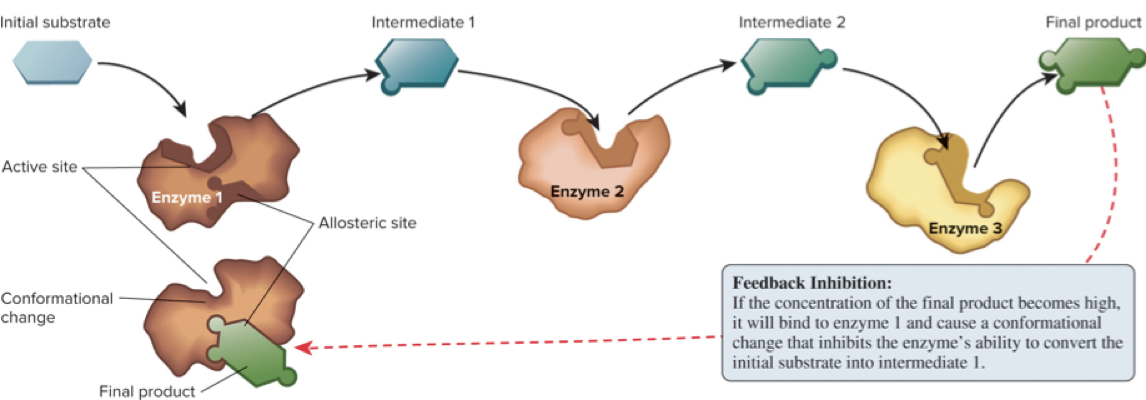
Feedback inhibition is a common regulatory mechanism: a product of a pathway binds an allosteric site on a pathway enzyme and decreases its activity.
Page 21
6.4 Overview of Cellular Respiration – Learning Outcomes
Outline, in order, the four metabolic pathways needed to break down glucose to CO2.
Page 22
6.4 Overview of Cellular Respiration – Four Stages
Cellular respiration is a process by which living cells obtain energy from organic molecules and release waste products.
Primary aim: to make ATP.
Aerobic respiration uses O2 and oxidizes organic molecules (carbohydrates, proteins, fats) to CO2.
The aerobic respiration of glucose involves four metabolic pathways:
Glycolysis
Breakdown of pyruvate (pyruvate oxidation)
Citric acid cycle
Oxidative phosphorylation
C6H12O6 + 6O2 → 6CO2 + 6H2O
Page 23
6.4 Overview of Cellular Respiration – Diagram Overview
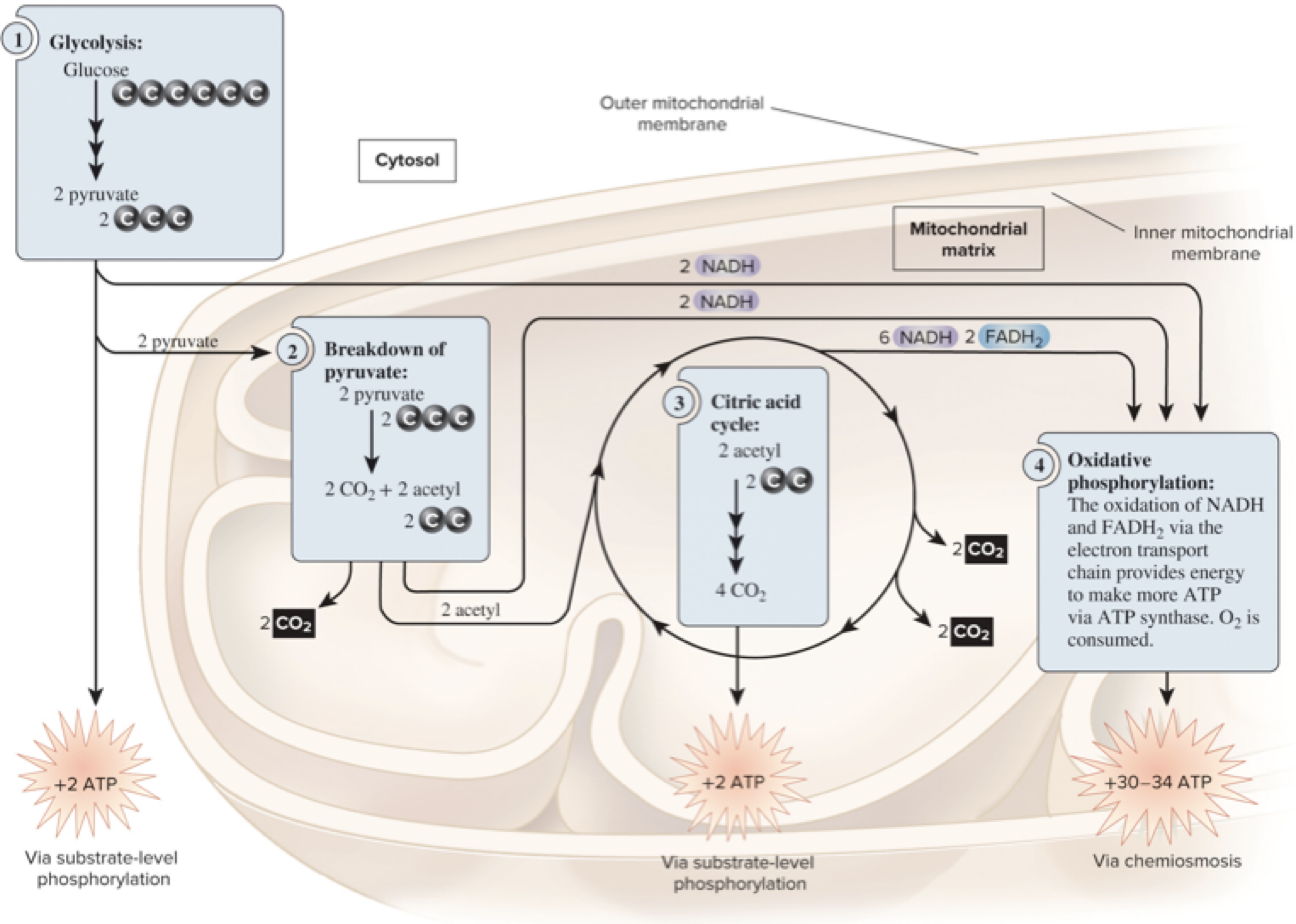
The breakdown of glucose occurs in four stages, with cellular compartments highlighted:
1) Glycolysis: glucose to 2 pyruvate in the cytosol; +2 ATP (substrate-level phosphorylation); 2 NADH.
2) Pyruvate breakdown: in the mitochondrial matrix; 2 pyruvate → 2 acetyl CoA + 2 CO2; 2 NADH.
3) Citric acid cycle: mitochondrial matrix; per glucose (2 acetyl CoA processed): produces CO2, NADH, FADH2, and ATP/GTP.
4) Oxidative phosphorylation: inner mitochondrial membrane; NADH and FADH2 feed the electron transport chain (ETC) to generate ATP via chemiosmosis; O2 is consumed; net ATP yield per glucose is largely from this stage.Summary figures often show: 2 NADH from glycolysis, 2 NADH from pyruvate oxidation, 6 NADH and 2 FADH2 from the CAC, plus ATP produced via substrate-level phosphorylation at glycolysis and CAC and large ATP through oxidative phosphorylation.
Page 24
6.5 Glycolysis – Learning Outcomes
Identify where glycolysis occurs in the cell.
Outline the 3 phases of glycolysis and identify the net products.
Describe the series of enzymatic reactions constituting glycolysis.
Diagram the inputs, outputs, and major energy transformation events of glycolysis.
Page 25
6.5 Glycolysis – Overview
Glycolysis is the first stage of cellular respiration
In eukaryotic cells, glycolysis enzymes reside in the cytosol.
There are 10 steps, each catalyzed by a different enzyme.
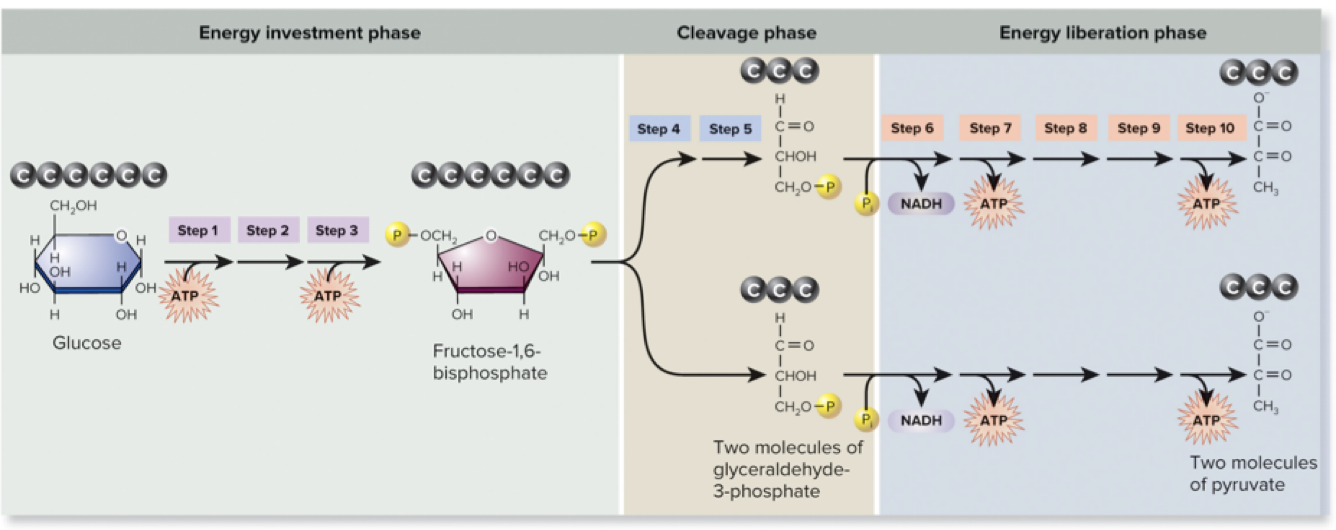
Steps are grouped into 3 phases:
Energy investment phase (consumes ATP)
Cleavage phase
Energy liberation (payoff) phase
Page 26
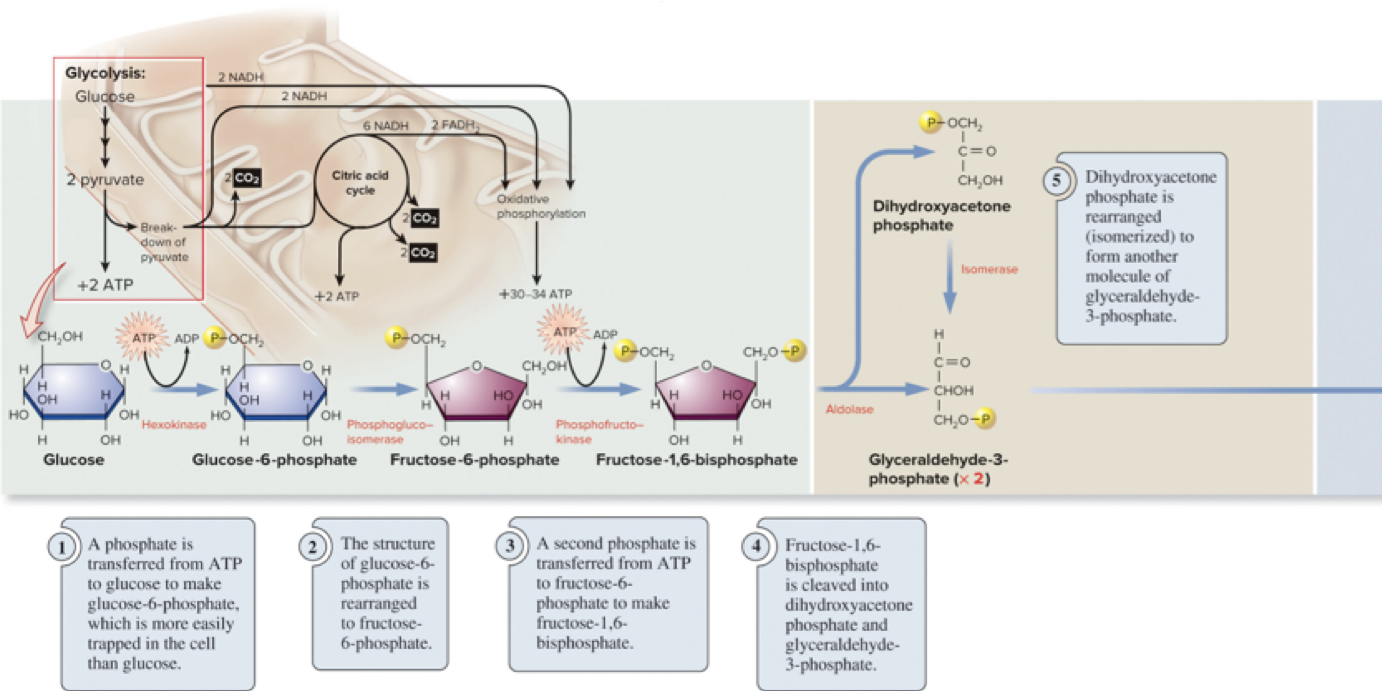
6.5 Glycolysis – Steps 1–5
The first phase involves investment of ATP to activate glucose.
Classic steps include phosphorylation and preparation for cleavage of the sugar. (Details align with the standard glycolysis sequence; the transcript notes steps 1–5 describe this early investment stage.)
Page 27
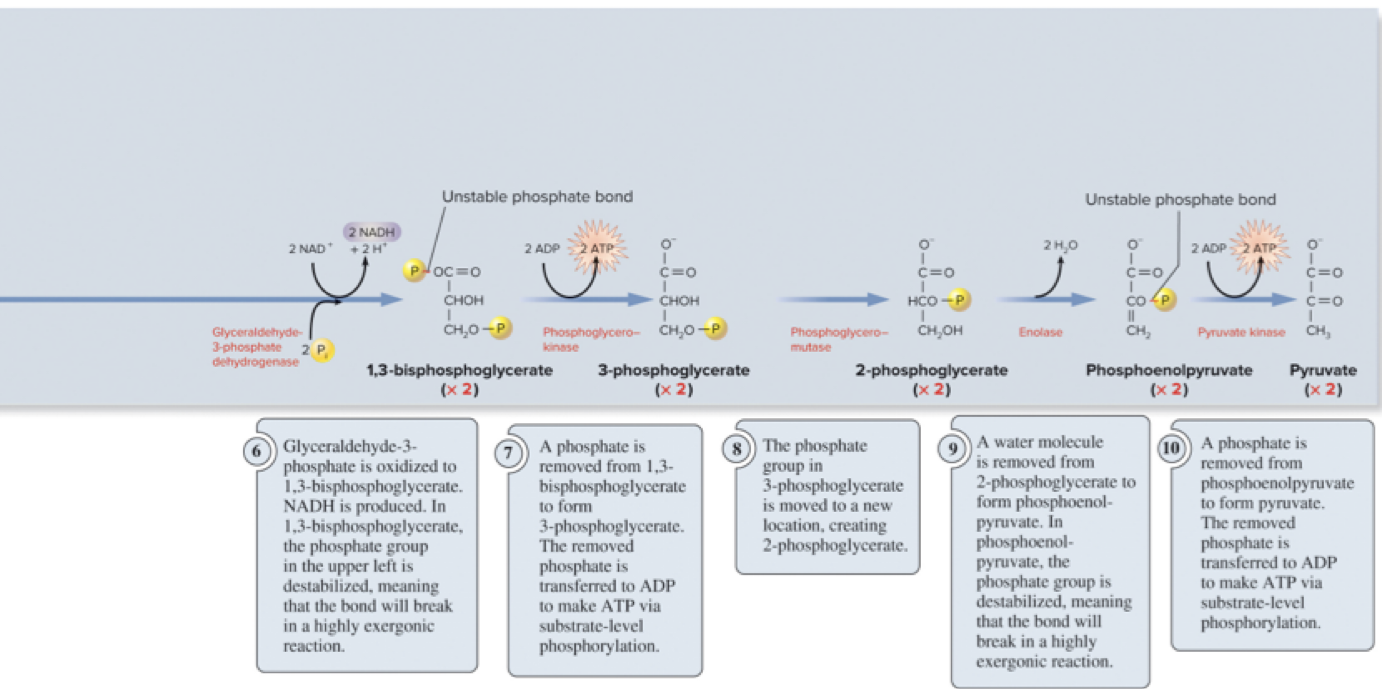
6.5 Glycolysis – Steps 6–10
The latter phase involves cleavage and payoff: substrate-level phosphorylation yields ATP and NADH.
Net products of glycolysis (per glucose):
2 pyruvate
2 ATP (net)
2 NADH
Glycolysis can occur with or without oxygen (anaerobic or aerobic conditions).
Rate is regulated by substrate availability and feedback inhibition.
Page 28
6.5 Glycolysis – Overall Summary
Overall transformation: 1 molecule of glucose → 2 molecules of pyruvate.
Net energy yield:
2\text{ ATP} and 2\text{ NADH} per glucose.
Glycolysis can proceed under anaerobic conditions; oxygen presence is not required for glycolysis itself.
Regulation is controlled by substrate availability and feedback inhibition.

Page 29
6.6 Breakdown of Pyruvate – Learning Outcomes
Identify where pyruvate oxidation occurs in the cell.
Describe how pyruvate is oxidized.
Diagram the inputs, outputs, and major energy transformation events of pyruvate oxidation.
Page 30
6.6 Breakdown of Pyruvate – Pyruvate Oxidation
Pyruvate oxidation is the second stage of cellular respiration.
Location: mitochondrial matrix.
Process: Pyruvate is transported into the matrix and oxidized by pyruvate dehydrogenase.
Per pyruvate:
A molecule of CO2 is removed.
The remaining acetyl group is attached to coenzyme A (CoA) to form acetyl CoA.
1 NADH is produced.
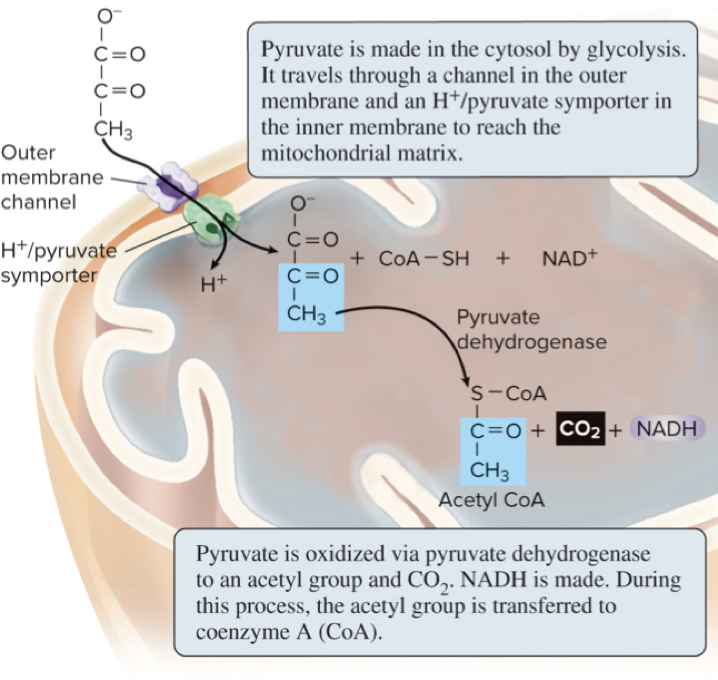
For 1 glucose (which yields 2 pyruvate): 2 acetyl CoA, 2 NADH, and 2 CO2 are produced.
Page 31
6.7 Citric Acid Cycle – Learning Outcomes
Explain the concept of a metabolic cycle.
Identify where in the cell the citric acid cycle occurs.
Describe how an acetyl group enters the citric acid cycle, and list the net products of the cycle.
Diagram the inputs, outputs, and major energy transformation events of the citric acid cycle.
Page 32
6.7 Citric Acid Cycle – Overview
The citric acid cycle is the third stage of cellular respiration.
It is a metabolic cycle: some molecules enter while others exit; some molecules are regenerated.
The 2-carbon acetyl group from acetyl CoA is transferred to the 4-carbon molecule oxaloacetate, forming the 6-carbon citrate.
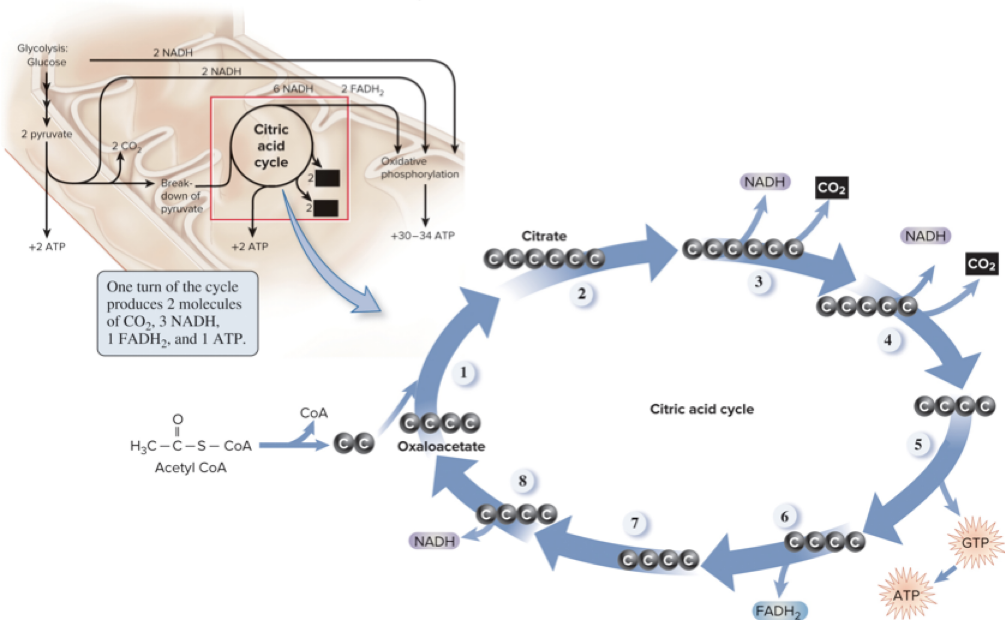
As carbons are oxidized in the cycle, products include CO2, NADH, FADH2, and ATP (via GTP).
Page 33
6.7 Citric Acid Cycle – Net Outputs and Regulation
One glucose yields 2 acetyl CoA; processing through the CAC yields:
4 CO2
6 NADH
2 FADH2
2 ATP (via GTP)
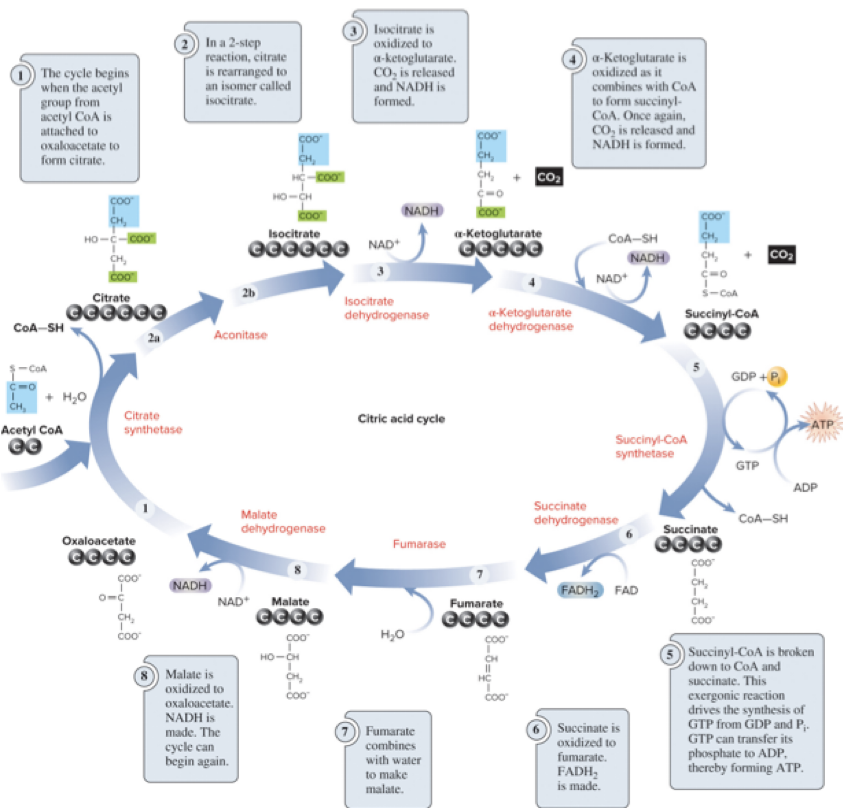
Activity of the CAC is regulated by substrate availability and feedback inhibition.
Page 34
6.8 Oxidative Phosphorylation – Learning Outcomes
Identify where oxidative phosphorylation occurs in the cell.
Outline how the electron transport chain produces a proton (H+) electrochemical gradient.
Explain how ATP synthase utilizes the H+ gradient to synthesize ATP.
Diagram the inputs, outputs, and major energy transformation events of oxidative phosphorylation.
Describe how ATP synthase spins to produce ATP.
Page 35
6.8 Oxidative Phosphorylation – Energy Transformation Summary
After glycolysis, pyruvate oxidation, and the CAC, the following high-energy products have been generated:
6\ \text{CO}_2 produced: 2\ \text{from pyruvate oxidation, 4}\ \text{from CAC}
4\ \text{ATP} produced: 2\ from glycolysis + 2\ from CAC (substrate-level phosphorylation)
10\ \text{NADH} produced: 2\ from glycolysis + 2\ from pyruvate oxidation + 6\ from CAC
2\ \text{FADH}_2 produced: from CAC
The final stage, oxidative phosphorylation, uses the energy stored in NADH and FADH2 to generate a larger amount of ATP via the electron transport chain (ETC) and ATP synthase.
Page 36
6.8 Oxidative Phosphorylation – The Electron Transport Chain (ETC)
The Electron transport chain ETC is a group of protein complexes and small organic molecules embedded in the inner mitochondrial membrane.
It transfers electrons in a linear sequence through redox reactions, moving to components of higher electronegativity.
Oxygen is the final electron acceptor at the end of the chain.
As electrons flow, some energy is used to pump protons (H+) across the membrane, creating a proton (H+) electrochemical gradient.
Page 37
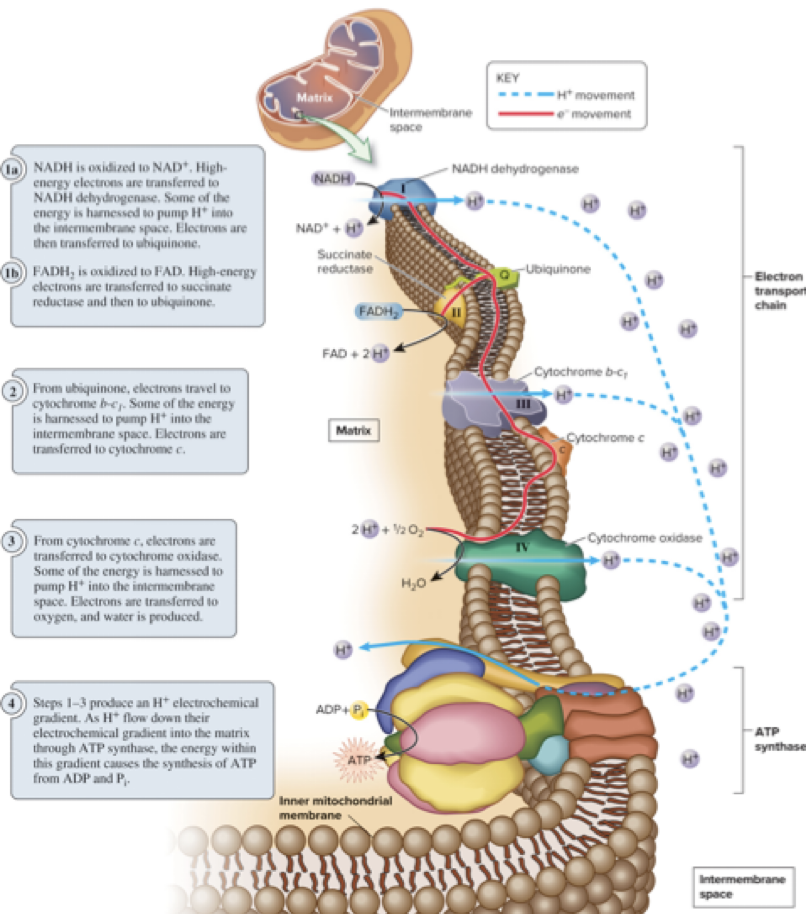
6.8 Oxidative Phosphorylation – ETC Diagram (Conceptual)
NADH and FADH2 donate electrons to the chain (NADH dehydrogenase, ubiquinone, cytochrome b-c1, cytochrome c, cytochrome oxidase).
Proton pumping occurs at multiple steps, generating the gradient.
Oxygen combines with electrons and protons to form water: 1/2 O2 + 2 e- + 2 H+ → H2O.
The gradient drives ATP synthesis via ATP synthase.
Page 38
6.8 Oxidative Phosphorylation – ATP Synthesis via Chemiosmosis
The H+ gradient represents stored potential energy.
The inner mitochondrial membrane is relatively impermeable to H+.
H+ ions flow back across the membrane through ATP synthase, causing conformational changes that drive the synthesis of ATP from ADP and Pi.
Page 39
6.8 Oxidative Phosphorylation – Chemiosmosis and Regulation
Chemiosmosis refers to ATP synthesis driven by the flow of protons across a membrane.
This process is distinct from substrate-level phosphorylation (where a phosphate is transferred directly to ADP in a chemical step).
Regulation of oxidative phosphorylation depends on the availability of NADH and O2, and on the ATP/ADP ratio.
Page 40
6.8 Oxidative Phosphorylation – NADH Oxidation and ATP Yield
NADH oxidation contributes a large portion to the proton gradient used to synthesize ATP.
Approximate stoichiometry: about 3–4 protons crossing the gradient per ATP synthesized (per ATP produced).
The theoretical maximum ATP per glucose via oxidative phosphorylation is about 30 ext{-}34 ATP molecules per glucose.
In practice, cells often synthesize less ATP because NADH is used in anabolic pathways and the proton gradient is utilized for other cellular processes; typically around 25 ATP per glucose, still far more than glycolysis or CAC alone.
Page 41
6.8 Oxidative Phosphorylation – ATP Synthase as a Rotary Machine
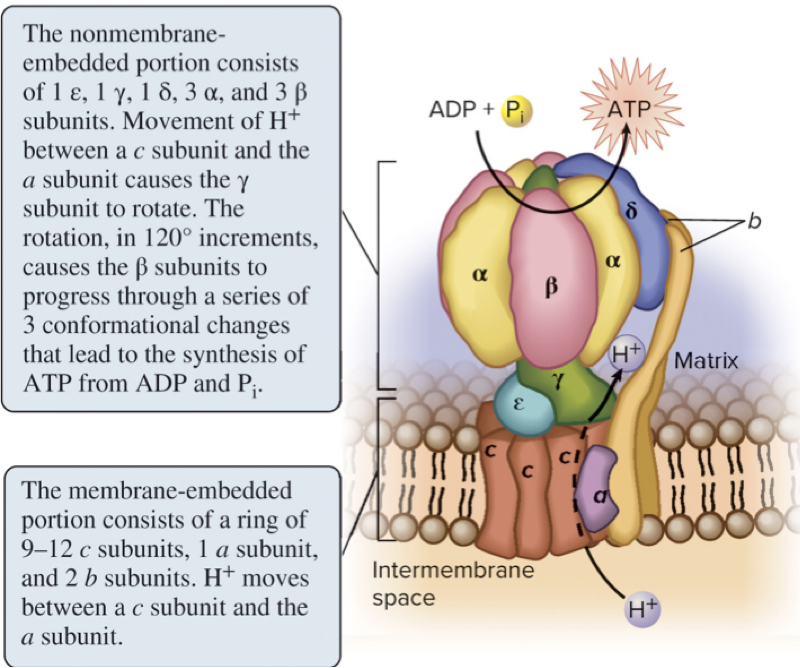
ATP synthase is a rotary molecular machine with multiple subunits (examples: a, b, c, ε, γ, α, β, δ).
Page 42
6.8 Oxidative Phosphorylation – The Rotary Mechanism
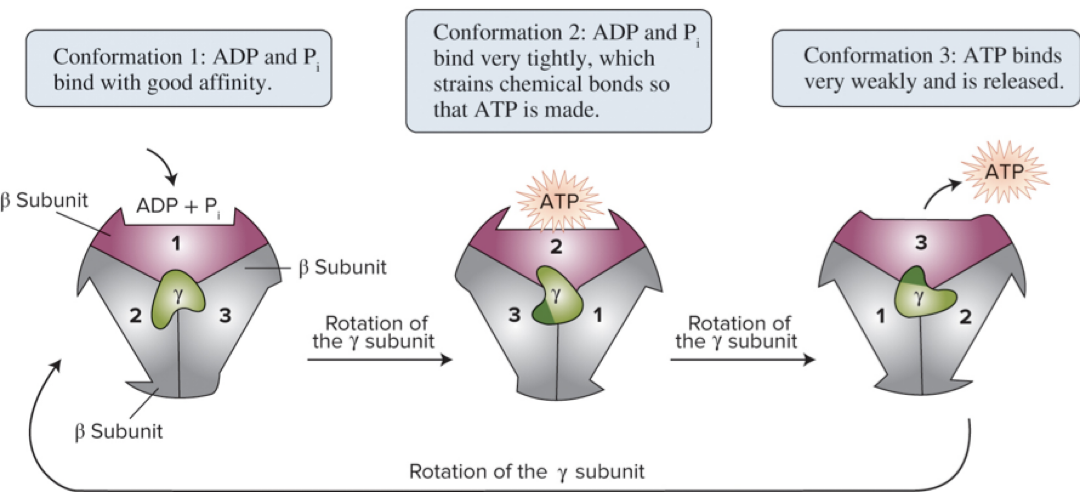
The β (beta) subunits contain catalytic sites where ATP is formed.
As the rotor (the γ subunit) turns due to H+ flow, it induces conformational changes in the β subunits.
These conformational changes drive the catalytic cycle of ATP synthesis.
Page 43
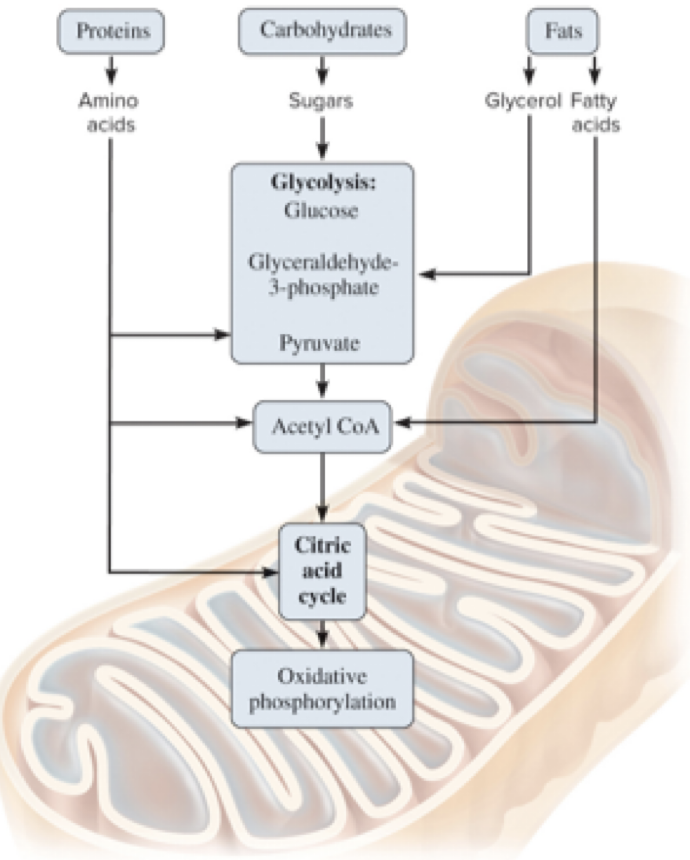
6.9 Connections Among Carbohydrate, Protein, and Fat Metabolism
The foods we eat contain carbohydrates, proteins, and fats.
Proteins and fats can be broken down into smaller molecules that enter glycolysis or the CAC at various points.
Page 44
6.9 Connections Among Carbohydrate, Protein, and Fat – Practical Interplay
Intermediates from one macromolecule class can feed into other pathways, illustrating metabolic integration.
Page 45
6.10 Anaerobic Respiration and Fermentation – Learning Outcomes
Describe how certain microorganisms make ATP using a final electron acceptor in the electron transport chain that is not oxygen.
Explain how muscle and yeast cells use fermentation to synthesize ATP under anaerobic conditions.
Page 46
6.10 Anaerobic Respiration and Fermentation – Anaerobic Environments
An environment lacking oxygen is described as anaerobic.
Many bacteria, archaea, and some fungi live in anaerobic environments (e.g., deep soil or the intestinal tract) but must oxidation of organic molecules to obtain energy.
Human skeletal muscle cells can become anaerobic during strenuous exercise.
Cells can metabolize organic molecules in the absence of oxygen through two strategies:
Anaerobic respiration using a different final electron acceptor (not O2).
Fermentation that produces ATP via substrate-level phosphorylation without net oxidation of organic molecules.
Page 47
6.10 Anaerobic Respiration and Fermentation – Anaerobic Respiration in Microorganisms
Many bacteria under anaerobic conditions use enzymes that function similarly to cytochrome oxidase but accept alternatives to O2 as the final electron acceptor.
Example: E. coli can produce nitrate reductase, using nitrate (NO3−) as the final electron acceptor.
The ETC in these organisms generates an H+ electrochemical gradient that can drive ATP synthase.
Note: In bacteria, the ETC is located in the plasma membrane.
Page 48
6.10 Anaerobic Respiration and Fermentation – Fermentation
Fermentation allows ATP production without net oxidation of organic molecules.
In many organisms, ATP production under anaerobic conditions is achieved mainly through glycolysis, with NAD+ regeneration by fermentation.
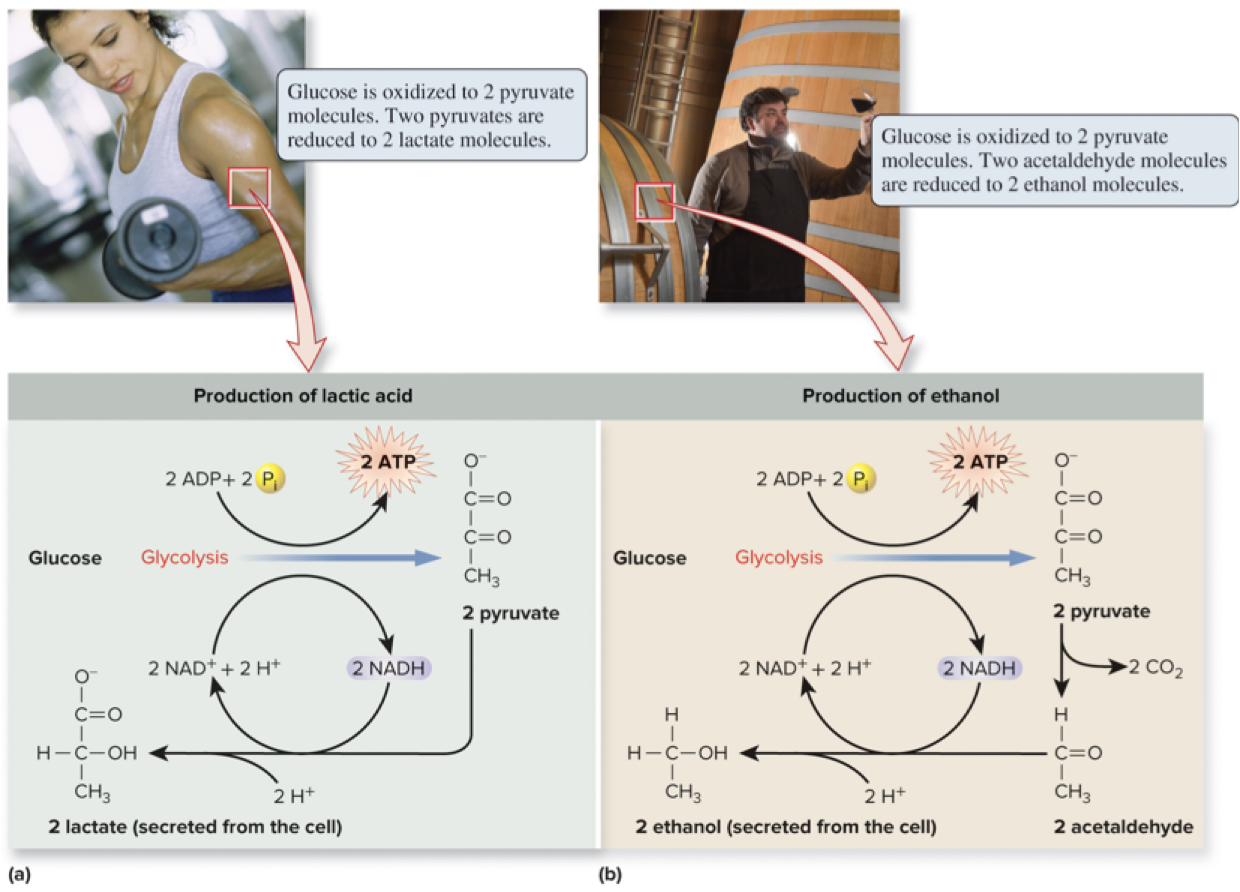
Examples:
Lactic acid fermentation in muscle tissue.
Ethanol fermentation in yeast.
Under anaerobic conditions, NADH builds up and NAD+ decreases
In fermentation, NADH is oxidized back to NAD+, enabling glycolysis to continue.
Although electrons are removed from glucose, the overall oxidation is not achieved; the process regenerates NAD+ and allows continued ATP production via glycolysis.
Page 49
6.10 Anaerobic Respiration and Fermentation – Continuing Fermentation Concepts
Fermentation does not yield additional net oxidation beyond glycolysis; it regenerates NAD+ to sustain glycolytic ATP production under anaerobic conditions.
Page 50
Chapter 6 Summary (Part 1)
6.1 Energy and chemical reactions
Energy exists in different forms, guided by the laws of thermodynamics.
The change in free energy determines the direction of a chemical reaction (exergonic vs endergonic).
Equilibria are eventually reached; cells use ATP to drive endergonic reactions.
6.2 Enzymes
Enzymes increase reaction rates by lowering activation energy.
Substrates bind with high specificity; induced fit occurs.
Enzyme activity is influenced by substrate concentration and inhibitors.
Additional factors such as cofactors/coenzymes/prosthetic groups, temperature, and pH affect enzyme function.
Page 51
Chapter 6 Summary (Part 2)
6.3 Metabolic pathways
Catabolic pathways recycle building blocks and produce energy intermediates (e.g., ATP).
Redox reactions involve electron transfer.
Metabolic pathways are regulated.
6.4 Overview of cellular respiration
Glucose breakdown occurs in four stages: glycolysis, pyruvate breakdown, CAC, oxidative phosphorylation.
6.5 Glycolysis
Breaks down glucose to pyruvate in the cytosol; 10 steps; three phases (investment, cleavage, payoff).
6.6 Breakdown of pyruvate (pyruvate oxidation)
Occurs in the mitochondrial matrix; generates acetyl CoA, CO2, and NADH.
6.7 Citric acid cycle
Occurs in the mitochondria; acetyl CoA enters the cycle; yields CO2, NADH, FADH2, and ATP.
Page 52
Chapter 6 Summary (Part 3)
6.8 Oxidative phosphorylation
ETC creates an electrochemical gradient; ATP synthase uses chemiosmosis to synthesize ATP.
NADH oxidation contributes significantly to ATP production.
ATP synthase is a rotary machine that spins to produce ATP.
6.9 Connections among carbohydrate, protein, and fat metabolism
Proteins and fats can feed into glycolysis or the CAC at different points.
6.10 Anaerobic respiration and fermentation
Some microorganisms use anaerobic respiration with a non-oxygen final electron acceptor.
Fermentation allows ATP production without net oxidation, illustrated by lactic acid and ethanol fermentation.