Data Mining
• Why Data Mining?
Data mining helps uncover hidden patterns, trends, and insights from large datasets, making smarter decisions and predictions possible for businesses, science, and more.
• What Is Data Mining?
Data mining is the process of extracting meaningful information from large amounts of raw data using techniques like algorithms and machine learning.
• A Multi-Dimensional View of Data Mining
Data mining looks at data from multiple perspectives: patterns, associations, clusters, outliers, and trends—giving a richer understanding of the data.
• What Kinds of Data Can Be Mined?
Any kind of data can be mined: structured (databases), unstructured (text, images), semi-structured (web data), and even complex data like time series or graphs.
• Data Mining Functionalities
It performs tasks like classification, regression, clustering, association rule mining, anomaly detection, and trend analysis.
• The Interdisciplinary Nature of Data Mining
Data mining blends fields like statistics, machine learning, database systems, and artificial intelligence to extract knowledge from data.
• Applications of Data Mining
Used in fields like healthcare (disease prediction), marketing (customer segmentation), finance (fraud detection), and more, to improve processes and decisions.
• Major Issues in Data Mining
Challenges include data quality, privacy concerns, model accuracy, scalability with big data, and ensuring that findings are actionable and interpretable.
What kinds of data can be mined?
Structured Data: Data stored in traditional databases or spreadsheets, where information is organized into rows and columns (e.g., relational databases).
Semi-Structured Data: Data that doesn’t have a strict format but contains some organizational properties, like XML files, JSON, or HTML.
Unstructured Data: Raw data that lacks a predefined structure, such as text, images, audio, videos, or social media posts.
Time-Series Data: Data collected over time intervals, like stock prices, sensor readings, or weather data.
Spatial Data: Geographic or location-based data, like maps, satellite imagery, and GPS coordinates.
Web Data: Data gathered from the internet, including website content, clickstream data, and social network interactions.
Graph Data: Data that represents relationships between entities, such as social networks, or connections in transportation systems.
Multimedia Data: Data in the form of images, video, and audio, used in applications like facial recognition and video recommendation systems.
Alternative Names for Data Mining
Knowledge Discovey from Data
Knowledge Extraction
Data/pattern analysis
Information harvesting
A data warehouse is a centralized repository of data from multiple sources, designed for analysis and reporting. It's like a massive library of information that businesses use to make informed decisions.
Key characteristics of a data warehouse:
Centralized: All data is stored in one place, making it easier to access and manage.
Integrated: Data from various sources is combined and harmonized to provide a consistent view.
Time-variant: It stores historical data, allowing for trend analysis and forecasting.
Subject-oriented: Data is organized around specific business subjects, such as customers, products, or sales.
Why use a data warehouse?
Improved decision-making: By analyzing historical data, businesses can identify patterns, trends, and insights that inform strategic decisions.
Enhanced reporting: Data warehouses power business intelligence tools, generating reports and dashboards to monitor performance and identify opportunities.
Increased efficiency: Centralized data eliminates data silos and streamlines reporting processes.
Better customer understanding: Analyzing customer data helps businesses tailor products and services to meet specific needs.
In essence, a data warehouse is a valuable tool for businesses to unlock the power of their data and drive growth.
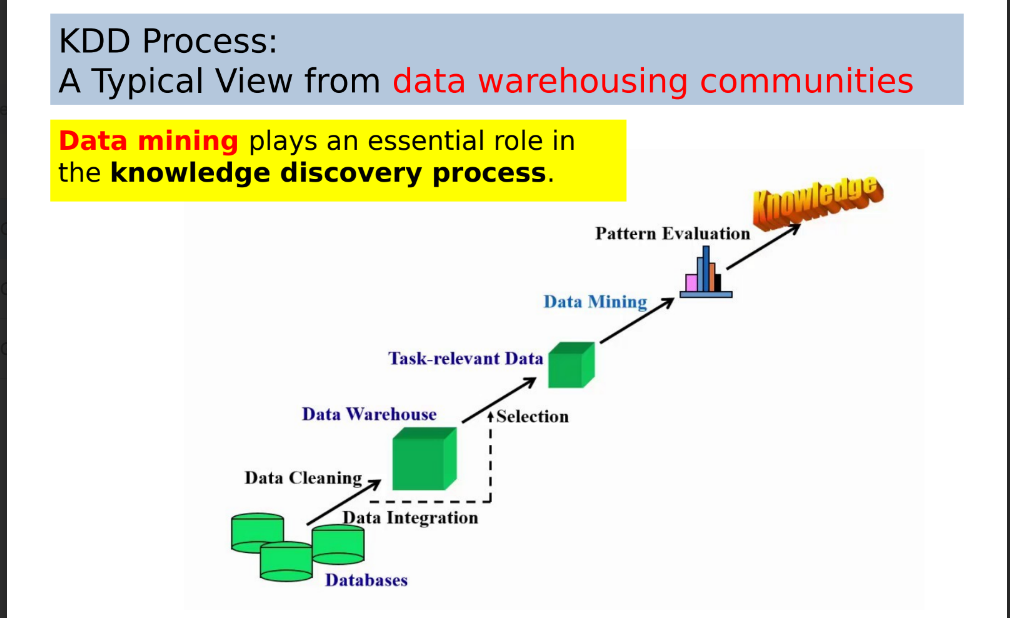
Here's a breakdown of each stage:
Input Data: This is the raw data that needs to be processed to extract meaningful patterns.
Data Pre-Processing:
Data Integration: Combining data from different sources into a unified dataset.
Normalization: Scaling data values to a standard range, usually to improve the performance of algorithms.
Feature Selection: Choosing relevant variables or features that will be used for analysis, reducing complexity.
Dimension Reduction: Reducing the number of features (or dimensions) while preserving important information, making the data easier to work with.
Data Mining:
Pattern Discovery: Identifying interesting patterns, trends, or relationships in the data.
Association & Correlation: Finding relationships between variables, such as items frequently bought together.
Classification: Categorizing data into predefined groups or classes (e.g., classifying emails as spam or not).
Clustering: Grouping similar data points into clusters without predefined categories.
Outlier Analysis: Detecting data points that significantly deviate from the rest, which may indicate errors or rare events.
Post-Processing:
Pattern Evaluation: Assessing the discovered patterns for relevance and accuracy.
Pattern Selection: Choosing the most important or useful patterns from the results.
Pattern Interpretation: Understanding and explaining the patterns in a meaningful way.
Pattern Visualization: Displaying patterns graphically to make them easier to interpret.
Pattern Information Knowledge: The ultimate goal, where useful insights and knowledge are extracted and used for decision-making or further analysis.
Each stage plays a crucial role in turning raw data into actionable knowledge, which is the essence of the KDD process.
Market Basket Analysis (MBA) is a data mining technique used to understand consumer purchasing behavior. It's commonly applied in retail and e-commerce to identify associations between items frequently bought together. The goal is to find patterns or rules that help understand which products tend to be purchased together, allowing businesses to make informed decisions on product placement, promotions, and inventory management.
How It Works
MBA uses association rule learning to uncover patterns in transactional data. The data typically consists of a collection of "baskets" or transactions, each listing items purchased together. For example, if a customer buys bread and milk together frequently, this pattern is recorded and analyzed. The technique helps retailers answer questions like, "If a customer buys product A, how likely are they to also buy product B?"
• Database-oriented data sets and applications
– Relational database, data warehouse, transactional database
• Advanced data sets and applications
– Data streams (e.g., video surveillance and sensor data)
– Ordered/sequence data (e.g., stock exchange data, time-series data
and biological sequence data)
– Graph or networked data (e.g., social networks and multi-linked
data)
– Spatial data (e.g., maps)
– Multimedia data
– Text data
– The World-Wide Web
A relational database is a collection of tables, each of which is assigned a unique name.
• Each table consists of a set of attributes (columns or fields) and
usually stores a large set of tuples (records or rows ).
• Each tuple in a relational table represents an object identified by
a unique key and described by a set of attribute values.
A data warehouse is usually modeled by a multidimensional data structure, called a data cube.
• Each dimension corresponds to an attribute or a set of attributes in the schema.
• Each cell stores the value of some aggregate measure such as count or sum(sales_amount).
• In general, each record in a transactional database captures a transaction, such as a customer’s purchase, a flight booking, or a user’s clicks on a web page.
• A transaction typically includes a unique transaction identity number (trans_ID) and a list of the items making up the transaction, such as the items purchased in the transaction.
Collaborative Analysis and Recommender Systems
Collaborative analysis is a technique used to analyze user behavior and preferences based on their interactions with a system or product. It's a fundamental component of recommender systems.
Recommender systems are algorithms that suggest items to users based on their past behavior and the behavior of similar users. These systems are widely used in various applications, including:
E-commerce: Recommending products to customers.
Media streaming: Suggesting movies, TV shows, or music.
Social media: Suggesting friends or content.
Types of Collaborative Filtering:
User-Based Collaborative Filtering:
This approach identifies users with similar preferences.
It recommends items that similar users have liked.
Example: If User A and User B have similar ratings for movies, and User A likes a movie that User B hasn't seen, the system recommends that movie to User B.
Item-Based Collaborative Filtering:
This approach identifies items that are similar to each other based on user ratings.
It recommends items that are similar to items a user has liked.
Example: If a user likes two movies with similar genres, the system might recommend other movies with the same genre.
Key Challenges and Considerations:
Cold Start Problem: When new users or items are introduced, there's limited data to make accurate recommendations.
Sparsity: Real-world datasets are often sparse, meaning that most users have only rated a small fraction of items.
Scalability: As the number of users and items grows, the computational complexity of collaborative filtering can increase significantly.
Privacy Concerns: User data needs to be handled carefully to protect privacy and avoid potential biases.
To address these challenges, hybrid approaches that combine collaborative filtering with content-based filtering or other techniques are often used. Additionally, techniques like dimensionality reduction and matrix factorization can help improve the performance of recommender systems.
In essence, collaborative analysis and recommender systems aim to provide personalized recommendations by leveraging the collective wisdom of the user community.
Data preprocessing is a crucial step in preparing raw data for analysis and machine learning. It involves cleaning and transforming data to ensure it is of high quality, making it more suitable for modeling and analysis. Here's a breakdown of these concepts:
Data Quality: Why Preprocess the Data?
Data quality is essential because poor-quality data can lead to inaccurate or misleading results. Raw data often contains noise, missing values, inconsistencies, and redundant information, which can interfere with analysis and reduce the performance of machine learning models. Preprocessing the data ensures that it is clean, consistent, and complete, allowing for more accurate and reliable analysis.
Major Tasks in Data Preprocessing
Data preprocessing generally involves four main tasks:
Data Cleaning: Removing or fixing inconsistencies, errors, and noise in the data.
Data Integration: Combining data from multiple sources into a cohesive dataset.
Data Reduction: Reducing the volume of data while retaining essential information, making it easier and faster to analyze.
Data Transformation and Data Discretization: Converting data into a suitable format for analysis and, if needed, discretizing continuous data into categories.
Data Preprocessing Techniques
1. Data Cleaning
Data cleaning aims to resolve issues in data, such as:
Handling Missing Values: Filling in missing data or discarding rows/columns with too many missing values.
Smoothing Noisy Data: Reducing the impact of outliers by applying techniques like binning, regression, or clustering.
Correcting Inconsistencies: Fixing errors in the data, such as incorrect values or duplicate entries, to ensure consistency.
2. Data Integration
Data integration combines data from multiple sources (like databases or files) into a single dataset. During integration, it’s essential to handle:
Schema Mismatch: Resolving conflicts in data formats, units, or naming conventions.
Redundancy: Identifying and removing duplicated information that may arise from integrating multiple data sources.
3. Data Reduction
Data reduction simplifies the dataset, making it more manageable by reducing its size while retaining critical information. This step can include:
Dimensionality Reduction: Using techniques like Principal Component Analysis (PCA) to reduce the number of variables in a dataset.
Data Compression: Encoding data to occupy less storage.
Data Sampling: Selecting a subset of data that is representative of the entire dataset to speed up analysis.
4. Data Transformation and Data Discretization
Data Transformation: Converting data into a format suitable for analysis. Common techniques include:
Normalization: Scaling features to a particular range (e.g., 0 to 1).
Standardization: Adjusting data to have a mean of 0 and a standard deviation of 1.
Data Discretization: Converting continuous data into discrete categories. This is useful when working with algorithms that require categorical inputs.