Carbon Dioxide Transport

Just like oxygen wasn’t all dissolved in the blood, CO₂ also has several transport modes. The instructor is setting the stage for these.
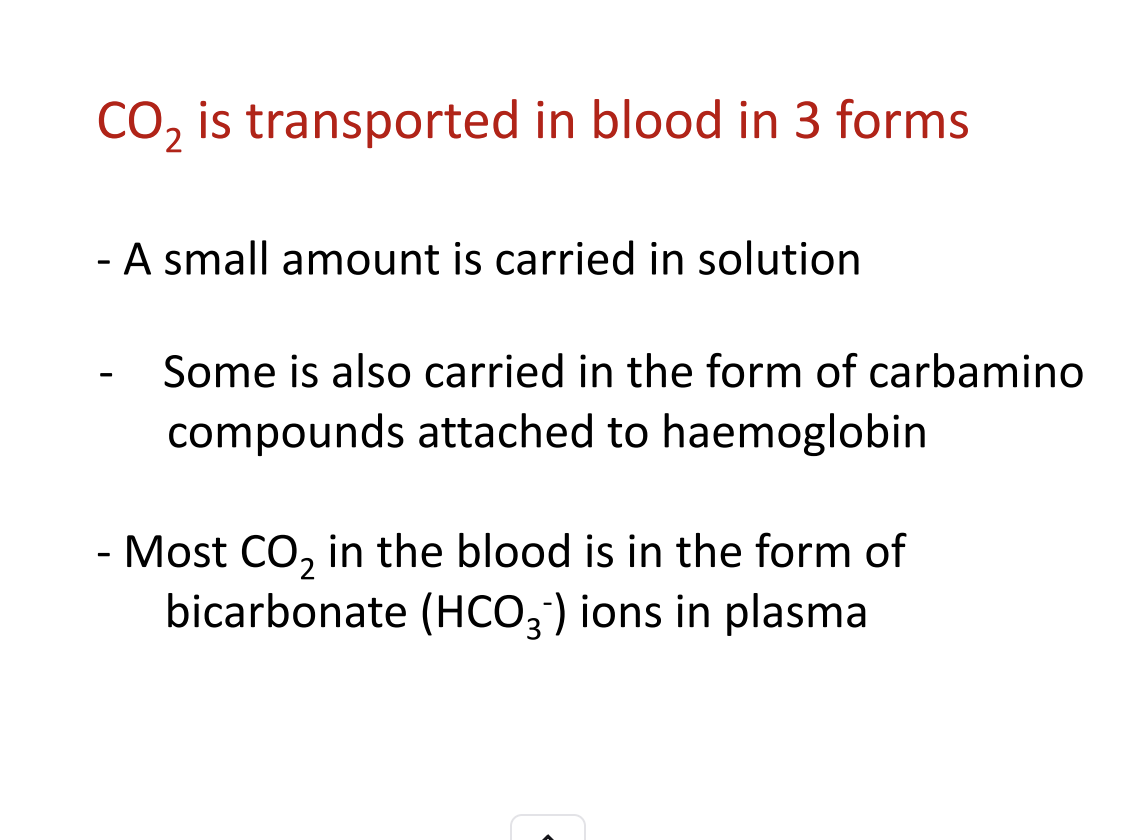
The three major forms:
Dissolved CO₂
A small amount simply dissolves into the plasma.
This is similar to dissolved O₂, but CO₂ is more soluble, so a bit more dissolves.
Carbamino compounds
This refers mainly to CO₂ bound to proteins, especially hemoglobin (Hb).
You don’t need to worry about it yet—details are coming later.
Bicarbonate (HCO₃⁻) — the big one
Most CO₂ in the blood is carried this way.
This is the major takeaway.
Nearly all vertebrates transport CO₂ primarily as bicarbonate.
The instructor emphasizes how simple the chemistry actually is when you see it explained step-by-step.
Just like oxygen was mostly transported in the blood attached to hemoglobin,
carbon dioxide is mostly transported in the blood in another form — bicarbonate (HCO₃⁻).
You don't need all the mechanisms yet — the instructor is just giving you the map before the details
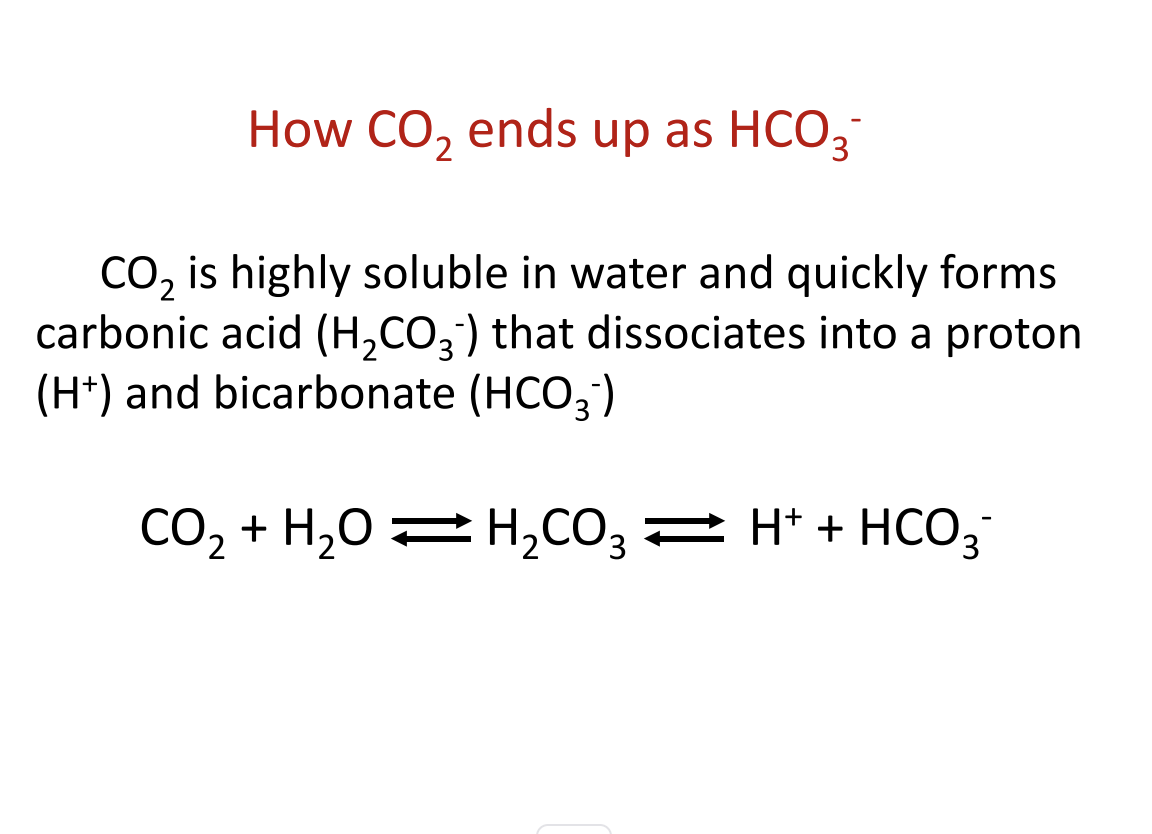
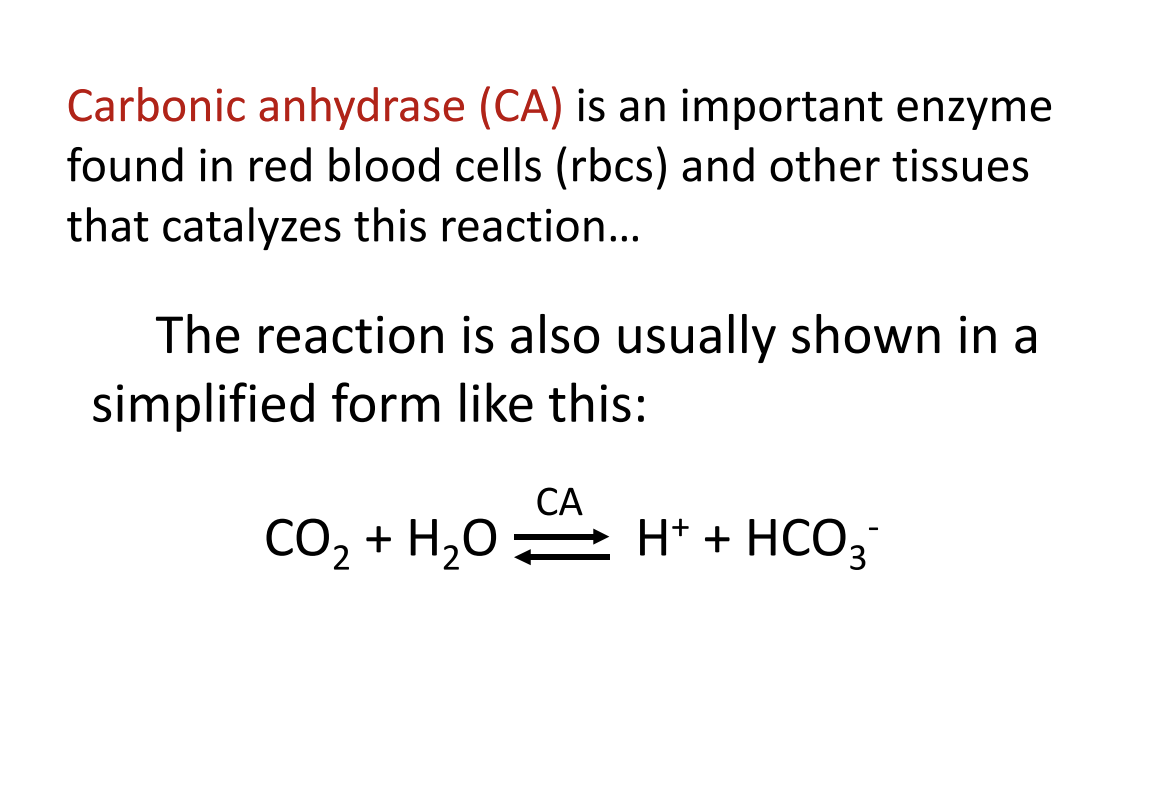
When CO₂ comes out of the tissues and enters the blood, it reacts with water:
CO₂+H₂O ⟷ H⁺+HCO₃
“You don’t need to worry about the left side. Look at the right side.”
Because the important point is:
CO₂ is converted into H⁺ and bicarbonate (HCO₃⁻).
This is where almost all the bicarbonate in the blood comes from.
Why?
Because in the tissues:
CO₂ is entering the blood (coming from metabolism).
So you’re adding CO₂.
Adding CO₂ pushes the reaction toward making more H⁺ and more bicarbonate.
This is how we end up with lots of bicarbonate in the blood.
our instructor is emphasizing this because it’s central to why bicarbonate becomes so abundant.
Here’s the key idea:
When the reaction makes H⁺, those H⁺ don’t just float around.
They get buffered (soaked up) by molecules in the blood.
A major buffer is hemoglobin (your instructor will explain this later).
And because buffering removes H⁺ from the solution, the reaction keeps shifting right:
Remove H⁺ → the body makes more H⁺ → which means more bicarbonate forms.
This is Le Châtelier’s principle in action, but in plain physiological terms.
Bicarbonate levels are high in almost all vertebrates because CO₂ gets converted and H⁺ gets buffered.
And the textbook talks about this early because it’s a key foundation for:
CO₂ transport
Acid–base balance
The role of hemoglobin as a buffer
Your instructor is returning to the main reaction:
CO₂+H₂O ⟷ H⁺+HCO₃⁻\text{CO₂} + \text{H₂O} \;\longleftrightarrow\; \text{H⁺} + \text{HCO₃⁻}CO₂+H₂O⟷H⁺+HCO₃⁻
And now the key point is:
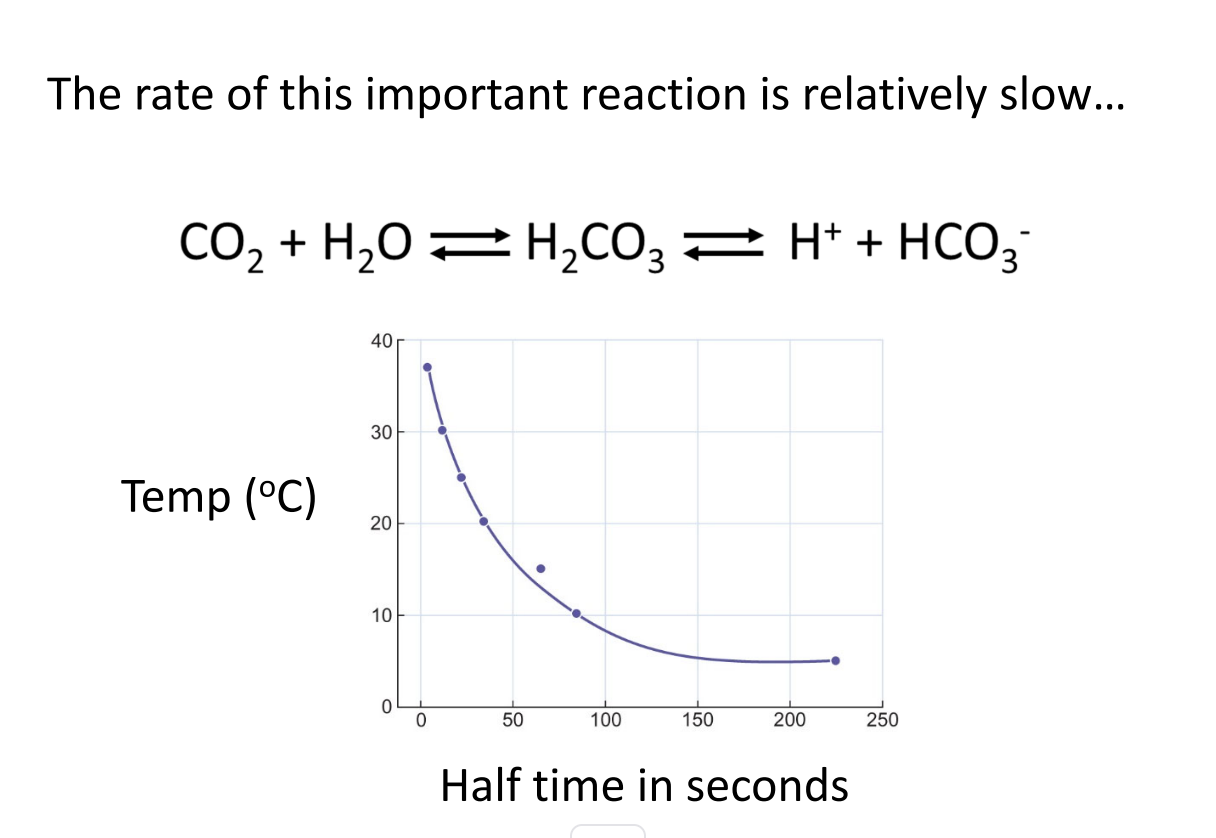
1. This reaction is slow if it’s uncatalyzed
That’s what the figure they mentioned (but said isn’t in your text) is showing.
Without help, CO₂ reacting with water to form H⁺ and bicarbonate happens very slowly.
Yes, the reaction does occur on its own.
But it’s too slow to meet physiological needs—because CO₂ must be converted rapidly as blood moves through capillaries.
The graph they mention shows:
Reaction rate depends on temperature (warmer = faster).
But even at body temperature, it’s still too slow.
That’s the only point.
2. This sets up the need for a catalyst
They haven’t said it yet, but they’re leading you to:
Carbonic anhydrase (CA)
—an enzyme in red blood cells that speeds the reaction up by ~10⁶ times.
Your instructor is prepping you for the idea that without carbonic anhydrase:
CO₂ wouldn’t convert fast enough to bicarbonate.
CO₂ transport would be inefficient.
Blood couldn’t carry nearly as much CO₂.
They’ll describe this next.
3. Why they emphasize this “slowness”
Because they want you to remember:
Uncatalyzed = slow
Catalyzed by carbonic anhydrase = fast enough for life
Everything else builds on this point.
Before:
The CO₂ + H₂O → H⁺ + HCO₃⁻ reaction is very slow on its own.
Now:
The body fixes this problem using an enzyme.
1. Carbonic anhydrase (CA) catalyzes the reaction
Your instructor emphasizes:
You need to know this enzyme
It’s highly concentrated in red blood cells (RBCs)
Present in some other tissues, but not normally in plasma
Carbonic anhydrase speeds up the conversion between:
CO₂+H₂O ⟷ H⁺+HCO₃⁻\text{CO₂} + \text{H₂O} \;\longleftrightarrow\; \text{H⁺} + \text{HCO₃⁻}CO₂+H₂O⟷H⁺+HCO₃⁻
They simplified the reaction to the standard physiological form so you can focus on what matters.
2. What carbonic anhydrase does
It increases the reaction speed by ~1 million–fold.
That means:
In tissues
CO₂ produced by metabolism enters blood → converted rapidly to H⁺ + HCO₃⁻ inside RBCs.
In lungs
The reaction reverses: HCO₃⁻ + H⁺ → CO₂ + H₂O
CO₂ then diffuses out into alveoli and is exhaled.
3. Why it’s only in RBCs
This is a subtle point your instructor hinted at:
RBCs need extremely fast conversion to handle the huge CO₂ load coming from tissues.
Plasma does not contain carbonic anhydrase, so the uncatalyzed reaction there is slow.
This creates a functional separation:
Most CO₂ processing happens inside RBCs, not in plasma.
Different body regions use carbonic anhydrase differently:
RBCs: CO₂ transport.
Kidney tubules: acid–base balance (bicarbonate reabsorption).
Some tissues: local pH regulation.
But for your course, the focus is RBCs and CO₂ transport.
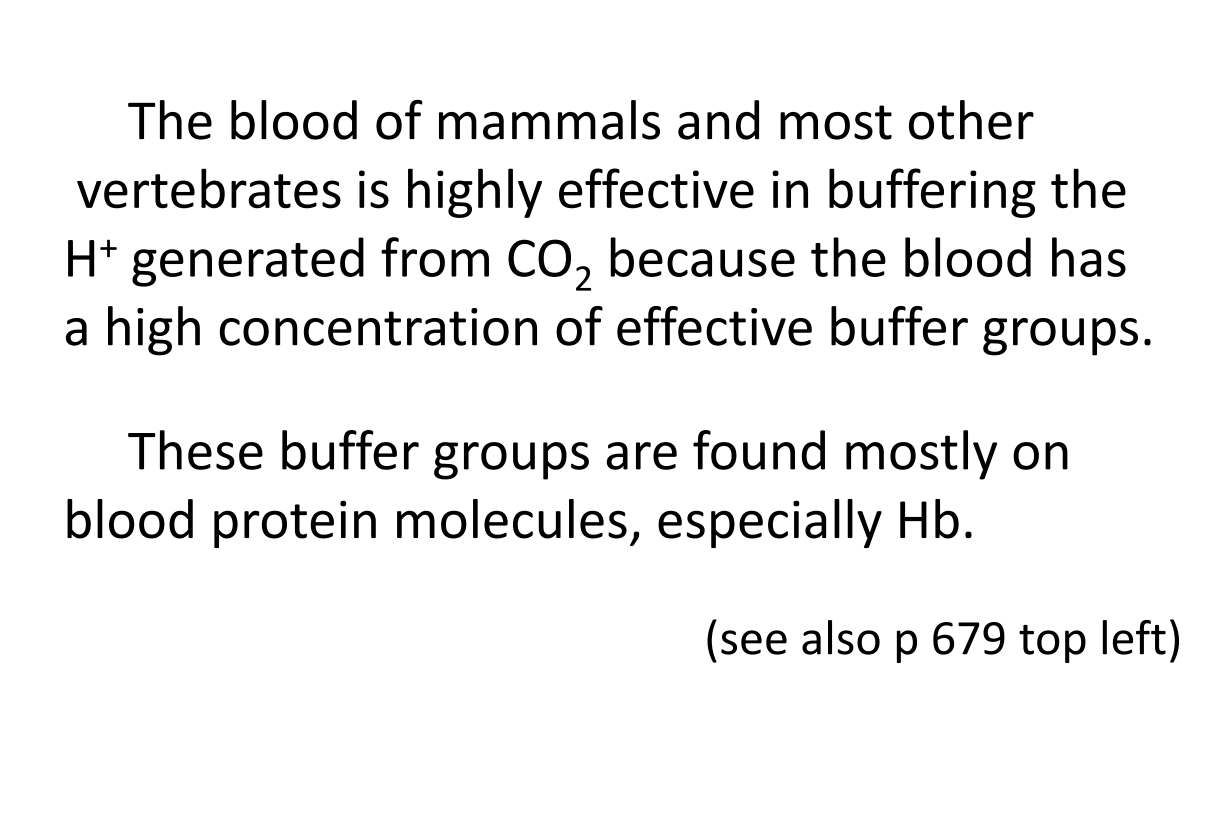
Buffers in the blood—especially those on hemoglobin—bind the H⁺ produced when CO₂ becomes bicarbonate.
This does two important things: When CO₂ enters an RBC:
CO₂+H₂O→CAH⁺+HCO₃
This creates protons (H⁺).
If this H⁺ were left free, blood pH would crash.
Buffers—mainly deoxygenated hemoglobin (Hb)—bind the H⁺:
H⁺+Hb−→HHb
This removes H⁺ from the solution, maintaining pH. 2. Removing H⁺ drives the reaction to the right → LOTS of bicarbonate is produced
This is a Le Châtelier’s principle thing:
If H⁺ is removed by buffering, the reaction keeps shifting toward:
HCO₃⁻ production ↑↑\text{HCO₃⁻ production ↑↑}HCO₃⁻ production ↑↑
This is why most CO₂ in the blood is carried NOT as dissolved gas but as bicarbonate.
Buffers allow massive bicarbonate formation
Which is essential because bicarbonate is the major form of CO₂ transport (≈70%)
Why hemoglobin is such a good buffer
Deoxygenated Hb (in tissues) strongly buffers H⁺
(This is part of the Bohr effect, which also helps unload O₂.)Oxygenated Hb (in lungs) releases H⁺
(Helping drive the reverse reaction so CO₂ can be exhaled.)
So hemoglobin buffers change their strength depending on whether O₂ is bound—very clever physiology.
text book
1. CO₂ in plain water makes almost no bicarbonate
When CO₂ dissolves in distilled water or salt solution, almost no HCO₃⁻ forms.
Why?
Because H⁺ is allowed to accumulate, which stops the reaction early.2. Blood forms LOTS of bicarbonate because it has buffers
When CO₂ enters the blood:
CO₂+H₂O→CAH⁺+HCO₃⁻\text{CO₂} + \text{H₂O} \xrightarrow{\text{CA}} \text{H⁺} + \text{HCO₃⁻}CO₂+H₂OCAH⁺+HCO₃⁻
What happens to that H⁺?
Blood buffers—mostly hemoglobin—remove almost all H⁺.
When H⁺ is removed:
[H⁺] stays low
This forces the reaction to keep moving toward producing more HCO₃⁻
Result:
Blood takes up tons of CO₂ as bicarbonate
This is the key difference between water and blood.
3. Why removing H⁺ increases bicarbonate (mass action)
Equation:
[HCO₃⁻][H⁺][CO₂]=K\frac{[\text{HCO₃⁻}] [\text{H⁺}]}{[\text{CO₂}]} = K[CO₂][HCO₃⁻][H⁺]=K
Since CO₂ (gas) is constant and K is constant:
If [H⁺] stays low, then [HCO₃⁻] must increase
If [H⁺] rises, HCO₃⁻ stays low
Thus:
Better buffering → more H⁺ removed → more HCO₃⁻ formed
4. What buffers do
A buffer pair:
HX⇌H⁺+X⁻\text{HX} \rightleftharpoons \text{H⁺} + \text{X⁻}HX⇌H⁺+X⁻
If H⁺ increases → reaction shifts left → buffers soak up H⁺
If H⁺ decreases → reaction shifts right → buffers release H⁺
Buffers keep pH stable.
They work best when pH ≈ pK′ of the buffer pair.
5. Why blood is an excellent buffer
Blood proteins—especially hemoglobin—contain many buffering groups:
Terminal amino groups
Histidine imidazole groups (most important)
These have pK′ values close to blood pH, so they are highly effective.
Human blood buffers remove >99.999% of all H⁺ produced from CO₂.
This lets:
Massive amounts of bicarbonate form
Very high CO₂-carrying capacity of blood
1. Transition from buffering → CO₂ transport curves
Now that we understand how CO₂ becomes bicarbonate (via carbonic anhydrase + buffers), the next step is to understand how CO₂ transport is represented graphically.
This is exactly like when we used oxygen equilibrium (dissociation) curves to understand O₂ loading/unloading.
For CO₂, we use CO₂ dissociation curves.
2. Purpose of CO₂ dissociation curves
CO₂ dissociation curves tell us:
How much total CO₂ is carried in the blood at different CO₂ partial pressures (PCO₂).
How CO₂ is loaded in the tissues and unloaded in the lungs.
How different forms of CO₂ (dissolved, bicarbonate, carbamino compounds) contribute to total CO₂ content.
They are to CO₂ what the oxygen equilibrium curve is to O₂.
3. How CO₂ dissociation curves are generated (experimental concept)
Your instructor emphasized:
In the lab, you can generate these curves using:
A blood sample
A gas mixing pump to control PCO₂
Instruments to measure total CO₂ content
For each PCO₂ setting, measure how much CO₂ the blood contains → plot the points.
This is exactly the same experimental logic used for O₂ curves.
4. Why the curves are useful for understanding physiological transport
They show how large amounts of CO₂ can be carried in blood because of bicarbonate formation.
They reveal how hemoglobin state (oxygenated vs. deoxygenated) affects CO₂ binding → the Haldane effect (likely coming later in the lecture).
They help explain:
Why venous blood carries more CO₂ than arterial blood.
Why CO₂ unloading in the lungs is efficient.
Because most CO₂ is transported as bicarbonate, CO₂ curves look different from O₂ curves:
They are more linear instead of sigmoidal.
They increase steeply because bicarbonate carries so much CO₂.
You don’t need this yet, but it’s coming in the next slides.
1. Set-up: CO₂ curves are measured the same way as O₂ curves
The instructor emphasizes that he spent years doing these in the lab—same general approach as O₂ equilibrium curves.
Use a gas mixing pump to set a precise PCO₂.
Measure the total CO₂ content of the blood at each PCO₂.
Plot the points → this gives the CO₂ dissociation curve.
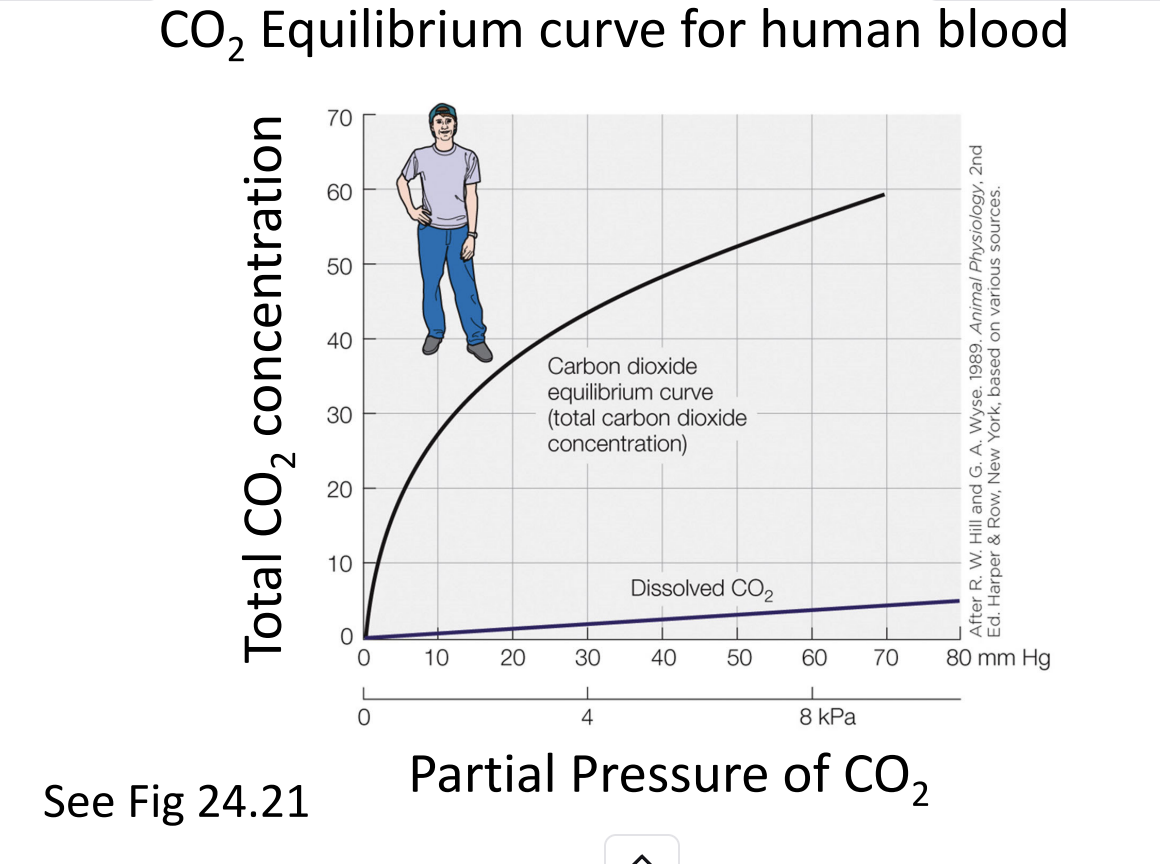
2. Axes and general appearance
The CO₂ curve has exactly the same style of axes as the O₂ curve:
x-axis = PCO₂
y-axis = total CO₂ concentration in the blood
BUT the shape is different:
O₂ curve is sigmoidal (due to cooperative binding).
CO₂ curve is smooth, nearly linear, gently curving upward.
Why?
Because most CO₂ isn’t bound to hemoglobin cooperatively—it’s converted to bicarbonate, so the relationship is more proportional.
3. What the CO₂ curve shows
As PCO₂ increases, total CO₂ content rises steadily.
The majority of CO₂ carried in blood is not dissolved gas, but bicarbonate (HCO₃⁻).
Therefore the curve is much higher than the dissolved CO₂ line.
This is visually emphasized in the graph your instructor showed.
4. The “dissolved CO₂” line
On the graph, there's a thin straight line at the bottom.
This line represents CO₂ carried simply dissolved in the blood.
This amount is:
small, predictable from Henry’s Law
only a fraction of the total CO₂ content
Everything above that line is primarily:
Bicarbonate (dominant form)
Carbamino compounds (a smaller amount attached to proteins/Hb)
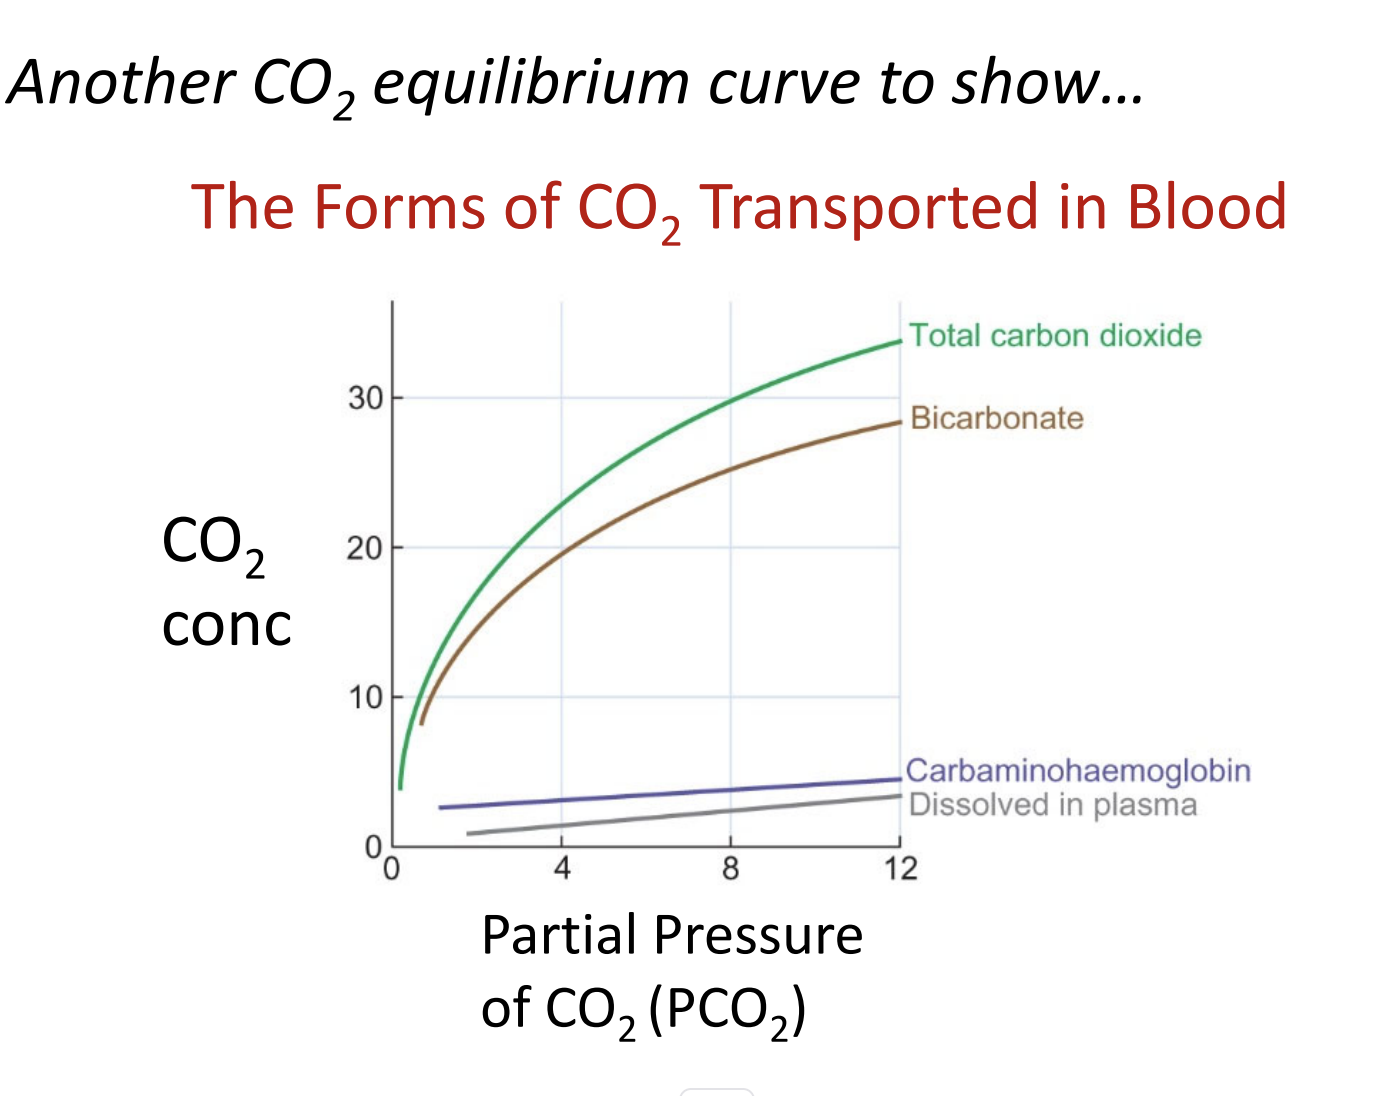
CO₂ Dissociation Data Can Be Broken Into Components
When physiologists measure CO₂ in blood (in lab experiments), they can break the total CO₂ content into its individual forms.
1. Total CO₂ (Green Curve)
The main curve plotted in CO₂ dissociation graphs.
Represents all forms of CO₂ in the blood combined.
This is what you measure experimentally.
2. Bicarbonate (HCO₃⁻) — the Dominant Form
The line just below total CO₂.
Most CO₂ in the blood is carried as bicarbonate.
This is formed by the reaction:
CO2+H2O↔HCO3−+H+CO_2 + H_2O \leftrightarrow HCO_3^- + H^+CO2+H2O↔HCO3−+H+
catalyzed by carbonic anhydrase in RBCs.
3. Minor Forms of CO₂
These are shown for context to emphasize how small they are compared to bicarbonate:
a. Dissolved CO₂
The very bottom line on the graph.
Only a small amount of CO₂ is transported simply dissolved in plasma.
Directly proportional to PCO₂ (Henry’s law).
b. Carbaminohemoglobin
The next line above dissolved CO₂.
CO₂ binds to hemoglobin (Hb–NH₂ groups).
Still a minor fraction of total CO₂.
4. Breaking It Down by Compartments (Advanced Experimental Detail)
Blood contains:
Red blood cells (RBCs)
Plasma
In detailed physiological experiments, you can determine:
How much CO₂ is in RBCs
How much is in plasma
You can even plot separate curves for RBC vs. plasma CO₂ content.
(This isn’t something you need to calculate yourself—just understand that scientists can separate these compartments when doing the full dissociation analysis.)
Haldane Effect
Definition: Deoxygenated hemoglobin (Hb not carrying O₂) binds more CO₂ than oxygenated hemoglobin.
This is the complement to the Bohr effect (O₂ unloading enhanced by CO₂ and H⁺ in tissues).
Mechanistic consequence:
When Hb releases O₂ to tissues, it can pick up more CO₂.
Part of this CO₂ binds directly to Hb as carbaminohemoglobin (CO₂ + Hb–NH₂ → Hb–CO₂).
Physiological Implication
This explains why CO₂ transport and O₂ transport are linked:
In tissues: O₂ leaves hemoglobin → CO₂ loading increases.
In lungs: O₂ binds hemoglobin → CO₂ unloading is facilitated.
Helps blood carry CO₂ efficiently from tissues to lungs while optimizing O₂ delivery.
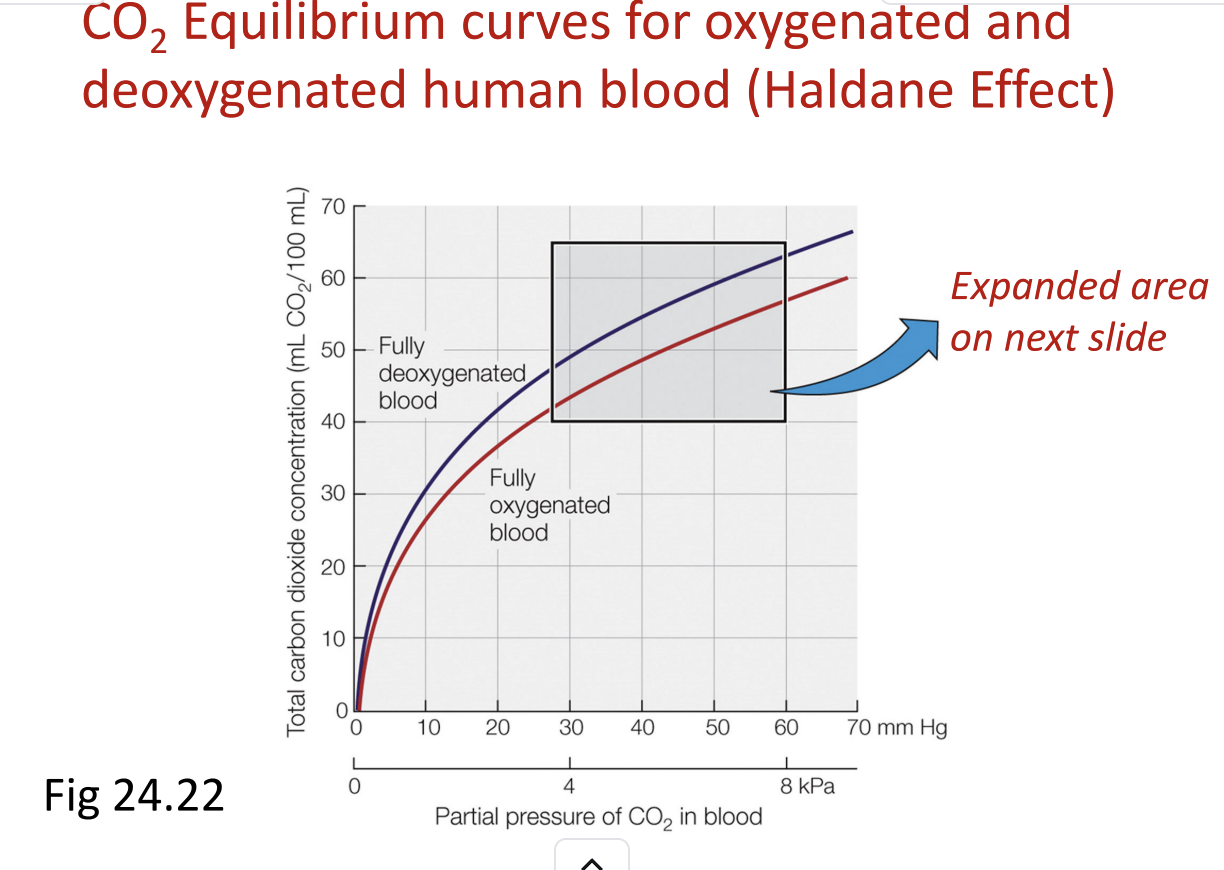
textbook
Definition
The carbon dioxide equilibrium curve of blood changes depending on how oxygenated the respiratory pigment (hemoglobin) is.
Haldane effect:
Deoxygenation of hemoglobin → promotes CO₂ uptake by blood
Oxygenation of hemoglobin → promotes CO₂ release from blood
Mechanism
Hemoglobin (and other respiratory pigments) acts as a major blood buffer.
Deoxygenated hemoglobin binds more H⁺ ions → lowers free H⁺ in blood.
According to the bicarbonate reaction:
CO2+H2O↔H++HCO3−CO_2 + H_2O
Lower [H⁺] favors more bicarbonate formation → increases total CO₂ carried.
This is essentially the reverse of the Bohr effect (Bohr: H⁺ and CO₂ promote O₂ unloading).
Physiological Significance
In tissues:
O₂ leaves hemoglobin → CO₂ uptake is enhanced → efficient CO₂ removal.
In lungs:
O₂ binds hemoglobin → CO₂ release is enhanced → efficient CO₂ exhalation.
Result: Blood carries more CO₂ overall between tissues and lungs than it could without the Haldane effect.
Hemoglobin simultaneously facilitates O₂ delivery and CO₂ removal.
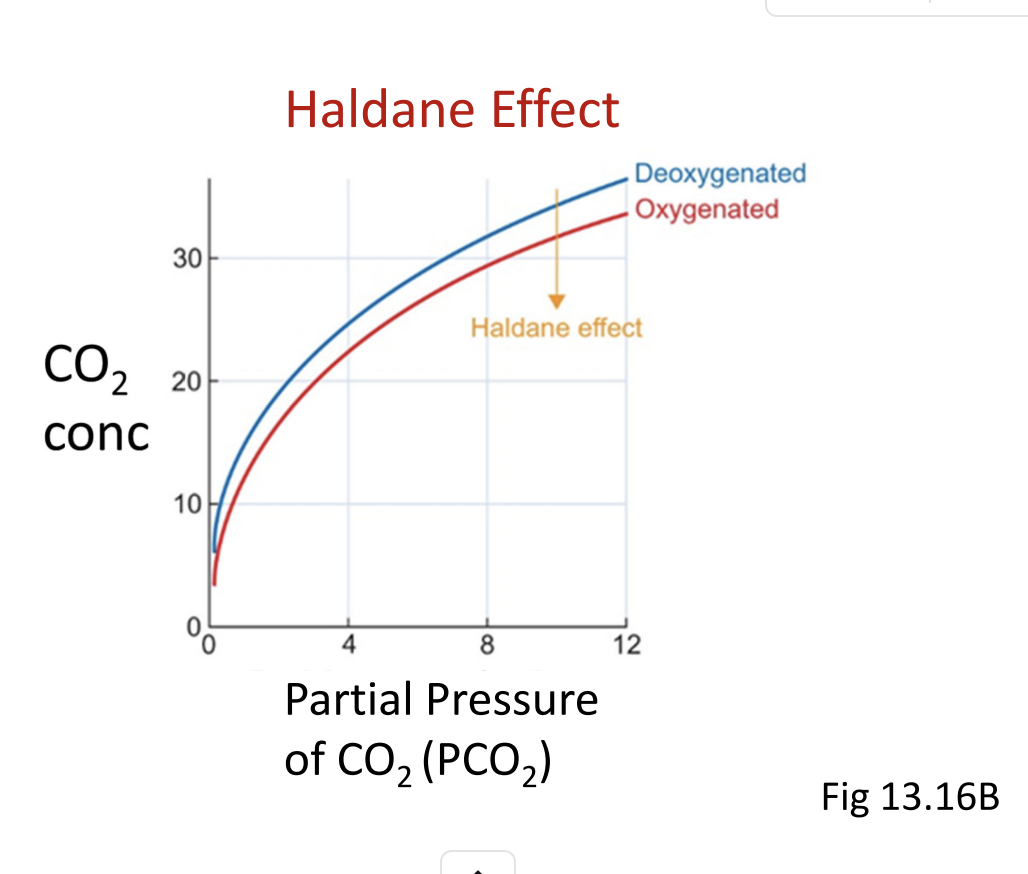
CO₂ Dissociation Curves
Red curve → fully oxygenated blood
Other curve → deoxygenated blood
Observation: At any given CO₂ partial pressure, deoxygenated blood carries more CO₂ than oxygenated blood.
Reason
Oxygenation decreases hemoglobin’s ability to carry CO₂:
When hemoglobin is oxygenated → less CO₂ binds to hemoglobin (less carbaminohemoglobin).
When hemoglobin is deoxygenated → more CO₂ binds (higher total CO₂ content).
Functional Takeaway
Haldane effect: Deoxygenation promotes CO₂ uptake in tissues; oxygenation promotes CO₂ release in lungs.
Explains why CO₂ transport and O₂ transport are interlinked: hemoglobin simultaneously facilitates both gases depending on its oxygenation state.
Purpose of Box A: Highlights the difference in CO₂ carrying capacity between oxygenated and deoxygenated blood.
Oxygenated blood: Lower total CO₂ at a given CO₂ partial pressure.
Deoxygenated blood: Higher total CO₂ at the same CO₂ partial pressure → hemoglobin can take up more CO₂.
Key Concept: Hemoglobin’s state of oxygenation changes its buffering capacity, which in turn alters bicarbonate formation and CO₂ transport.
Functional significance:
In systemic tissues: hemoglobin releases O₂ → takes up more CO₂ (deoxygenation promotes CO₂ uptake).
In lungs: hemoglobin binds O₂ → releases CO₂ for exhalation.
text book
Two CO₂ equilibrium curves:
Fully oxygenated blood → lower total CO₂ at a given CO₂ partial pressure
Deoxygenated blood → higher total CO₂ at the same CO₂ partial pressure
Illustrates the Haldane effect: Deoxygenation promotes CO₂ uptake; oxygenation promotes CO₂ release.
Parameter | Arterial Blood (A) | Mixed Venous Blood (V) |
|---|---|---|
O₂ Saturation | ~100% | ~70% |
CO₂ Partial Pressure | 5.3 kPa (40 mm Hg) | 6.1 kPa (46 mm Hg) |
CO₂ Content | Lower | Higher |
Functional Implication
Arrows between A and V in the graph show how total CO₂ concentration changes as blood circulates.
As blood moves from tissues to lungs:
O₂ binds hemoglobin → CO₂ is released → exhaled.
CO₂ is taken up in tissues as hemoglobin deoxygenates.
This dynamic enhances CO₂ transport beyond what static curves predict.
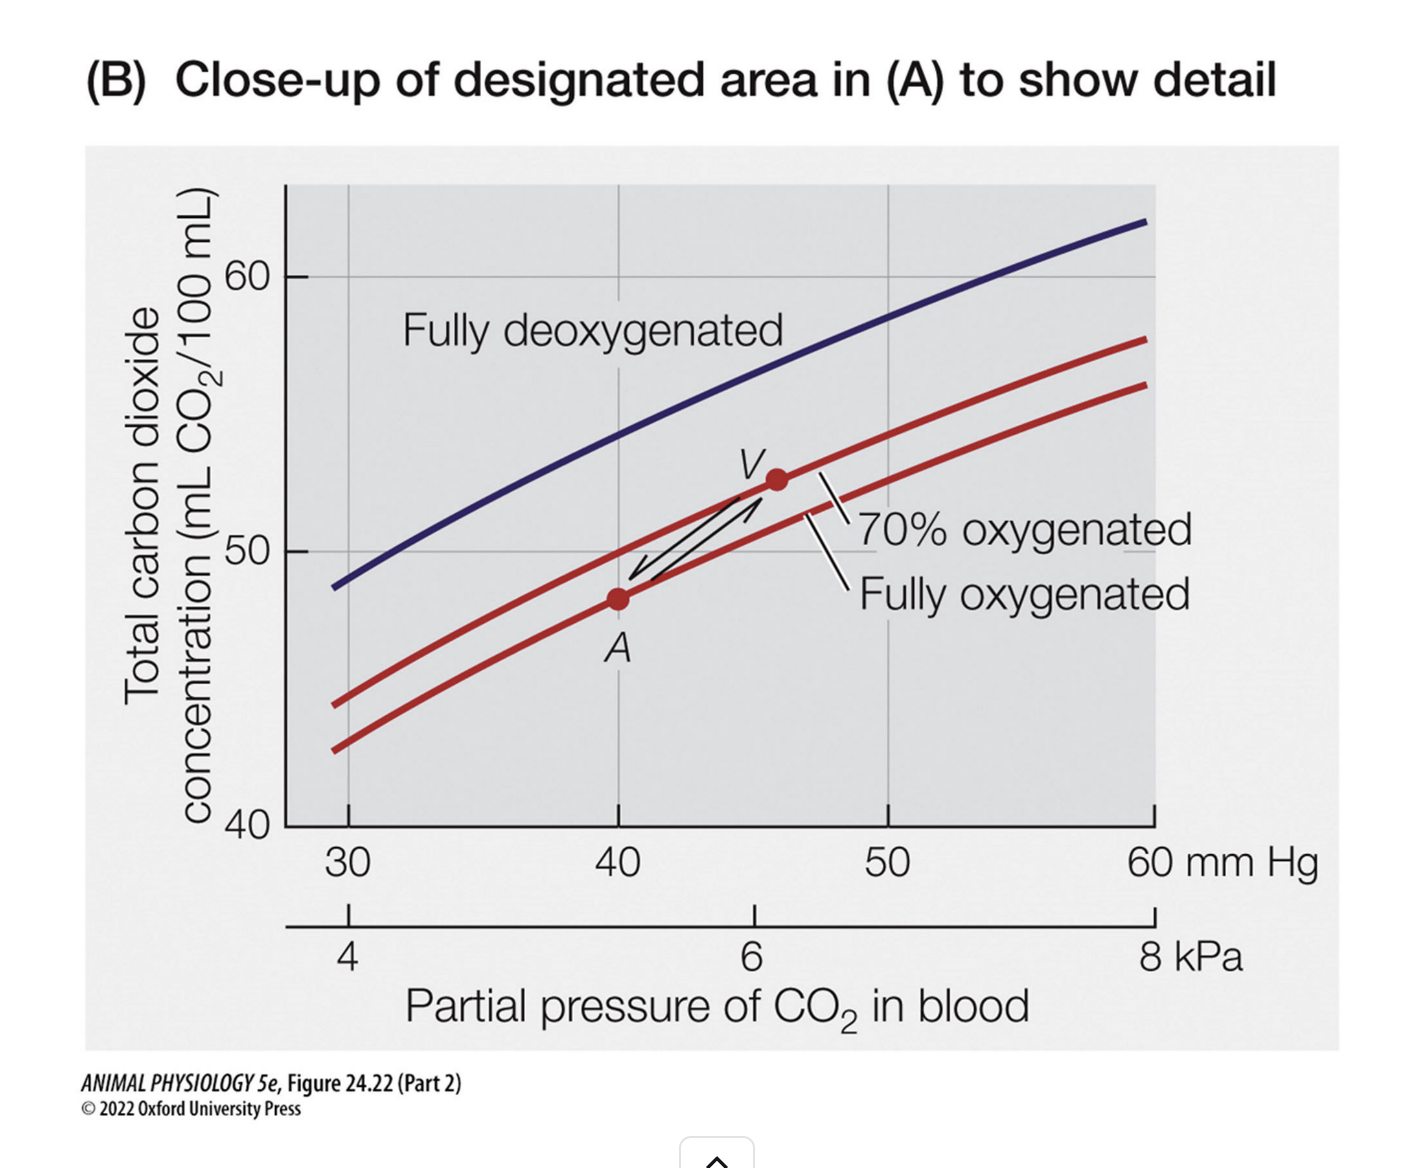
CO₂ Transport Points – Arterial vs. Venous Blood (Rest & Exercise)
1. Arterial blood (Point A):
CO₂ partial pressure (PCO2_{CO₂}CO2): ~40 mm Hg
Total CO₂ concentration: Lower (less CO₂ carried)
State of hemoglobin: Fully oxygenated
2. Venous blood (Point V):
PCO2_{CO₂}CO2: Higher (~46 mm Hg in humans at rest)
Total CO₂ concentration: Higher (more CO₂ carried)
State of hemoglobin: Partially deoxygenated → Haldane effect applies → increased CO₂ uptake
3. Circulation context:
CO₂ is added to the blood in systemic tissues as O₂ is delivered → venous blood is less oxygenated and carries more CO₂.
The line connecting arterial to venous points shows functional CO₂ transport during circulation.
4. Exercise implications:
Increased tissue metabolism → higher CO₂ production and lower O₂ saturation in venous blood.
Difference between arterial and venous CO₂ content increases, enhancing CO₂ transport to the lungs.
5. Key concept:
Just like the oxygen dissociation curve, the CO₂ curve can be used to predict how much CO₂ is loaded and unloaded during circulation.
The Haldane effect amplifies CO₂ transport, particularly when hemoglobin is deoxygenated.
CO₂ Transport Overview – Simplified
1. Purpose of simplification:
The textbook section is long and detailed.
The lecture focuses on essential steps and simplifies the process for better understanding.
The goal: see CO₂ transport at tissues and at gas exchange surfaces (lungs or gills).
2. Approach:
Stepwise understanding:
Look at CO₂ transport at tissues first.
Then look at CO₂ transport at lungs/gills.
Both steps use the same underlying processes, just in reverse.
CO₂ transport is directional:
From tissues → blood (loading)
From blood → lungs/gills (unloading)
Simplified diagrams can clarify the movement without contradictions to the textbook.
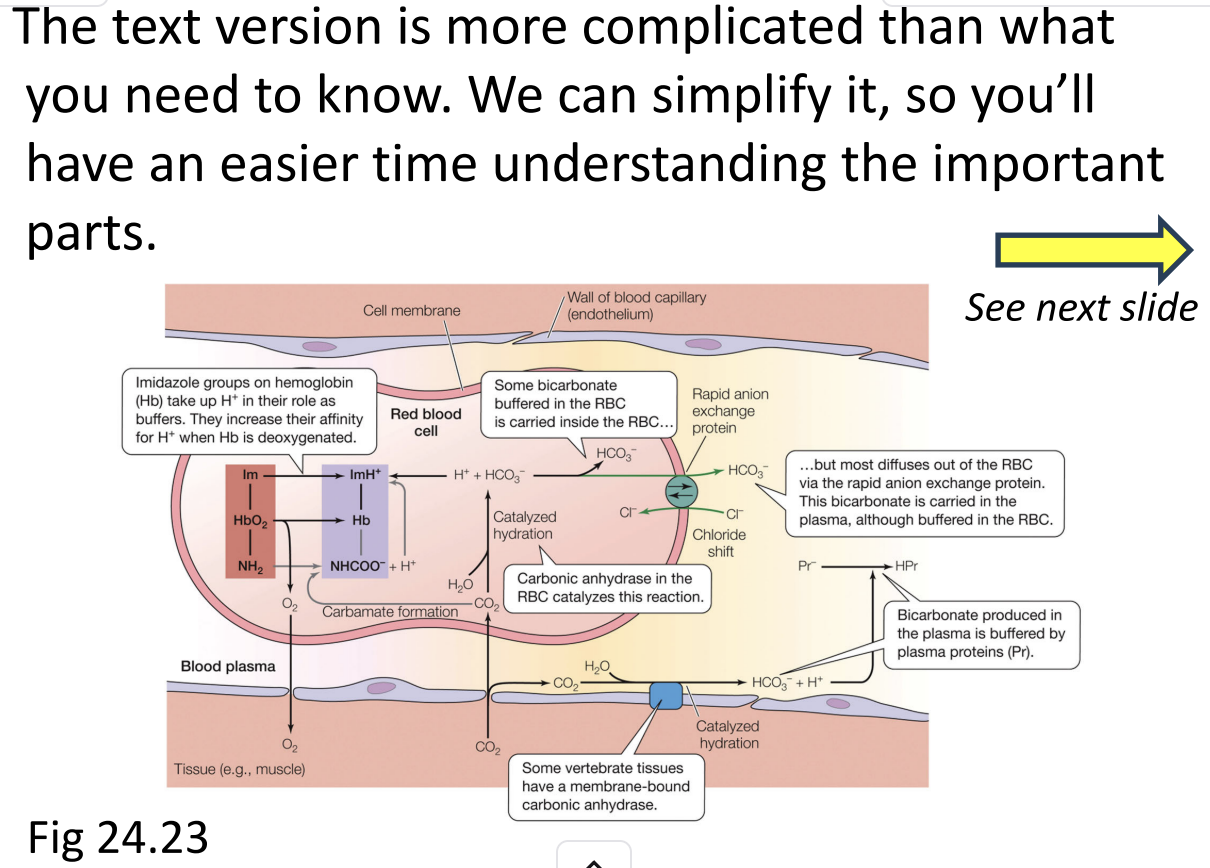
CO₂ Transport Diagrams – Simplifying Figure 24.23
1. Purpose of simplification:
The textbook figure is more complicated than necessary for basic understanding.
Some elements (reactions inside RBCs, plasma) are kept, some are removed to focus on essentials.
Goal: see CO₂ transport clearly at both tissues and lungs/gills.
2. Approach to simplification:
Highlight key reactions:
CO₂ → bicarbonate (HCO₃⁻) in RBCs
CO₂ binding to hemoglobin (carbaminohemoglobin)
Dissolved CO₂ in plasma
Remove overly complex or minor pathways that are not critical at this level.
3. Using multiple figures:
The professor uses:
Edited textbook figure → shows essentials while staying consistent with the text.
Professor’s figure → simplified further, visually easier to follow.
Both figures are consistent; they just show the same processes at different levels of detail.
The simplification helps focus on what happens at tissues and at gas exchange surfaces.
You should be able to trace CO₂ from tissues to lungs/gills using the simplified diagrams.
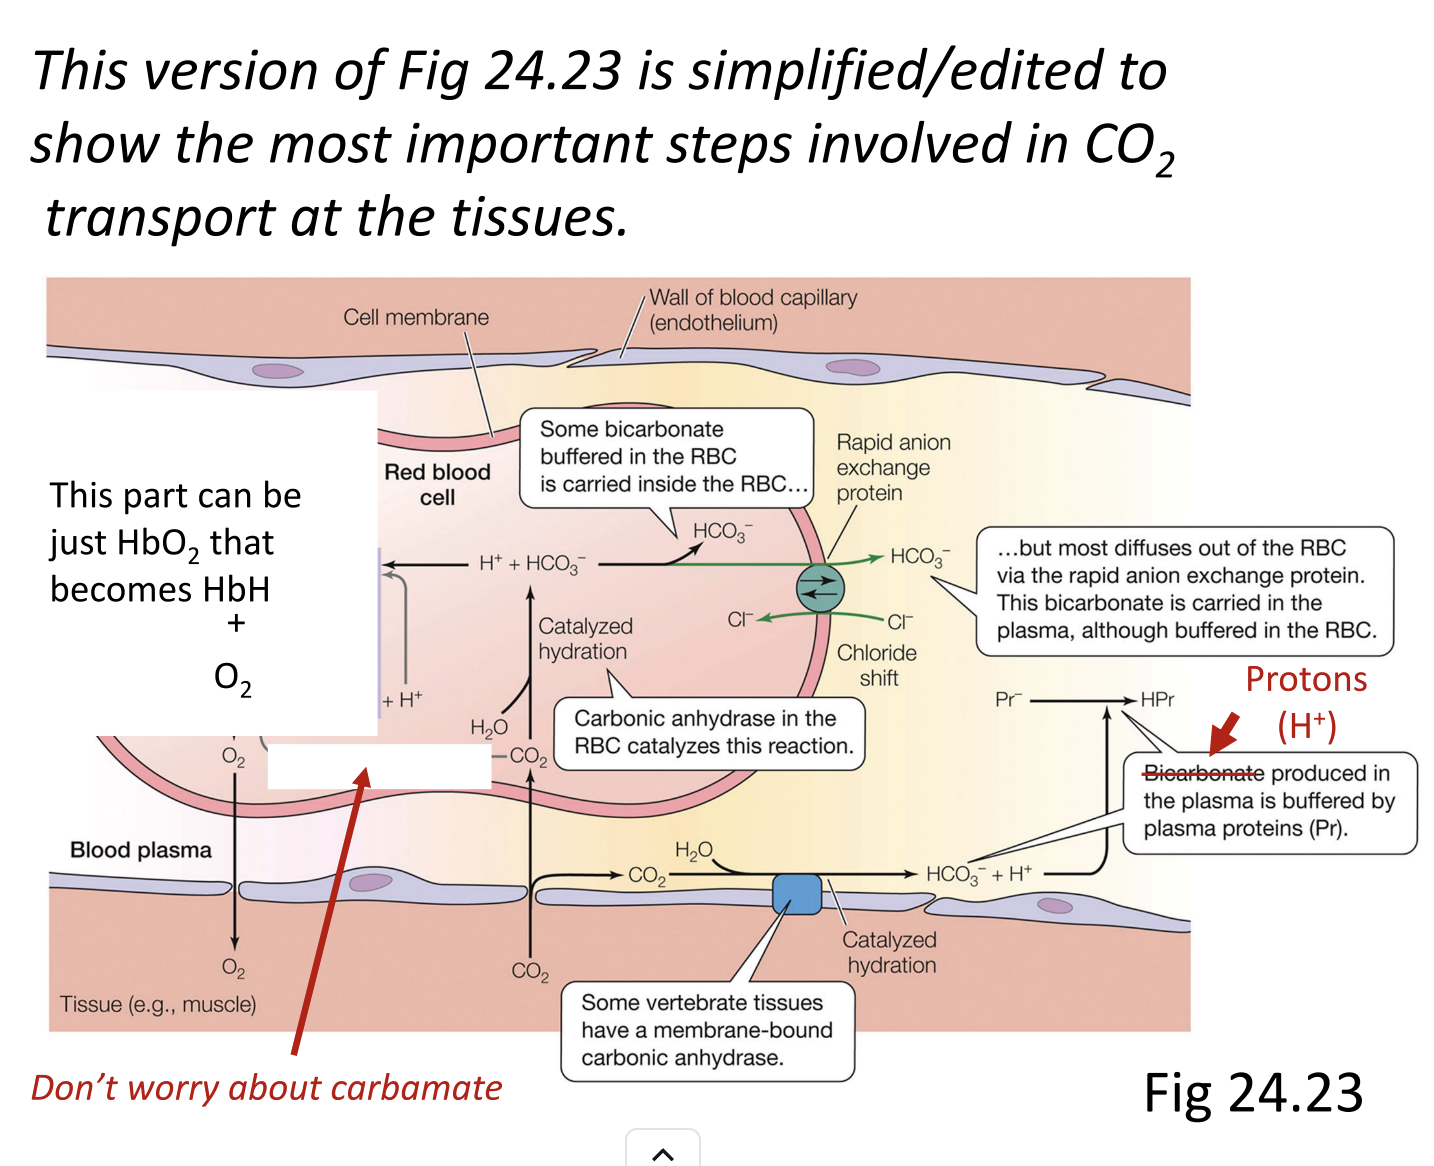
Simplified CO₂ Transport Figure Notes
1. Purpose of the simplified/additive version:
Textbook figure shows too much detail for this level.
Professor simplified to focus on key CO₂ transport mechanisms.
2. Simplifications made:
Hemoglobin buffering:
Removed detailed groups on hemoglobin.
Only note: hemoglobin can bind protons or oxygen.
Carbonate reactions:
Removed entirely; not needed at this level.
Plasma buffering:
Fixed figure to show proteins buffer protons, not just plasma without proteins.
Other minor errors: corrected inconsistencies in the original figure.
Focus on major CO₂ forms in blood:
Bicarbonate (HCO₃⁻)
Carbaminohemoglobin (HbCO₂)
Dissolved CO₂
The simplified figure highlights CO₂ uptake at tissues and release at lungs/gills without unnecessary details.

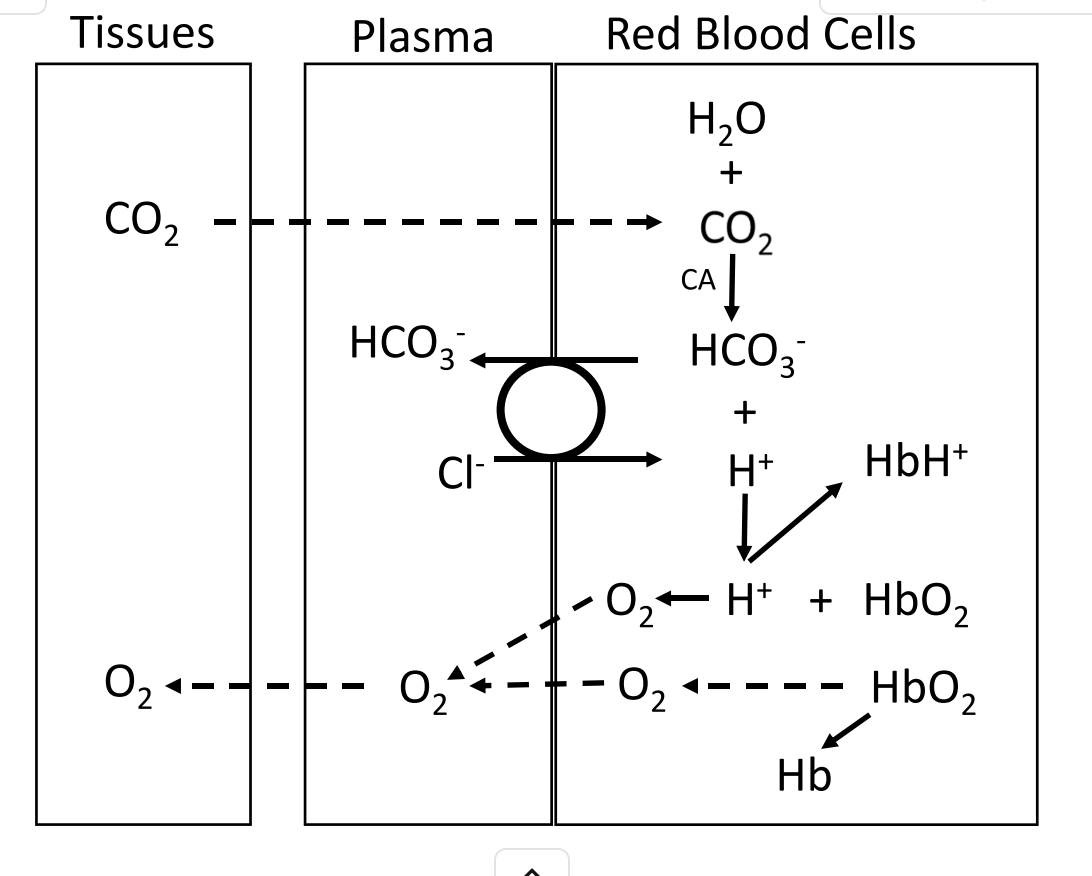
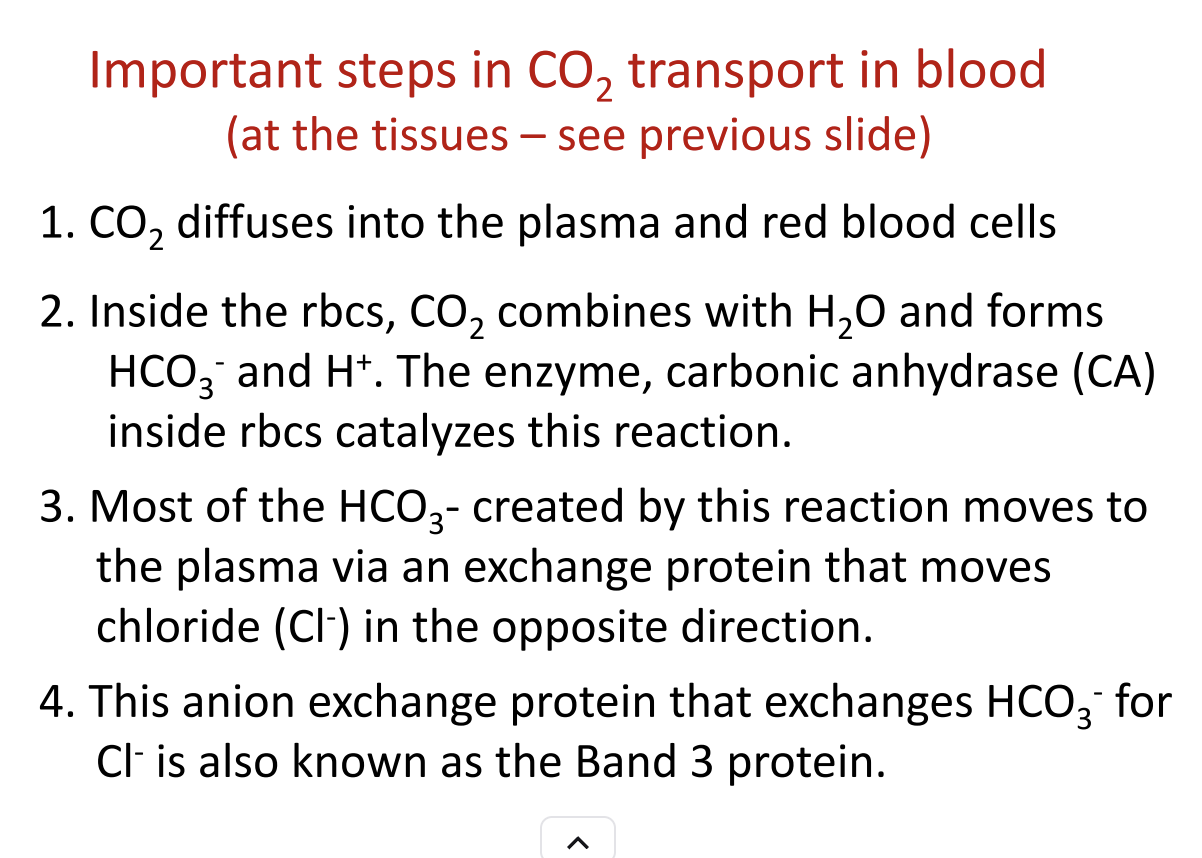
CO₂ Transport at the Tissues (Simplified)
Step 1: CO₂ Diffuses into Blood
CO₂ leaves tissues and enters plasma and red blood cells (RBCs).
Step 2: Formation of Bicarbonate
Inside RBCs: CO₂ + H₂O ⇌ H₂CO₃ ⇌ H⁺ + HCO₃⁻
Catalyzed by carbonic anhydrase → reaction is fast.
Most HCO₃⁻ leaves RBCs and enters plasma.
Step 3: Chloride-Bicarbonate Exchange
Cl⁻ enters RBC as HCO₃⁻ exits → maintains electrical balance.
Also called anion exchanger in textbooks.
Step 4: Proton Buffering by Hemoglobin
Hemoglobin binds some H⁺ → prevents pH from dropping too much.
Hemoglobin that is still carrying O₂ releases it more easily in acidic tissue → Bohr effect.
Step 5: Oxygen Unloading
Oxygen from hemoglobin diffuses into tissue.
H⁺ from CO₂ reaction is buffered by hemoglobin → facilitates more O₂ release.
Step 6: Integrated Effects
Haldane effect: Deoxygenated hemoglobin binds CO₂ more readily → promotes CO₂ uptake.
CO₂ loading, bicarbonate formation, proton buffering, and oxygen unloading are all linked.

At the gas exchange surface (lungs or gills):
Bicarbonate re-enters RBCs via the chloride-bicarbonate exchanger (Cl⁻ leaves, HCO₃⁻ enters).
Carbonic anhydrase converts HCO₃⁻ + H⁺ → CO₂ + H₂O.
CO₂ diffuses out of the blood into the lungs or water across the gill membrane.
Oxygen binds hemoglobin, displacing H⁺ (reverse Bohr effect).
Hemoglobin becomes oxygenated, reducing its ability to bind CO₂ (reverse Haldane effect).
So, the same reactions and players (bicarbonate, H⁺, hemoglobin, carbonic anhydrase, Cl⁻ exchange) are involved, just running in reverse to unload CO₂ and load O₂.
In short: tissues → CO₂ loading; lungs/gills → CO₂ unloading and O₂ loading, using the same mechanisms but flipped.
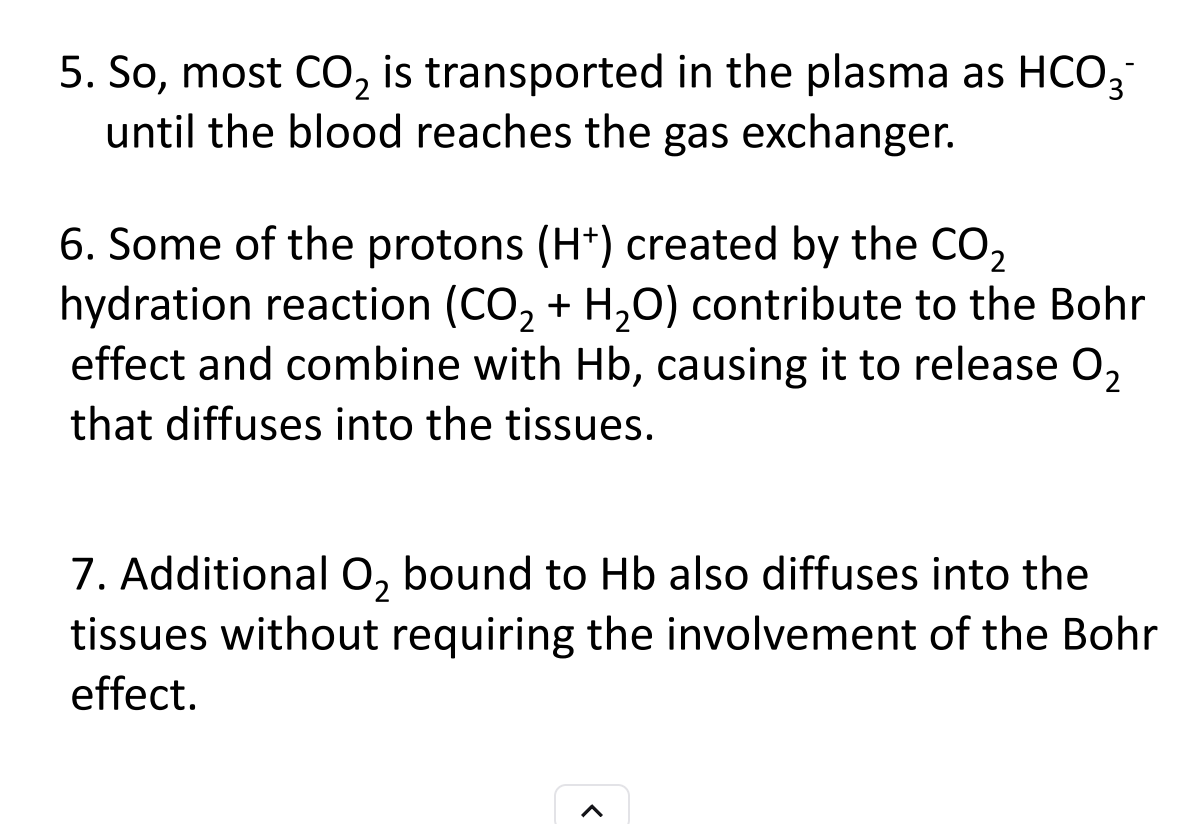
CO₂ Unloading and O₂ Loading at the Gas Exchange Surface
CO₂ diffusion: Some CO₂ already in the plasma diffuses down its concentration gradient into the water (or air in lungs).
Bicarbonate re-entry: Most CO₂ is carried as bicarbonate in plasma. It enters red blood cells via the chloride-bicarbonate exchanger (Cl⁻ moves out, HCO₃⁻ moves in).
Conversion to CO₂: Inside the RBC, carbonic anhydrase catalyzes:
HCO₃⁻ + H⁺ → CO₂ + H₂O\text{HCO₃⁻ + H⁺ → CO₂ + H₂O}HCO₃⁻ + H⁺ → CO₂ + H₂O
Protons come from hemoglobin that is binding oxygen.
CO₂ diffusion: Newly formed CO₂ diffuses out of the RBC and blood into the environment (water or alveolar air).
O₂ loading: Oxygen from the environment binds to hemoglobin in the RBC.
Proton removal: Oxygenation of hemoglobin releases H⁺ (reverse Bohr effect), which helps drive the HCO₃⁻ → CO₂ reaction.

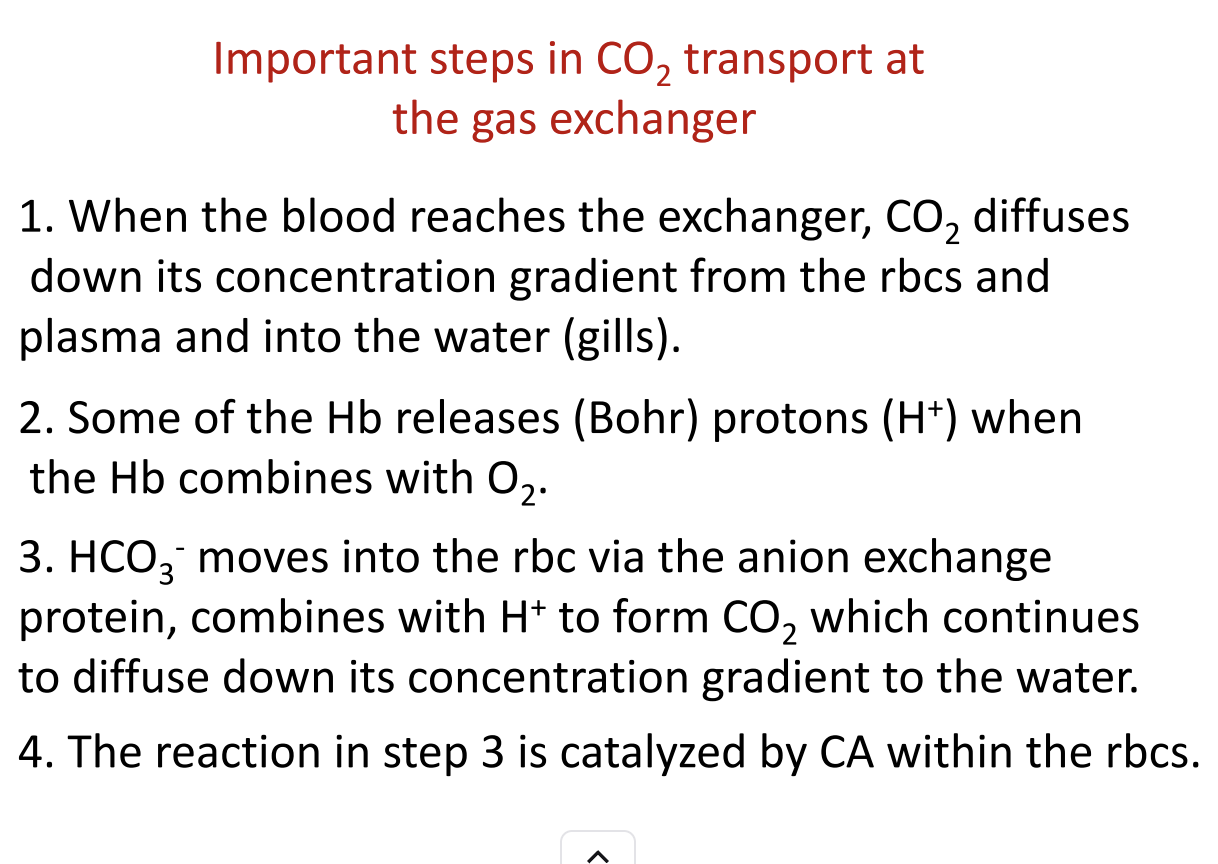
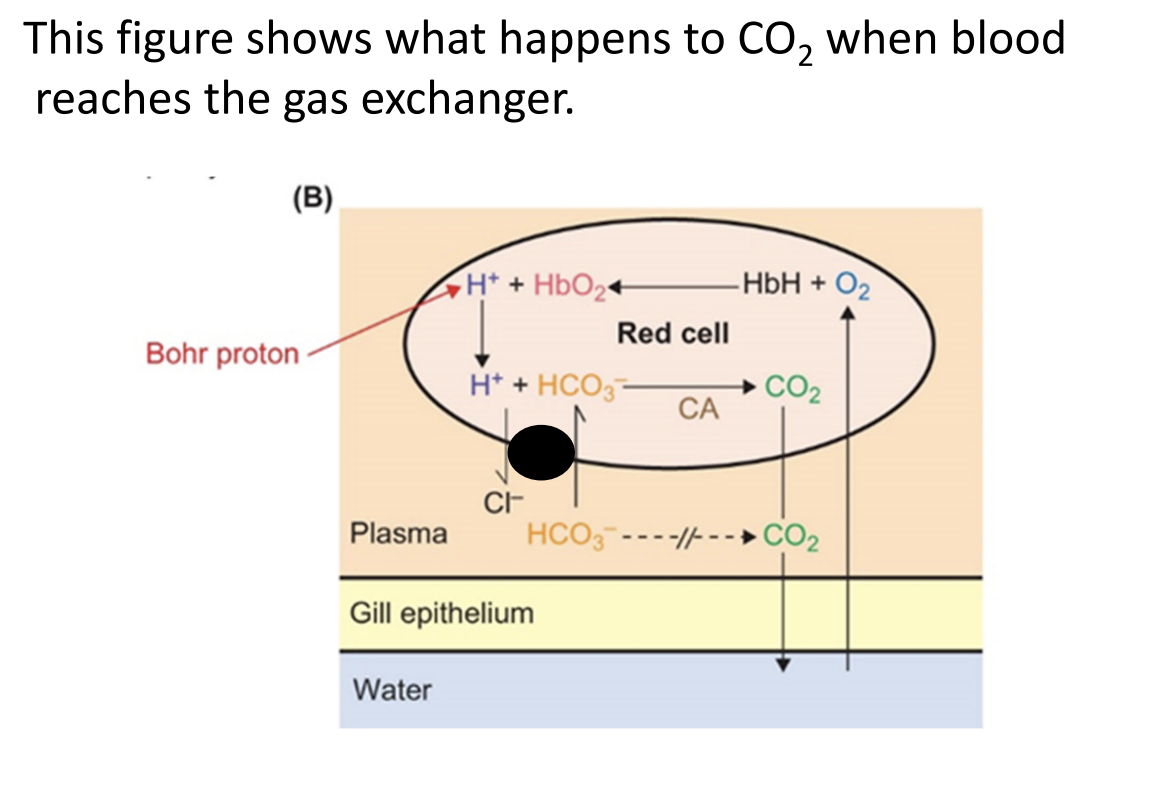
CO₂ Transport at the Gas Exchange Surface (Lungs or Gills)
Arrival at the gas exchanger
Blood reaches lungs/gills, carrying CO₂ mostly as bicarbonate in plasma and some as dissolved CO₂ or carbaminohemoglobin.
CO₂ diffusion begins
CO₂ diffuses down its concentration gradient from plasma into the environment (water or air).
Bicarbonate transport into RBCs
Chloride-bicarbonate exchanger (anion exchanger) allows HCO₃⁻ to enter RBCs while Cl⁻ moves out.
Conversion to CO₂
Inside RBCs, carbonic anhydrase catalyzes:
HCO₃⁻ + H⁺ → CO₂ + H₂O\text{HCO₃⁻ + H⁺ → CO₂ + H₂O}HCO₃⁻ + H⁺ → CO₂ + H₂O
H⁺ comes from hemoglobin that is binding O₂ (proton released during oxygenation).
CO₂ diffusion completes
CO₂ formed in RBCs diffuses out into the environment.
Oxygen loading
O₂ diffuses into blood and binds to hemoglobin, displacing protons (reverse Bohr effect).
Proton removal aids CO₂ release
H⁺ released by hemoglobin binds with HCO₃⁻ to form more CO₂ → drives further CO₂ diffusion.

Fetal Oxygen Transport and Hemoglobin
Fetal Blood and Oxygen Supply
The fetus relies on the placenta for oxygen (O₂) uptake and carbon dioxide (CO₂) removal.
Fetal blood travels through the umbilical cord to the placenta, picks up O₂ from maternal blood, and returns oxygenated to the fetus.
Fetal Hemoglobin Development
By 10 weeks, fetal blood already contains hemoglobin-rich red blood cells.
Hemoglobin concentration rises rapidly:
~50% of adult levels at 10 weeks
~80% at 20 weeks
O₂ Transfer in the Placenta
O₂ crosses maternal-fetal blood barriers via diffusion.
Possible gas-exchange modes: countercurrent, cross-current, or cocurrent.
Human placental O₂ transfer is less efficient than lung gas exchange due to thicker tissue and lower flow rates.
Fetal Hemoglobin Properties
Fetal hemoglobin (HbF) has higher O₂ affinity than adult hemoglobin (HbA).
This allows O₂ to:
Preferentially bind to fetal hemoglobin over maternal hemoglobin
Be effectively loaded even at low fetal blood O₂ partial pressures
Respiratory Pigments
Hemoglobins are metalloproteins that reversibly bind O₂.
Functions of hemoglobins:
Increase blood O₂-carrying capacity (~50× increase over dissolved O₂ alone)
Buffer blood pH
Participate in CO₂ transport
Facilitate intracellular O₂ diffusion in muscle and neurons
Potentially regulate mitochondrial respiration via nitric oxide (NO)
Hemoglobin Variants
Multiple molecular forms exist: fetal vs. adult, within and between species.
They all derive from a single ancient globin gene family, diversified through evolution.
Oxygenation Terminology
Oxygenated = O₂ bound to hemoglobin
Deoxygenated = O₂ released from hemoglobin
Not the same as oxidation/reduction: full oxidation of hemoglobin iron forms methemoglobin, which cannot bind O₂
Research Advances
Modern tools like molecular sequencing and genomics are revealing new hemoglobin types and functions
Respiratory Pigments Overview
Oxygenation States
Oxyhemoglobin: hemoglobin bound to O₂ (oxygenated)
Deoxyhemoglobin: hemoglobin not bound to O₂ (deoxygenated)
Color change occurs with oxygenation:
Oxyhemoglobin: bright red
Deoxyhemoglobin: purple-red
Pulse oximeters use light absorption to monitor arterial O₂ saturation.
Types of Respiratory Pigments
Hemoglobins (most widespread)
Hemocyanins
Hemerythrins
Chlorocruorins
All respiratory pigments are groups of related compounds, not single molecules.
Chemical Properties
Similar to enzymes in specificity and binding mechanisms, but they are not enzymes.
Hemoglobin binds O₂ at defined sites, using noncovalent interactions. O₂ acts as a ligand.
Binding induces conformational changes in hemoglobin, critical for function.
Affinity for O₂ determines how readily hemoglobin binds oxygen.
Allosteric Regulation
Hemoglobin has sites for allosteric ligands (H⁺, CO₂).
Binding of these ligands modifies O₂ affinity by changing the hemoglobin’s conformation.
Allosteric effects are transmitted at a distance, not directly at the O₂ binding site.
Absorption Spectra
Different wavelengths of light are absorbed depending on oxygenation.
Used in pulse oximetry to quantify O₂ saturation in blood.
Hemoglobin Structure
Multisubunit Proteins
Most hemoglobins are tetramers: 4 subunits, each with one O₂ binding site → total of 4 O₂ per molecule.
Exhibits cooperativity: binding of one O₂ affects binding at other sites (homotropic allosteric effect).
Composition
Each subunit contains:
Heme: ferrous iron complexed with protoporphyrin IX (O₂ binds here)
Globin protein: α- or β-globin in adult hemoglobin
Adult human hemoglobin: 2 α-globin + 2 β-globin, ~64,000–68,000 Da.
Functional Significance
Small changes in globin amino acids can greatly affect function (O₂ affinity, solubility, stability).
Vertebrate blood hemoglobins almost always tetrameric; some invertebrates have larger complexes.
Relationship to Other Respiratory Pigments
Many principles (binding, cooperativity, allosteric regulation) apply across hemocyanins, hemerythrins, chlorocruorins.
Unlike enzymes, respiratory pigments release the same molecule they bind, not modify it.
1. Hemoglobins Beyond Blood
Some animals have hemoglobins in muscle cells (myoglobins) or other tissues like neurons/glial cells, not just in blood.
Myoglobin:
Monomeric (single-unit) protein.
Found in the cytoplasm of muscle fibers, especially cardiac muscle and slow oxidative skeletal muscle fibers.
Gives red color to muscles (“red muscle”).
Structure differs from α- or β-globins of adult blood hemoglobin.
2. Temporal and Developmental Variation
Fetal hemoglobin (HbF) differs from adult hemoglobin:
Human fetal hemoglobin = 2 α-globin + 2 γ-globin.
Adults = 2 α-globin + 2 β-globin.
Earlier embryonic stages have α + ε or ζ globins.
Multiple hemoglobin forms can exist in adults of some species, particularly poikilothermic vertebrates and invertebrates:
Example: Sucker fish (Catostomus clarkii) has 80% one type, 20% another.
Multiple forms allow oxygen transport over broader environmental conditions.
3. Distribution of Hemoglobins
Hemoglobins are widespread, found in at least 9 animal phyla, some protists, and some plants.
Vertebrates: always in blood, contained in red blood cells (erythrocytes).
Invertebrates: distribution is sporadic; hemoglobins can be:
Intracellular: inside cells, typically low molecular weight (14–70 kDa), monomers, dimers, tetramers.
Extracellular: dissolved in plasma or coelomic fluid, often very large polymeric molecules (0.2–12 MDa), e.g., earthworm hemoglobin with 144 O₂-binding sites.
Some invertebrates can change hemoglobin levels depending on oxygen availability, e.g., Daphnia becomes red in O₂-poor water.
4. Hemocyanins
Found in arthropods and molluscs.
Copper-based, no heme, no iron, no porphyrin.
Each O₂-binding site has 2 Cu atoms → 1 O₂ molecule per 2 Cu.
Dissolved in blood plasma, not in cells.
Large molecules: 0.5–9 MDa, many O₂-binding sites (up to 160 per molecule).
Colorless when deoxygenated, bright blue when oxygenated → blue blood in some species.
5. Hemoglobins in Solid Tissues (Invertebrates)
Found in muscles and nerves (neurons or glial cells) in many molluscs and annelids.
Impart pink or red coloration to tissues.
In some insects, hemoglobins in fat body or tracheal system store O₂ for later use, e.g., diving backswimmers.
1. Red Blood Cells (Erythrocytes)
Size and shape:
Mammals: small, ~4–10 μm (humans ~7.4 μm).
Amphibians (frogs/toads): larger, oval, ~23 × 14 μm.
Nucleus and organelles:
Mammalian RBCs: anucleate, lack mitochondria and ribosomes → unique among vertebrates.
Other vertebrates and invertebrates: RBCs/nucleated, contain respiratory pigments.
Hematocrit: % of blood volume occupied by RBCs.
Humans: ~42–45% at sea level.
2. Erythropoiesis (RBC Production)
Process: formation of new RBCs to replace those with limited lifespan.
Mammalian RBC lifespan: ~4 months.
Production rate: ~2 million RBCs/sec (~1% turnover per day).
Location: Bone marrow (soft interior of bones).
Control:
Hormone erythropoietin (EPO) from kidneys.
Stimulated by hypoxia (low O₂ levels).
Mechanism:
Hypoxia activates HIF-1 (hypoxia-inducible factor 1).
HIF-1 increases transcription of EPO gene in kidney interstitial cells.
EPO enters blood → stimulates RBC production in bone marrow.
HIF-1 also helps increase iron delivery to support erythropoiesis.
3. Respiratory Pigments Recap
Hemoglobins:
Most common, widespread respiratory pigment (~9 animal phyla, all vertebrates).
Adult vertebrate hemoglobin: tetramer → 2 α-globin + 2 β-globin subunits, located in RBCs.
Invertebrates: sometimes in blood cells, sometimes dissolved in plasma.
Hemocyanins:
Copper-based, bright blue when oxygenated.
Two evolutionary types: arthropod vs. mollusc hemocyanins.
Always dissolved in plasma.
Chlorocruorins:
Hemoglobin-like, in 4 marine annelid families, dissolved in plasma.
Hemerythrins:
Non-heme iron-containing pigments, limited distribution (~3–4 invertebrate phyla).
4. Oxygen-Binding and Oxygen Equilibrium Curves
Blood contains huge numbers of O₂-binding sites (e.g., human blood ~5.4 × 10²⁰ heme groups per 100 mL).
Stoichiometry:
One O₂ molecule binds per heme group (hemoglobin) or per pair of Cu atoms (hemocyanin).
Saturation:
Fraction of O₂-binding sites occupied depends on O₂ partial pressure (pO₂).
100% saturation = all sites oxygenated.
Oxygen equilibrium curve (dissociation curve):
Plots % saturation vs. pO₂ (or total O₂ per unit volume vs. pO₂).
Plateaus at high pO₂ → hemoglobin remains nearly fully saturated over a range of pO₂.
Human blood oxygen-carrying capacity: ~20 mL O₂ per 100 mL blood (~20 vol %).
. Two Presentations of the Oxygen Equilibrium Curve
Figure 24.4A: plots % saturation of binding sites vs. O₂ partial pressure (pO₂).
Figure 24.4B: plots blood O₂ concentration (mL O₂/100 mL blood) vs. pO₂.
Conversion:
\text{O₂ concentration} = \text{O₂-carrying capacity} \times \text{% saturation of binding sites}
Blood O₂ exists in two forms:
Bound to hemoglobin
Dissolved in plasma (small fraction, proportional to pO₂).
2. Oxygen Uptake in the Lungs
Alveolar pO₂ ≈ 13.3 kPa (100 mm Hg).
Mixed venous blood arriving at lungs has lower pO₂ → O₂ diffuses into blood.
Hemoglobin becomes virtually saturated at ~12–12.7 kPa (90–95 mm Hg) in resting humans.
Plateau of the oxygen equilibrium curve: ensures nearly full saturation even if alveolar pO₂ varies slightly.
Evolutionary adaptation: hemoglobin saturation matches alveolar pO₂.
3. Oxygen Delivery to Systemic Tissues
Mitochondria consume O₂ → lowers tissue pO₂ → O₂ diffuses from blood.
Hemoglobin releases O₂ as pO₂ falls → available to mitochondria.
Mixed venous blood:
Represents a weighted average of O₂ partial pressures from all tissues.
Resting human mixed venous pO₂ ≈ 5.3 kPa (40 mm Hg).
Blood O₂ drops from ~20 mL/100 mL (arterial) → ~15 mL/100 mL (venous) → O₂ utilization coefficient ≈ 25%.
4. Factors Determining Tissue Venous pO₂
Tissue venous pO₂ depends on:
Rate of blood flow
Arterial pO₂
Hemoglobin content
Tissue O₂ consumption
Example: ↓ blood flow or ↑ O₂ consumption → venous pO₂ drops.
5. O₂ Delivery During Exercise
Alveolar pO₂ remains near 13.3 kPa but blood equilibrates faster → may drop to ~11 kPa (80 mm Hg).
Plateau of oxygen equilibrium curve ensures arterial O₂ content remains nearly constant.
Venous O₂ partial pressure falls during exercise → more O₂ released.
Rest: 5 mL O₂/100 mL blood released (~25% utilization).
Moderate exercise: ~65% utilization.
Extreme exertion: venous pO₂ may approach 0 → nearly 100% O₂ utilization.
Critical venous pO₂: ~1.3 kPa (10 mm Hg) → below this, aerobic metabolism impaired.
Blood flow to working muscles increases to maintain venous pO₂ above critical levels.
6. Functional Design of Human Hemoglobin
Nearly fully saturated at lung pO₂.
Flat curve at pulmonary pO₂ → ensures full oxygenation.
Steep curve at tissue pO₂ → allows efficient O₂ release.
Optimized for:
Oxygen uptake in lungs.
Oxygen delivery to tissues at rest and during exercise.
Example of evolutionary molecular design.
7. Key Principles for Understanding O₂ Transport by Respiratory Pigments
Extent of pigment oxygenation: Check blood pO₂ in breathing organs and refer to oxygen equilibrium curve.
Extent of deoxygenation in tissues: Measure tissue pO₂ or mixed venous pO₂; use curve to estimate O₂ released.
O₂ delivery: Depends on blood flow rate and O₂ yield per unit volume.
Physiological integration: Hemoglobin properties are closely matched with organ and tissue O₂ demands.
8. Takeaways About the Curve
Plateau region → protects arterial O₂ content from small pO₂ changes.
Steep region → small drops in pO₂ lead to large O₂ release → crucial during exercise.
Venous reserve: O₂ remaining in blood after passing through tissues → allows rapid adaptation during exercise.
. Interaction Between Blood Flow and O₂ Yield
O₂ delivery = blood flow × O₂ yield per unit volume.
These two factors are interdependent:
Blood flow affects venous pO₂, which affects O₂ release from hemoglobin.
Exercise significantly alters O₂ delivery; studying animals over a range of conditions is necessary to understand O₂ transport.
2. Shape of the Oxygen Equilibrium Curve
The curve reflects how hemoglobin or other respiratory pigments bind O₂.
Hyperbolic curve: no cooperativity (e.g., myoglobin, single O₂-binding site).
Sigmoid curve: positive cooperativity (e.g., hemoglobin with 4 O₂-binding sites).
Binding at one site increases affinity at remaining sites.
Unloading is also cooperative: O₂ release at one site promotes release at others.
Analogy to enzymes:
Independent sites → hyperbolic (like Michaelis–Menten kinetics).
Cooperative sites → sigmoid (like allosteric enzymes).
3. Cooperativity Quantification
Hill coefficient (n): measures cooperativity:
n = 1 → no cooperativity (myoglobin)
n = 2.4–3 → mammalian hemoglobins
n ≥ 6 → some high-molecular-weight hemoglobins/hemocyanins
Effect: enhances responsiveness to O₂ partial pressures in the mid-range, optimizing loading and unloading.
4. O₂ Affinity and P₅₀
O₂ affinity: how readily a pigment binds O₂.
High P₅₀ → low affinity (requires high pO₂ for 50% saturation)
Low P₅₀ → high affinity (binds O₂ even at low pO₂)
Rightward shift of curve: lowers affinity, increases P₅₀.
Leftward shift: increases affinity, decreases P₅₀.
Species examples:
Human hemoglobin: P₅₀ ≈ 3.5 kPa (lower affinity)
Carp hemoglobin: P₅₀ ≈ 0.7 kPa (higher affinity)
5. Bohr Effect
Definition: O₂ affinity decreases in response to lower pH or higher CO₂ partial pressure.
Mechanism:
H⁺ ions bind hemoglobin at sites different from O₂ sites → allosteric modulation → promotes O₂ release.
CO₂ can lower O₂ affinity directly or indirectly (via pH change).
Physiological significance:
In systemic tissues: high CO₂, low pH → shift curve right → easier O₂ unloading.
In lungs/gills: low CO₂, higher pH → shift curve left → easier O₂ uptake.
Exercise:
CO₂ rises, pH falls in muscles → Bohr effect enhances O₂ delivery during activity.
1. Bohr Effect and O₂ Delivery
Definition: Decrease in O₂ affinity of hemoglobin caused by lower pH and/or higher CO₂ partial pressure.
Physiological significance:
Arterial blood: higher O₂ affinity (low CO₂, higher pH) → efficient loading in lungs/gills.
Venous blood: lower O₂ affinity (higher CO₂, lower pH) → efficient unloading in tissues.
Visual example: Arrows on an O₂ equilibrium curve show increased O₂ delivery per 100 mL of blood when the Bohr effect reduces affinity in venous blood.
Takeaway: The Bohr effect enhances tissue O₂ delivery without impairing O₂ loading in respiratory organs.
2. Root Effect (Specialized in Some Fish)
Definition: Severe reduction of oxygen-carrying capacity due to low pH and/or high CO₂.
Function:
Helps inflate swim bladders (teleost fish) by raising local O₂ partial pressure.
Oxygenates poorly vascularized retinas.
Mechanism: Often amplified by rete mirabile (countercurrent vascular network) to increase local O₂ pressure.
3. Temperature Effects
Principle: O₂ affinity generally decreases as temperature rises, and increases as temperature falls.
Implications:
During exercise: warmer muscles → enhanced O₂ unloading (similar to Bohr effect).
Arctic/hypothermic limbs: low temperature could increase O₂ affinity → risk of impaired unloading.
Woolly mammoth hemoglobin evolved reduced temperature sensitivity to avoid this problem.
4. Organic Modulators
Mammals: 2,3-DPG (2,3-bisphosphoglycerate) reduces O₂ affinity → rightward shift (increased P₅₀).
Chronic changes help acclimation or adaptation, e.g., anemia → higher 2,3-DPG → better tissue O₂ delivery.
Other vertebrates: Fish and birds use other organophosphates: ATP, GTP, IPP, etc., with similar effects.
Invertebrates: Hemocyanins modulated by lactate, dopamine, trimethylamine, etc.
5. Inorganic Ion Modulation
Examples:
Cl⁻ in ruminants and some bears → alters hemoglobin O₂ affinity.
Ca²⁺ and Mg²⁺ in crustaceans → modulate hemocyanin affinity.
Adaptive response to environmental O₂ changes, e.g., blue crabs in low-O₂ water increase Ca²⁺ to maintain O₂ binding.
1. Functions of Respiratory Pigments
Respiratory pigments (hemoglobin, myoglobin, hemocyanin, etc.) perform multiple roles beyond simple O₂ transport:
Routine O₂ transport (classic role)
Carry O₂ from lungs/gills to systemic tissues.
Most studied function in vertebrates.
O₂ storage in invertebrates
Some invertebrate pigments have very high O₂ affinity.
Function as a reservoir during severe O₂ shortages (e.g., tube-dwelling marine worms).
Blood pH buffering
Hemoglobin can act as a dynamic buffer, binding H⁺ during deoxygenation and releasing H⁺ during oxygenation.
CO₂ transport
Hemoglobins facilitate CO₂ carriage in blood, contributing to acid-base regulation.
Intracellular O₂ diffusion and storage (myoglobin)
Myoglobin in muscle accelerates O₂ diffusion to mitochondria.
Serves as an O₂ reserve during sudden, high-intensity exercise.
Enzymatic roles
Deoxyhemoglobin and deoxymyoglobin catalyze nitric oxide (NO) formation or breakdown, regulating mitochondrial respiration.
Non-respiratory transport
Some pigments transport other molecules, e.g., sulfide (S²⁻) in symbiotic worms.
Regulatory/protective roles (myoglobin, neuroglobin, cytoglobin)
Myoglobin regulates mitochondrial respiration, antioxidant defense, and substrate availability.
Neuroglobins act as O₂ stores in neurons, protect against ischemia, and may sense metabolic stress.
Cytoglobins are another recently discovered globin family with emerging roles.
2. Patterns of Circulatory O₂ Transport
Mammals and many fish (e.g., rainbow trout):
Arterial blood nearly saturated at rest.
Venous blood contains large O₂ reserve → used during exercise.
Increase in O₂ delivery achieved by both greater unloading and higher blood flow.
Cephalopods (squids, octopuses):
Small venous O₂ reserve at rest → venous blood almost fully deoxygenated.
Exercise relies almost entirely on increased circulation.
High sensitivity to hypoxia due to lack of venous reserve.
O₂-carrying capacity variations:
Vertebrates: 5–20 mL O₂/100 mL blood.
Mammals/birds: 15–20 mL O₂/100 mL.
Fish, amphibians, reptiles: 5–15 mL O₂/100 mL.
Invertebrates (hemocyanin): 1–5 mL O₂/100 mL.
Can be acutely adjusted in some vertebrates (e.g., spleen releases red blood cells in horses, dogs).
3. Differential O₂ Affinities Facilitate Transfer
Blood pigment → Myoglobin in muscles:
Myoglobin has higher O₂ affinity → pulls O₂ from hemoglobin.
Maternal → Fetal transfer:
Fetal hemoglobin has higher O₂ affinity → extracts O₂ from maternal blood.
Mechanisms include:
Structural differences reducing sensitivity to 2,3-DPG.
Lower fetal 2,3-DPG levels in some species.
Bohr effect differences enhance transfer (CO₂ exchange between mother/fetus).
4. Evolutionary Adaptation
Respiratory pigments are direct interfaces between the animal and the environment.
Species in low-O₂ habitats often evolve pigments with higher O₂ affinity:
Example: Carp and catfish (P₅₀ = 0.1–0.7 kPa) → efficient O₂ loading in hypoxic water.
Fish in well-aerated environments (mackerel, rainbow trout) → higher P₅₀ → lower affinity.
Oxygen Transport and Respiratory Pigments
Oxygen affinity and tissue unloading:
Low oxygen affinity can enhance O₂ delivery to systemic tissues if the lungs or gills maintain high enough O₂ partial pressures.
Small-bodied mammals often evolve lower hemoglobin O₂ affinity to promote tissue oxygen unloading.
Acclimation and acclimatization:
Animals adjust to chronically low O₂ (hypoxia) via:
Increasing respiratory pigment concentration (e.g., red blood cells in fish).
Altering O₂-binding properties:
Synthesizing new globin forms (e.g., Daphnia increase O₂ affinity in hypoxic water).
Modifying intracellular modulators (e.g., ATP, GTP, Ca²⁺) to change O₂ affinity without producing new hemoglobin types.
Extreme cases: Icefish:
Antarctic icefish lack hemoglobin.
They survive due to:
Highly oxygenated, cold, and well-aerated water.
High blood flow and large-diameter vessels to compensate for low O₂-carrying capacity.
High-altitude mammals:
Adaptations include high hemoglobin O₂ affinity rather than high RBC counts.
Lowland humans at high altitude often show maladaptive responses (polycythemia) that increase blood viscosity.
Carbon Dioxide Transport
Chemical forms of CO₂ in blood:
Dissolved CO₂ (~5% in humans)
Bicarbonate (HCO₃⁻) – main form (~90%)
Carbamino compounds (CO₂ bound to amino groups on proteins/hemoglobin)
Bicarbonate formation and buffering:
CO₂ + H₂O ↔ HCO₃⁻ + H⁺
Blood buffers (mainly hemoglobin) remove H⁺, allowing high bicarbonate formation.
Effective buffering depends on buffer concentration, pK', and prevailing pH.
Haldane effect:
Deoxygenated blood binds more CO₂ due to increased buffering capacity of hemoglobin.
This facilitates CO₂ uptake in tissues and release in lungs—complementary to the Bohr effect.
Carbonic anhydrase (CA) and anion transport:
CA catalyzes CO₂ ↔ HCO₃⁻ conversion in red blood cells.
HCO₃⁻ leaves cells via chloride shift (Cl⁻ exchange) to maintain ionic balance.
Membrane-bound CA in tissues enhances local CO₂ hydration.
Acid–Base Physiology
Blood pH and temperature:
Normal pH is tightly regulated (human arterial blood ~7.4 at 37°C).
Poikilotherms show temperature-dependent pH changes to maintain protein charge balance (alphastat hypothesis).
Regulatory mechanisms:
CO₂ modulation via ventilation: hyperventilation decreases H⁺ (alkalizes), hypoventilation increases H⁺ (acidifies).
H⁺ excretion: kidneys (terrestrial) or gills (aquatic) remove excess acid.
Bicarbonate regulation: retention or excretion shifts acid-base balance (left/right in CO₂ + H₂O ↔ HCO₃⁻ + H⁺).
Functional significance:
Proper pH is crucial for protein function and enzyme activity.
Buffer systems (hemoglobin, plasma proteins) stabilize pH, enabling effective O₂ and CO₂ transport.