02.03 Price Elasticity of Demand
Elasticity: A Comprehensive Guide
What is Elasticity?
Definition: Elasticity measures how much consumers change their buying behavior in response to changes in price or other demand determinants. In simpler terms, it's about how sensitive demand is to change.
General Concept: Like how a rubber band stretches, elasticity in economics refers to how much the quantity demanded of a good or service changes when factors like price change.
Price Elasticity of Demand: This specifically measures how much the quantity demanded changes in response to a change in price.
Examples:
Inelastic Demand: Gasoline in the United States. Even if the price increases, people still buy roughly the same amount.
Elastic Demand: A specific brand of chips. If the price increases even a little, consumers will switch to a different brand.
Why Does Elasticity Matter?
Elasticity is crucial for:
Producers (Sellers): Helps them understand how price changes affect revenue.
Public Policy Makers: Informs decisions about taxation and its impact on businesses.
Key Questions Answered by Understanding Elasticity:
"If we raise the price, will we make more money, or will we lose customers and actually make less money?"
"If the government adds or raises a tax, will it raise much tax revenue, or will it just hurt businesses who sell the product?"
"If we do a promotional sale, are we likely to increase sales revenue, or are we likely to sell the same quantity but gain less revenue?"
"Do people seem to think of this product as a luxury or as a need?"
The Determinants of Elasticity

Slope and Price Elasticity - Explained with Graphs
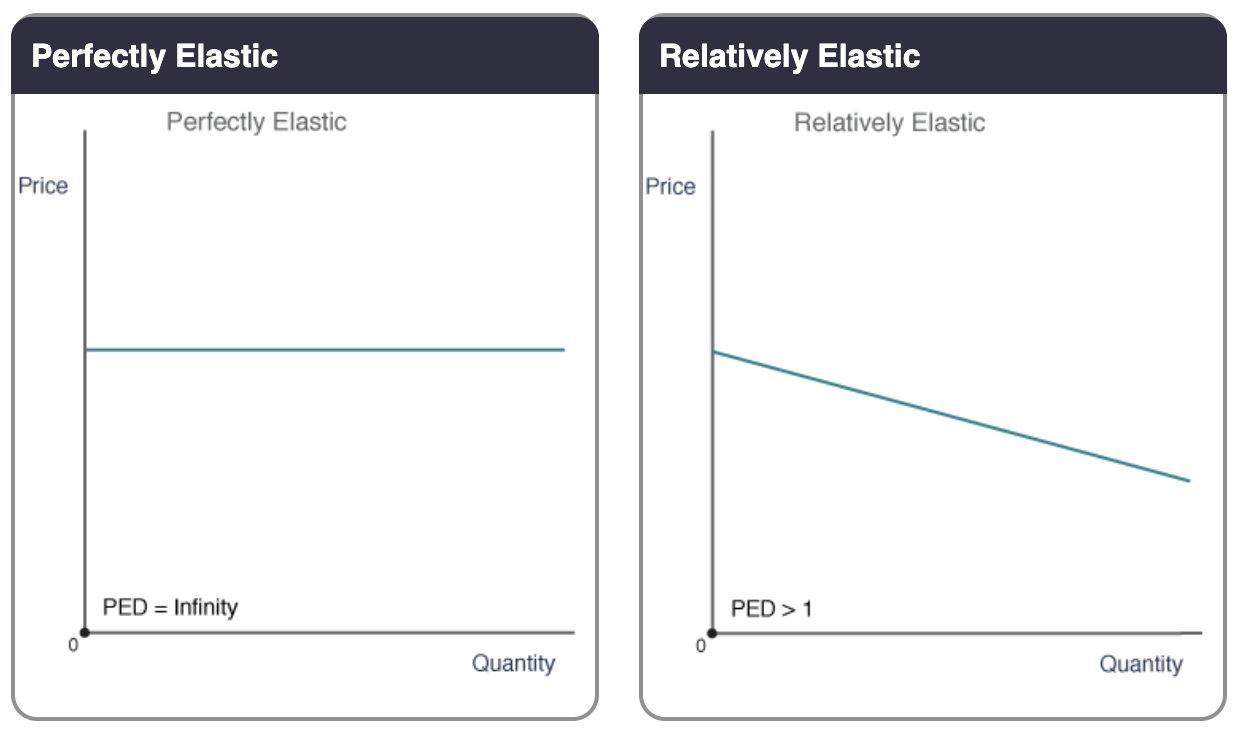
Perfectly Elastic Demand:
Graph: Flat, horizontal line.
Concept: At the market price, there is effectively infinite demand. Above the demand line, quantity demanded is zero.
Example: Vending machine with identical candy bars on two racks. If one rack charges even a nickel more, no one will buy from it.
Limiting Factor: Supply available.
Elastic Demand:
Graph: Downward-sloping line.
Concept: A relatively small change in price leads to a large change in quantity demanded.
Example: Lowering the price from $2 to $1 increases quantity demanded from 1 to 5 units. A 50% price decrease leads to a 400% quantity increase.
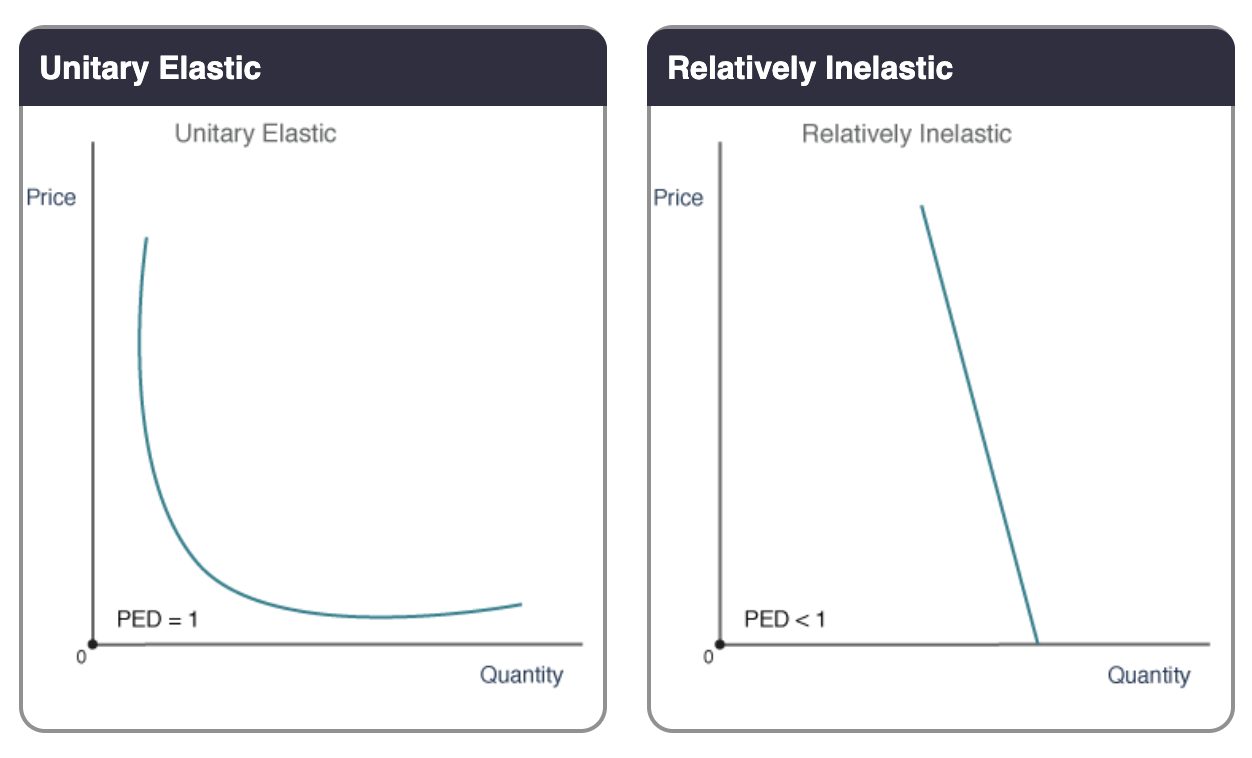
Inelastic Demand:
Graph: Steep downward-sloping line.
Concept: A large change in price leads to a small change in quantity demanded.
Example: Demand for a kidney. People who need a kidney transplant are unlikely to be very sensitive to price.
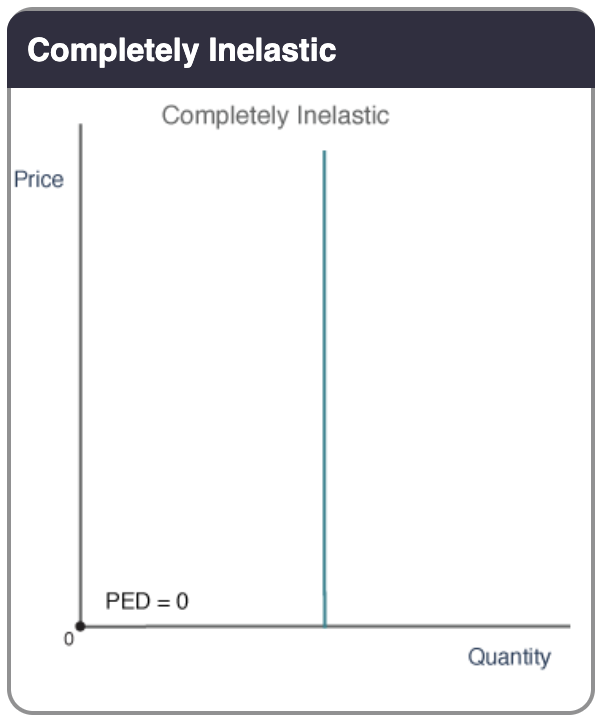
Perfectly Inelastic Demand:
Graph: Vertical line.
Concept: Quantity demanded remains the same regardless of price.
Unit Elastic Demand:
Graph: Downward-sloping line.
Concept: Percentage change in price equals the percentage change in quantity demanded.
Example: Decreasing the price by two results in an increase of quantity demanded by two - a one-to-one proportion.
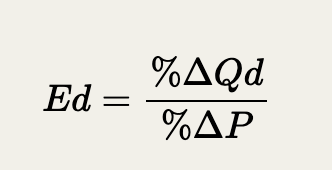
Calculating Elasticity
Elasticity Coefficient: A unitless number that measures elasticity.
Formula:
Elasticity=Percentage Change in Price/Percentage Change in Quantity
Interpreting the Coefficient
Elasticity > 1: Elastic range. A 1% change in price leads to a greater than 1% change in quantity demanded.
Elasticity < 1: Inelastic range. A 1% change in price leads to a less than 1% change in quantity demanded.
Elasticity = 1: Unit elastic. A 1% change in price leads to a 1% change in quantity demanded. This is often the revenue-maximizing point.
Quirky Math Problem and the Midpoint Formula Solution
The Problem: Percentages change depending on whether values are increasing or decreasing (e.g., going from 1 to 2 is a 100% increase, but going from 2 to 1 is a 50% decrease).
Midpoint Formula: Used to avoid errors due to the directional problem of percentages. It calculates percentage changes based on the average of the initial and final values.
Formula:

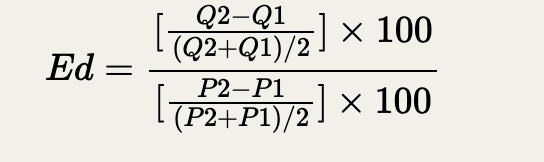
Example:
Quantity demanded increases from 10 to 14 units; price decreases from $6 to $4.
Change in quantity = 14 - 10 = 4
Average quantity = 14+102=12214+10=12
% change in quantity = 412=0.33124=0.33 or 33%
Change in price = $6 - $4 = $2
Average price = 6+42=526+4=5
% change in price = 25=0.4052=0.40 or 40%
Elasticity = 0.330.40=0.830.400.33=0.83
0.83 < 1, so the range is relatively inelastic.
Difference Between Point and Midpoint Formulas:
Point Formula: Uses the initial value as the base for calculating percentage change.
Midpoint Formula: Uses the average of the initial and final values as the base.
The midpoint formula is generally preferred because it avoids directional distortions.
Key Considerations
For price elasticity of demand, ignore the sign (positive or negative).
Always use percentage changes, not just the raw changes in quantity and price.
Be comfortable converting between fractions and percentages.
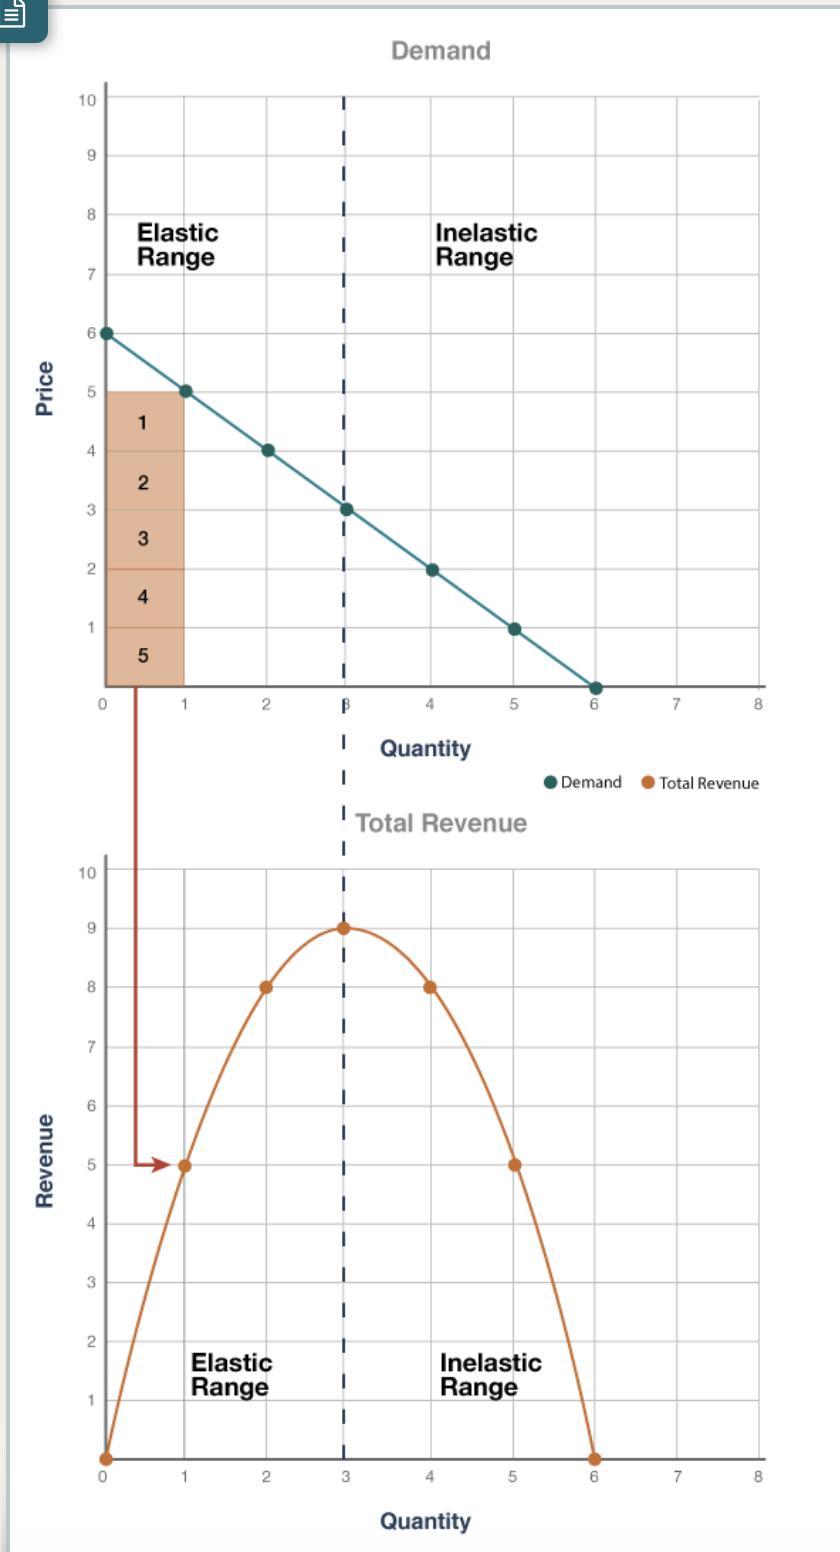
Total Revenue Test
Ranges of Elasticity: A relatively elastic good can have an inelastic range, and vice versa. This is because elasticity changes along the demand curve.
Elasticity is based on percentage changes, not just the slope. *Marginal unit values will yield different values than overall curve values.
Total Revenue: The amount of money a firm receives from selling its product (Price × Quantity).
Total Revenue Test: A method to determine elasticity by examining how total revenue changes with price changes.
Example:
Price
Quantity
Total Revenue
$6
0
$0
$5
1
$5
$4
2
$8
$3
3
$9
$2
4
$8
$1
5
$5
$0
6
$0
Revenue Maximization: Total revenue is maximized at the unit elastic point.
Elastic Range: Increasing price decreases revenue; decreasing price increases revenue.
Inelastic Range: Increasing price increases revenue; decreasing price decreases revenue.
Every business wants to find the sweet spot on their demand curve!