Chapter 7 - Working Capital Management
The Elements of Working Capital WCAP
Working capital is the capital available for conducting the day-to-day operations of an organisation; normally the excess of current assets over current liabilities (Current so we are looking at Short Term not Long-term/Non-current).
Working capital management is the management of all aspects of both current assets and current liabilities, to minimise the risk of insolvency while maximising the return on assets.
Current assets require funding – consider reducing levels (e.g. cash to buy inventory, cash delayed in from offering credit)
Current liabilities provide funding – consider increasing levels (e.g. cash delayed out from accepting credit from supplier)
Investing in working capital has a cost:
the cost of funding it, or
the opportunity cost of lost investment opportunities because cash is tied up in working capital and unavailable for other uses.
Eg. Business overdraft 10k - interest 7% - Made a cash sale of 1k. If received immediately, this will reduce the overdraft to 9k. If instead sale made 30days credit term, the overdraft will remain for 30 days until the customer pays. Therefore, an extra 1k of overdraft is used when offering credit. This means that offering credit will lead to an increased use of the overdraft, costing an extra (1k x 7% x 30/365) 5.75.
Objectives of Working Capital Management
The main objective of working capital management is to get the balance of current assets and current liabilities right.
It can be seen as a trade-off between profitability and liquidity:
Liquidity: ensuring current assets are sufficiently liquid to minimise the risk of insolvency
Profitability: Investing in less liquid assets in order to maximise return
If a business has large amounts of cash, then it should be able to pay its bills on time – liquidity is the priority.
But this cash could have been invested elsewhere, for instance in offering better credit terms to customers to attract more business. This would potentially increase profitability but at the expense of liquidity.
Mismanagement of working capital can lead to:
the inability to meet bills as they fall due
Demands on cash during periods of growth being too great - overtrading
Policies regarding working capital management
Aggressive vs conservative approach to working capital investment levels
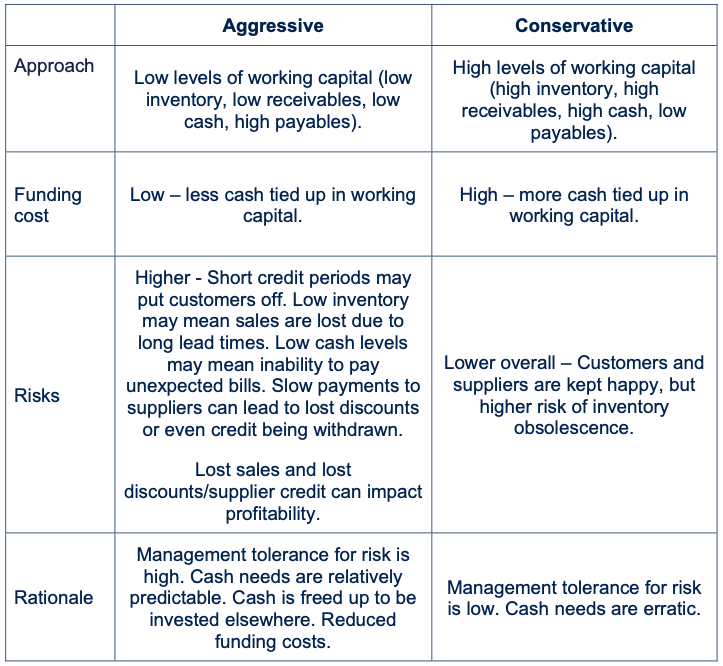
Over-capitalisation and working capital
Funds are inefficiently tied up - might not be able to invest in longer-term things like machinery because cash is unavailable.
Excessive current assets and low current liabilities mean that the business is over-capitalised. There has been an over investment by the business in current assets. Profitability will suffer as a result.
Overtrading
Common reason why business go bust - It means growing too fast without the necessary capital to support increased activity, leading to cash flow problems and an inability to meet short-term obligations.
Healthy trading growth typically leads to: increased profitability and, the need to increase investment in non-current assets and working capital.
If the business does not have access to sufficient capital to fund the increase, it is said to be “overtrading”. This can cause serious trouble for the business if it is unable to pay its business payables.
Indicators of overtrading are:
A rapid increase in revenue
An increase in the values of the working capital days, particularly receivables collection and payables payment periods
Most of the increase in assets being financed by credit
A dramatic drop in the liquidity ratios (see next section).
Working Capital WCAP Ratios
Liquidity Ratios
Current Ratio
This measures how much of the total current assets are financed by current liabilities.
Current Ratio = Current Assets / Current Liabilities
A ratio of 2:1 indicates current liabilities can be paid twice over from current assets. Gives us level of comfort
Quick Ratio (Acid Test Ratio)
Measures how well current liabilities are covered by liquid assets. Is particularly useful where inventory holding periods are long (as strip out illiquid inventory). Better measure of liquidity compared to current ratio.
Quick Ratio = (Current Assets - Inventory) / Current Liabilities
A ratio of 1:1 implies that all current liabilities can be covered if they fall due at once.
Example: A company has $25m of current assets, of which $5m are inventory. Its current liabilities stand at $15m.
Current Ratio = CA/CL = 25/15 = 1.67:1 meaning they can cover 1.67 times CL
Quick Ratio = (CA-Inventory)/CL = (25-5)/15 = 20/15 = 1.33:1, indicating that even after excluding inventory, the company can cover its current liabilities 1.33 times.
Cash Operating Cycle (working capital cycle)
In some businesses there is a long period of time between purchasing and paying for raw materials and selling the final products. For example, a cheese manufacturer where the cheese needs to sit and age, potentially for a number of years.
In other businesses, such as supermarkets, the cash from the sale of some goods will be received before the supermarket has had to pay its supplier for those goods. For example, a supermarket will take credit from its suppliers of milk, but will get the milk on the shelves and sold for cash as quickly as possible.
The longer the time period between paying for the goods and the receipt of the sales cash, the longer that cash is tied up in working capital.
The Working Capital Cycle is the length of time between the company’s outlay on raw materials, wages and other expenditures and the inflow of cash from the sale of goods.
The faster a firm can ‘push’ items around the cycle, the lower the total working capital and the lower its investment in working capital needs to be.
Factors affecting the length of the cycle depend on:
liquidity versus profitability decisions
terms of trade
management efficiency
industry norms e.g. retail versus construction.
The optimum level of working capital is the amount that results in no idle cash or unused inventory but that does not put a strain on liquid resources.
Basic formula structure:
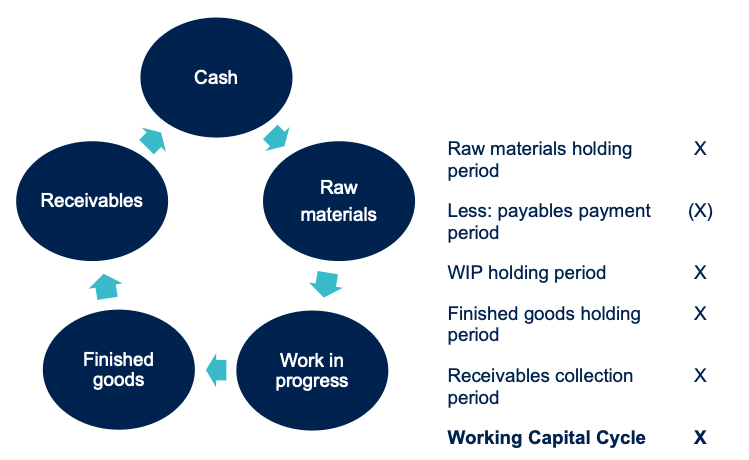
Example 2
Cash Operating Cycle Calculation with the following periods:
Raw material holding period: 25 days.
Payables payment period: 40 days.
WIP holding period: 5 days.
Finished goods holding period: 15 days.
Receivables collection period: 66 days.
Result:
Cash operating cycle ratios
Basic Equation Structure
Choose the SPL (Statement of P&L) figure that is most closely linked with the SFP item. For example, receivables exist in the SFP (Statement of Financial Position) because we have made credit sales in the SPL - so use credit sales (Sale made with credit) when calculating receivable days.
Inventory holding period
This is the length of time inventory is held between purchase/completion and sale.
Inventory holding period = Inventory / CoS x 365
Inventory days shows how long inventory is held before it is sold.
Longer inventory holding periods increase storage costs, and exposes the company to items becoming obsolete or damaged.
Manufacturing industries will instead have:
Raw material inventory holding period
= Raw material inventory / Material usage x 365
This is the length of time raw materials are held between purchase and being used in production.
NB: where usage cannot be calculated, purchases give a good approximation. If detailed raw materials usage figures aren’t available, choose cost of sales instead.
and: WIP holding period
= Work-in-progress inventory held / Production cost x 365
Work in progress (part finished inventory) exists because items are being produced. The business has incurred both materials and other production costs in making the units.
This is the length of time goods spend in production.
NB: Again, use cost of sales if detailed production cost is not available.
and: Finished goods inventory holding period
= Finished goods inventory held / CoS x 365
Finished goods have been completed and are ready to sell.
This is the length of time goods spend in production.
Trade receivables collection period
This is the length of time credit is extended to customers.
Trade receivables collection period = Trade receivables / Credit sales x 365
If credit sales aren’t given in the question, use the general revenue figure.
The receivables collection period shows how long it takes to collect debts from customers. This should be compared to the company's credit terms when assessing performance.
Trade payables payment period
This is the average period of credit extended by suppliers.
Trade payables payment period = Trade payables / Credit purchases x 365
Payables are driven by making purchases on credit. If we pay cash for supplies, there is no payables balance!
Credit purchases should, therefore, be used to calculate the payables payment period most accurately. However, you can use total purchases if credit purchases aren’t available - or cost of sales if purchases aren’t given.
The payables payment period shows how long we are taking to pay suppliers.
Flexibility in the calculations
A key thing to recognise when making use of these calculations is that flexibility is needed when the exact formula figures are not available. For example, the use of total sales revenue in the receivables collection period calculation if the detail of credit sales is not given, or using cost of sale in place of credit purchases for the payables payment period calculation.
In exam questions, look for the most appropriate figure that has been provided and use that.
Working capital turnover
Working capital turnover = Sales revenue / Net working capital
This formula does not follow the same pattern as the others - it is the wrong way round! The SPL item is on top, SFP underneath.
This shows how many times a company converts its working capital into sales. It’s a measure of efficiency - a higher number is better.
Working capital investment levels
The working capital ratios formulae can be rearranged so that instead of calculating the number of days they can be used to predict future (or calculate current) levels of investment (the SFP figure).
For instance, to calculate an inventory balance, the formula:
Inventory Holding Period = Inventory / CoS x 365
Is rearranged to become:
Inventory = Inventory Holding Period / CoS x 365
As an example, if the inventory holding period is 75 days out of a 365 day year and the annual cost of sales figure is $5,000,000, the inventory level would be expected as 75 / 365 × $5,000,000 = $1,027,397.