Population Ecology
R-Strategy
- r-strategy: species that typically have a relatively short life span; reproduce once and have a large quantity of offspring; observed in unstable environments
- traits associated with r-strategy:
- small body size
- short life spans and generations
- fast reproduction
- ability to widely disperse offspring
K-Strategy
- k-strategy: organisms that can reproduce several times during their lifespan, but the offspring are much slower in reaching maturity; observed in stable environments
- traits associated with K-strategy
- larger body size
- longer life span and generations
Population Sampling
- population sampling methods
- random sampling
- quadrats
- transect
- capture-mark-release
Random Sampling:
- random sampling: finding the distribution of species or comparing distributions in different locations
- Finding the distribution of species or comparing distributions in different locations
- Gives a good representation of the population
- Assumes every organism has an equal chance of being sampled
Capture- Mark - Release:
- <<capture mark release steps<<
- <<A large sample of the specimen must be trapped/netted (without causing harm)<<
- <<The number of captured organisms is counted and recorded<<
- <<Captured animals are marked (eg. Non-toxic dye, clipping fur)<<
- <<Animals are returned to the wild and allowed to reintegrate.<<
- <<A second sample of the specimen is collected from the population after some time.<<
- <<The numbers of marked and unmarked animals in the new sample are counted and recorded.<<
- The population size is calculated using the Lincoln Index formula:
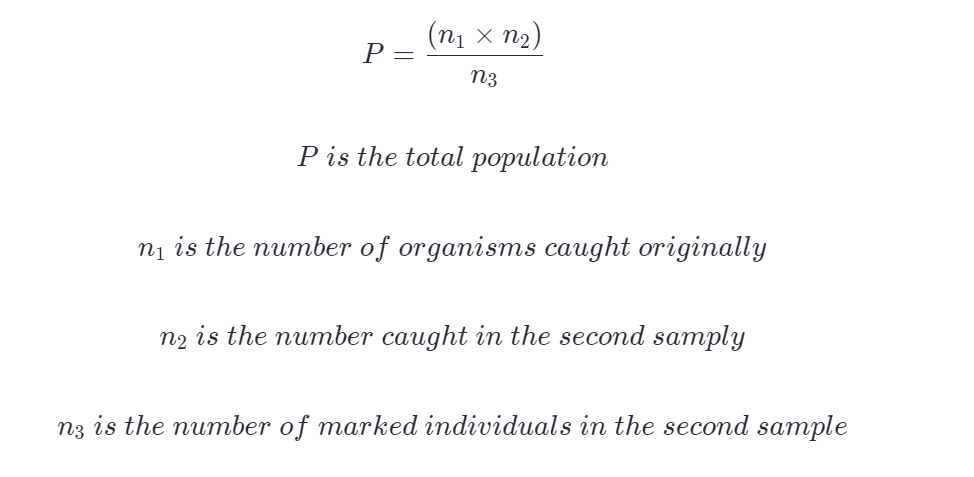
Quadrats:
- quadrant: square made up of wood or metal, placed on the ground; the organisms found in the quadrats are counted
- <<process of quadrats:<<
- <<Divide the area that needs to be surveyed into 1m squares and give it quadrants<<
- <<Use a random # generator to determine which grid squares to use<<
- <<Count the number of organisms in the selected squares<<
- <<Average the number found in 1m^2 and multiply by the total number of squares in that survey area!<<
Transects:
- transect: shows the distribution of species in relation to abiotic factors or changes in communities of organisms across a habitat
- Systematic rather than random
- Stretch tape/rope from a fixed point across the changing habitat
- At intervals (10m, or what is suitable) along the tape, put down a quadrat and count the organisms inside it.
- Gives a series of samples
- Measure the abiotic factor of interest at each quadrat location (ie: temperature, salinity, soil pH)
- <<Process:<<
- <<Stretch tape/rope from a fixed point across the changing habitat<<
- <<At intervals (10m, or what is suitable) along the tape, put down a quadrat and count the organisms inside it.<<
- <<Gives a series of samples<<
- <<Measure the abiotic factor of interest at each quadrat location (ie: temperature, salinity, soil pH)<<
Biotic Index
- Found by surveying and sampling organisms present
- Each species is given a 'sensitive factor' which indicates its ability to tolerate pollution
- high biotic index = sensitive species = good quality
- low biotic index = tolerant species = low quality
- species richness: the number of different species present
- \