02.06 Market Equilibrium and Consumer and Producer Surplus
Market Equilibrium: Detailed Notes
Introduction
Concept: Market equilibrium is the point where the forces of supply and demand balance, determining the market price and quantity.
Analogy: Similar to a hot air balloon that rises or falls until the lifting force equals the force of gravity, the market price adjusts until the forces of supply and demand are equal.
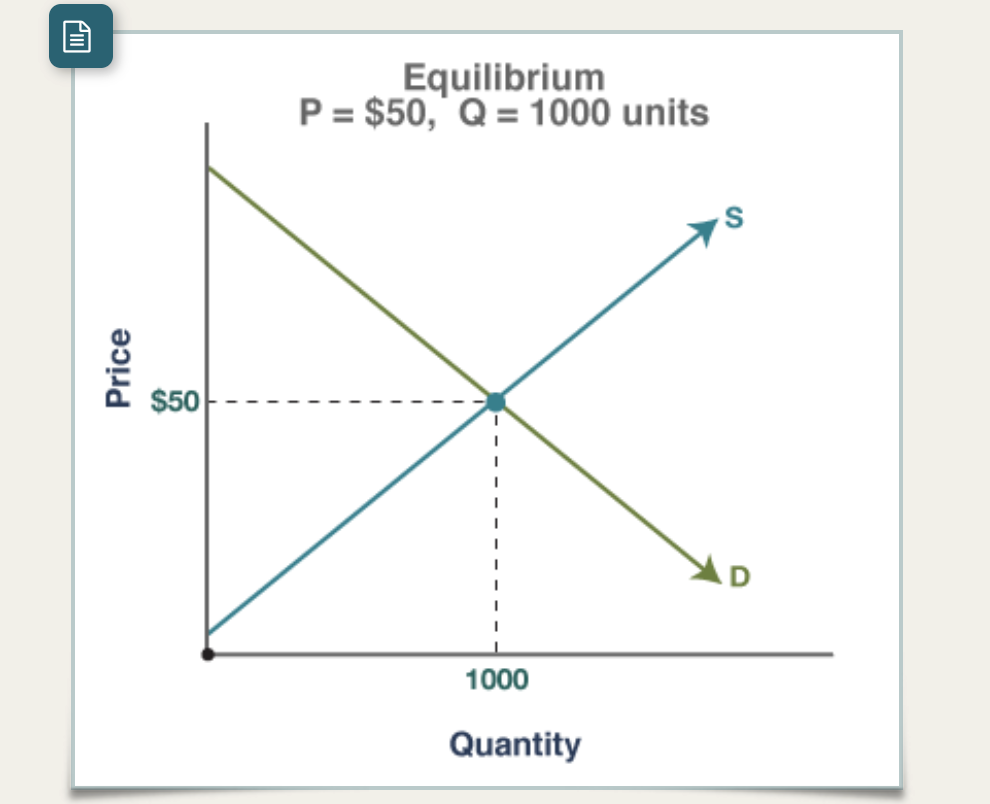
Equilibrium Point: The point where the supply and demand curves intersect on a graph.
Determining Market Equilibrium
For a given good, the equilibrium price might be $50, and the equilibrium quantity might be 1000 units.
How the Market Reaches Equilibrium:
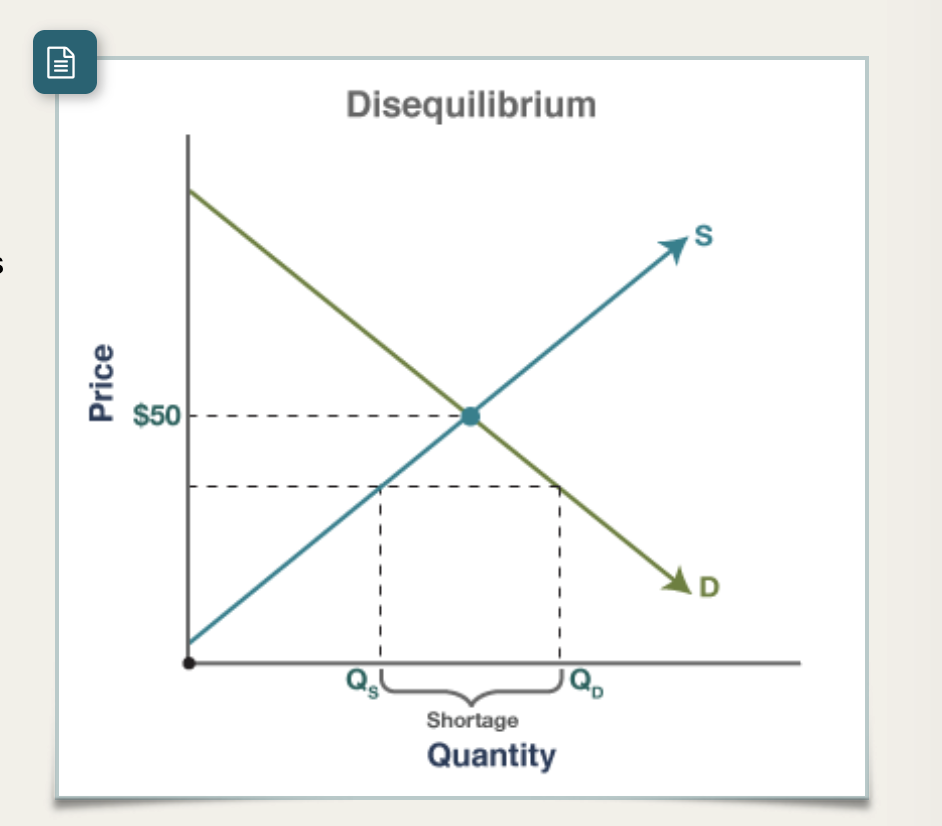
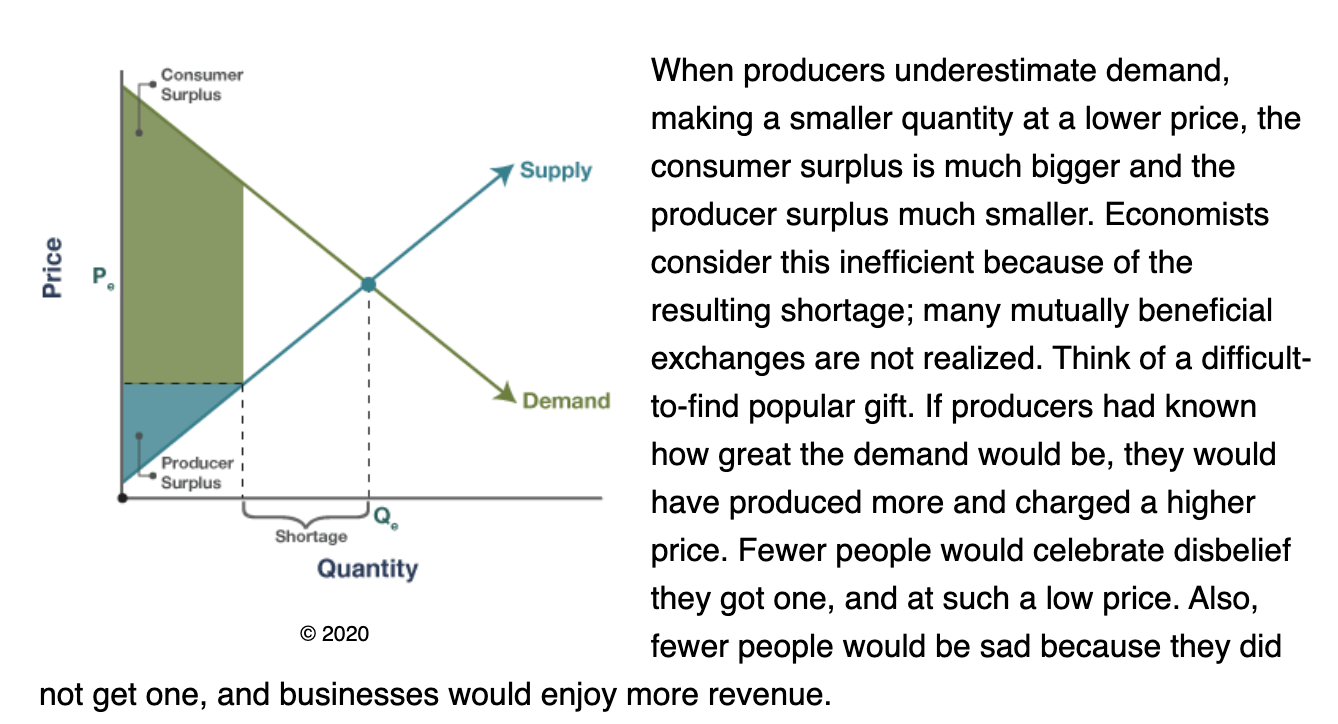
Shortage:
Suppliers underestimate demand and start with a lower price, leading to a lower quantity produced.
They sell out quickly and turn away customers.
Suppliers raise prices and increase production until they reach the equilibrium price and quantity.
A shortage leads to increases in price and quantity supplied until equilibrium is reached.
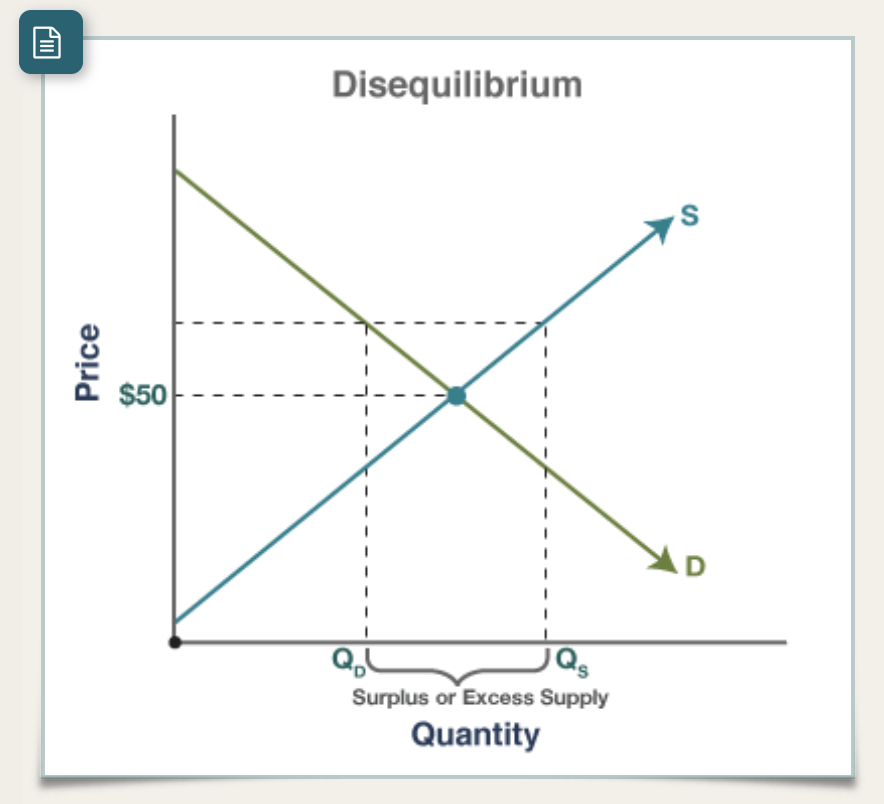
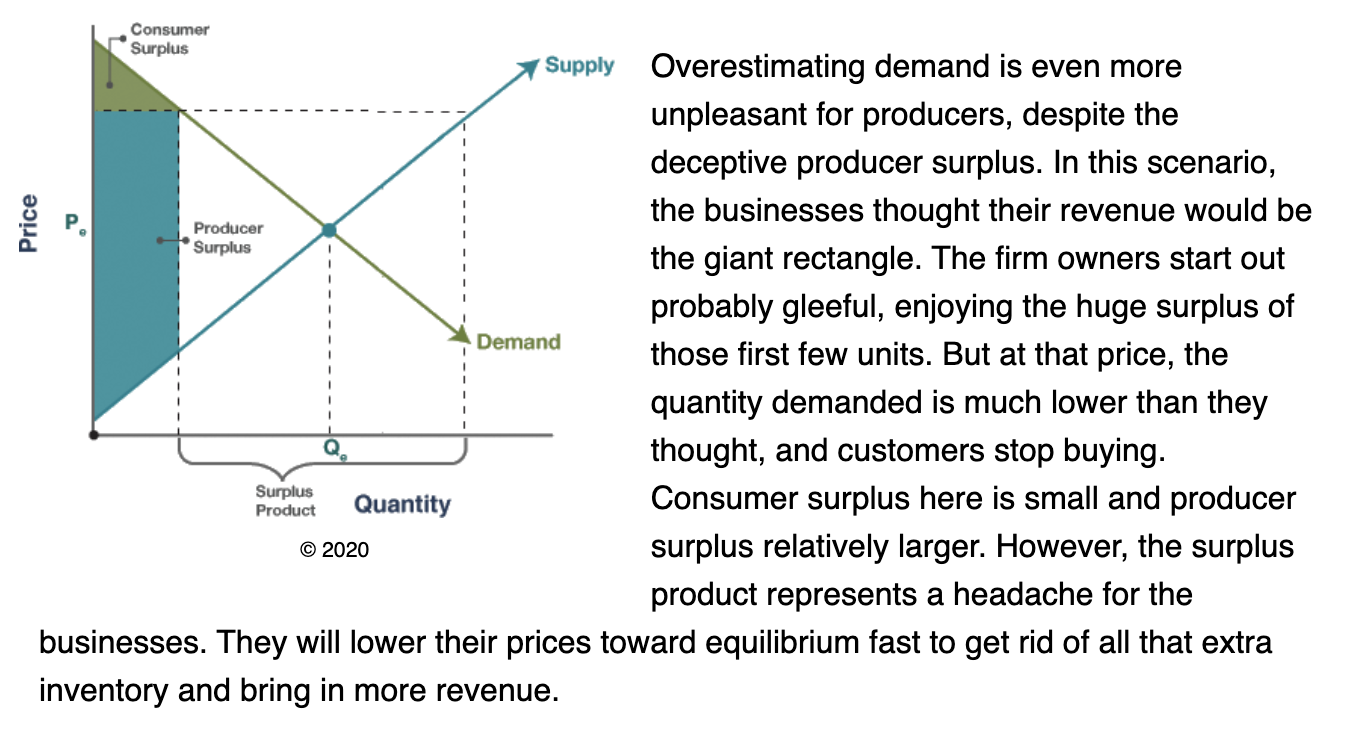
Surplus:
Suppliers overestimate demand and start with a higher price, producing a higher quantity.
They don't sell all their products.
Suppliers lower prices and decrease quantity supplied until they sell everything at the equilibrium price and quantity.
A surplus leads to decreases in price and quantity supplied until equilibrium is reached.
Market Clearing
Theoretical Model: The simple supply and demand model predicts the market will clear at the pure equilibrium point where supply and demand intersect. Quantity supplied equals quantity demanded.
Real Life: The "market clears" at a point slightly off from the pure equilibrium due to political and cultural forces.
Model as a Starting Point: Economists (and physicists) start with the pure model and then add other considerations.
Shifting Equilibrium
Determinants of Supply and Demand: TRIBE (demand) and ROTTEN (supply) determinants can shift the supply and demand curves, changing the equilibrium price and quantity.
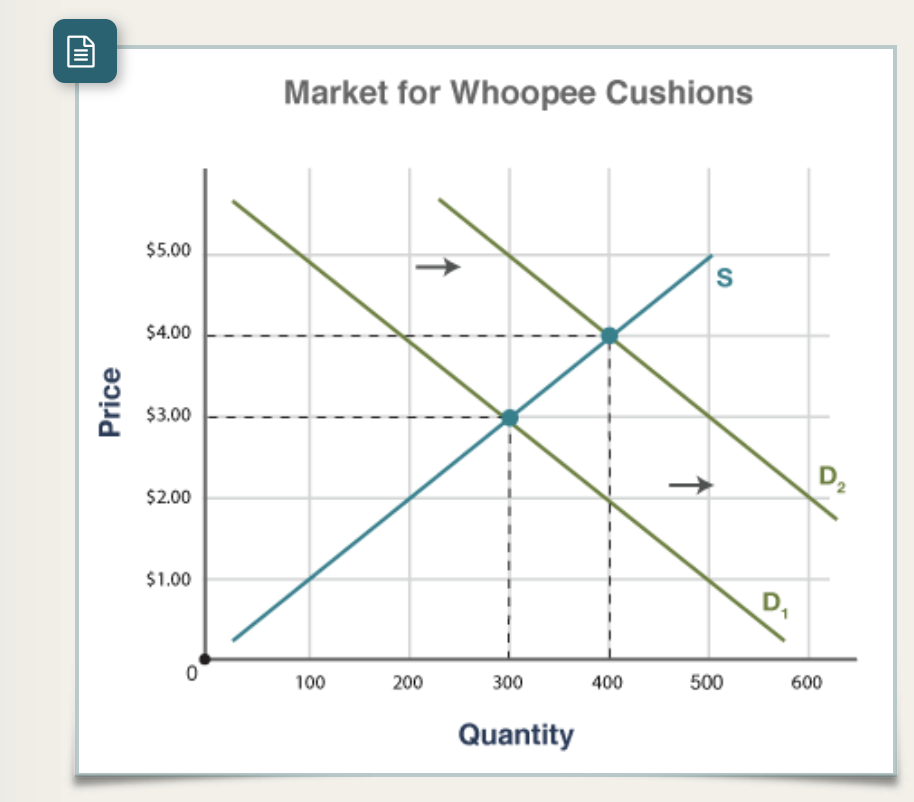
Example: Increased Demand for Whoopee Cushions
A report promoting laughter increases demand for whoopee cushions.
The demand curve shifts to the right (increase in demand).
Assuming the supply curve does not shift, the equilibrium price and quantity both increase.
The Beauty of the Model
Visual Aid: Always draw supply and demand curves to analyze the impact of shifts, even if the question doesn't require it.
Clarity: Drawing curves makes the changes to price and quantity clear, helping you avoid errors.
Labeling: Meticulously label everything (curves, axes, equilibrium points) to ensure the changes are unmistakable.
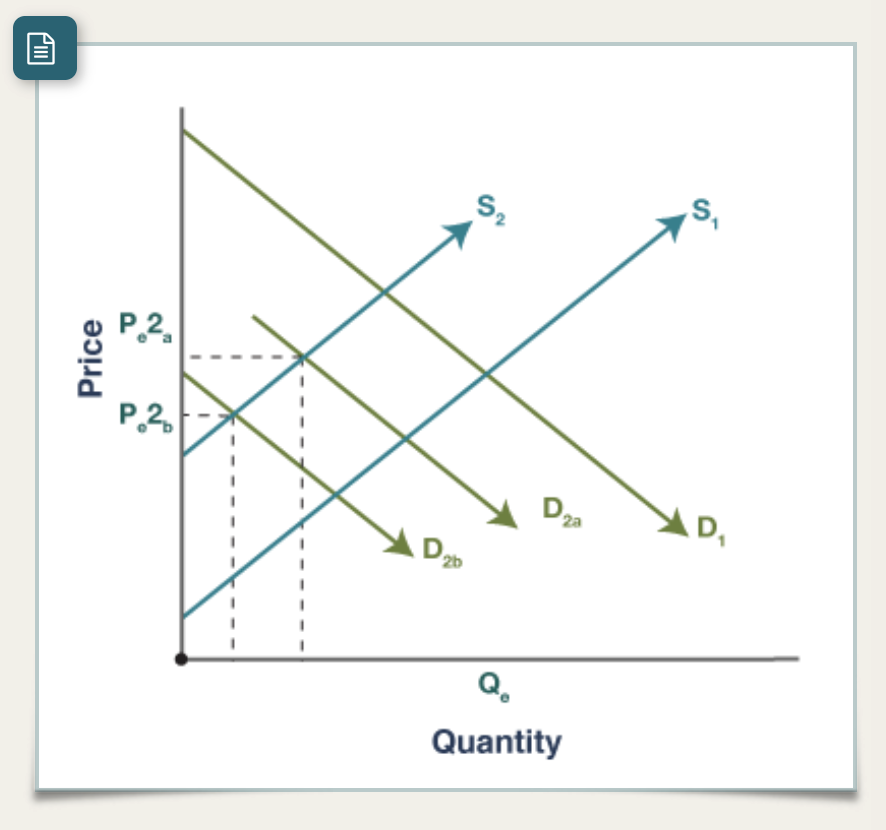
Indeterminate Price or Quantity
Simultaneous Shifts: Multiple events can simultaneously shift both supply and demand.
Visual Representation: Drawing this scenario results in overlapping supply and demand curves, resembling a tipped-over hashtag (#).
Indeterminacy: When both supply and demand shift, either the equilibrium price or the equilibrium quantity will be indeterminate unless specific numbers are given.
Example: Decrease in Both Supply and Demand
The supply shift to the left will decrease equilibrium quantity and increase equilibrium price.
The demand shift to the left will decrease both equilibrium quantity and equilibrium price.
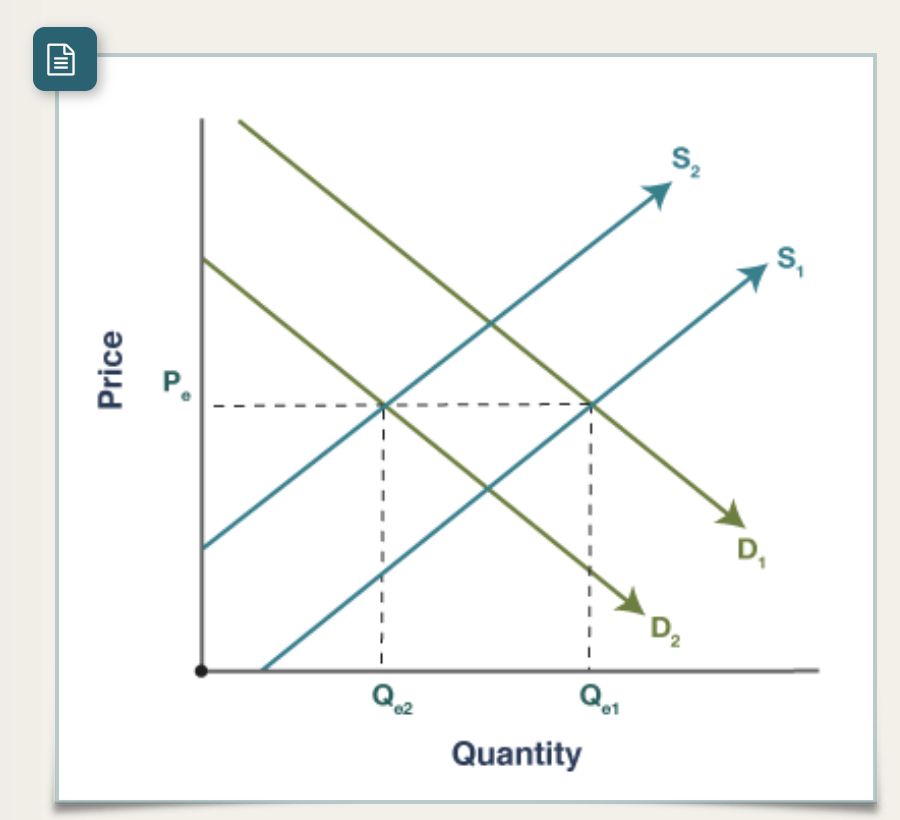
If the supply and demand curves shift by the same proportion, the forces on price cancel each other out, and price remains unchanged.
General Rule: When both supply and demand shift in the same direction, the equilibrium price is indeterminate. When they shift in opposite directions, the equilibrium quantity is indeterminate.
Best Approach:
Illustrate each shift separately on two separate graphs to avoid confusion.
Create a table to summarize the effects of each shift:
Supply shifts left
Quantity decrease
Price increase
Demand shifts left
Quantity decrease
Price decrease
The table and graphs will make it clear that the equilibrium quantity will definitely decrease, but the equilibrium price change is indeterminate.
AP Pro Tip
Real-Life Events: Major events (new technology, natural disasters) impact consumers and producers simultaneously.
Avoid Overthinking: The AP Exam aims for clarity, not ambiguity. Identify just one shift in either or both supply and demand.
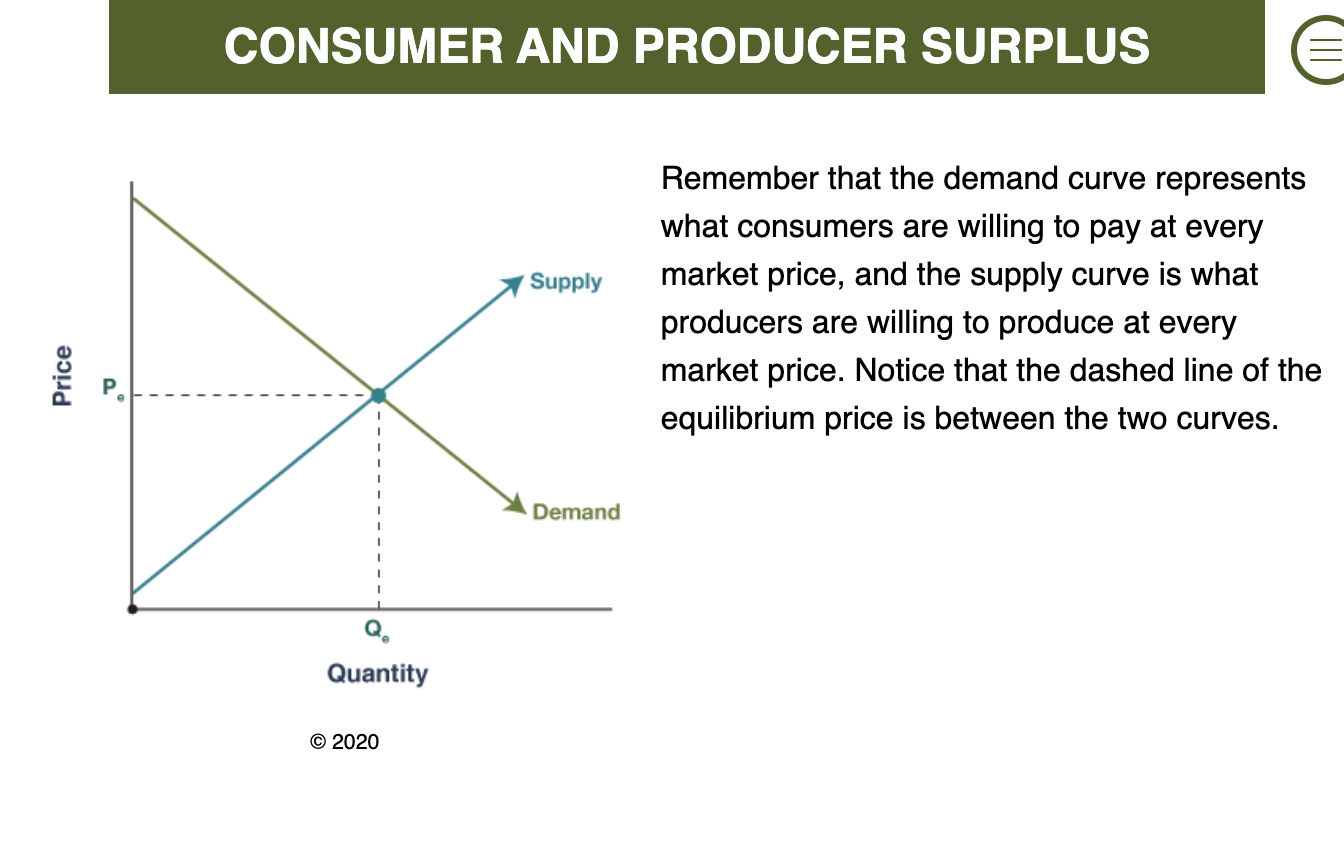
Consumer and Producer Surplus
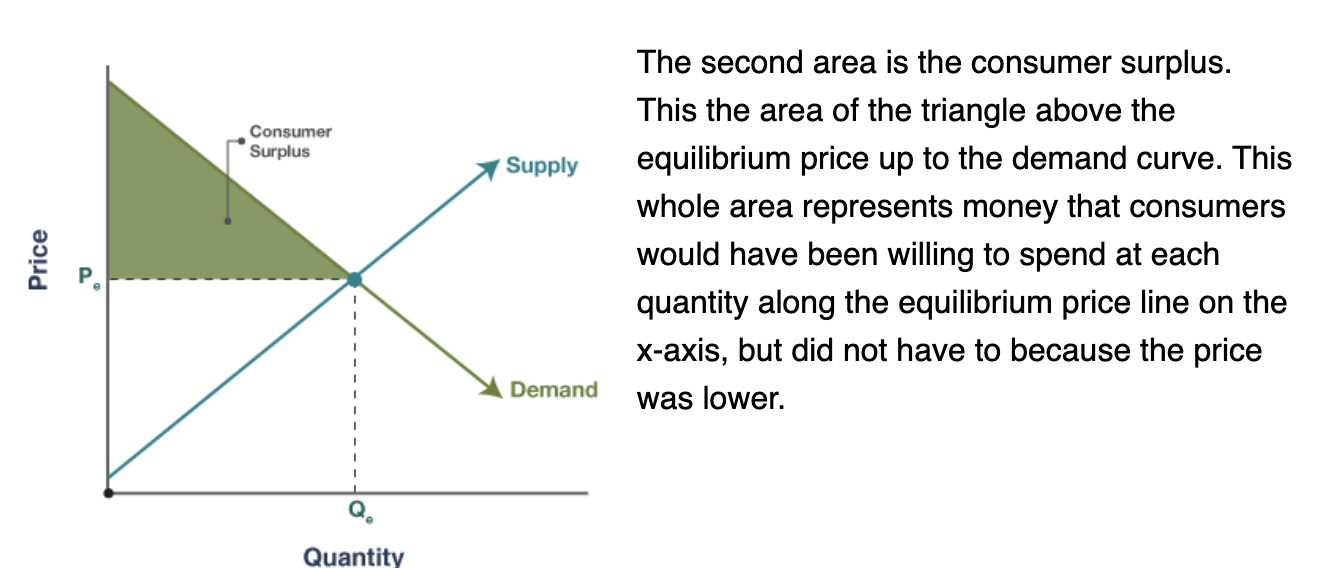
Consumer Surplus: The difference between what buyers are willing to pay and what they actually pay. It's the "pleasant surprise" you feel when something costs less than you expected.
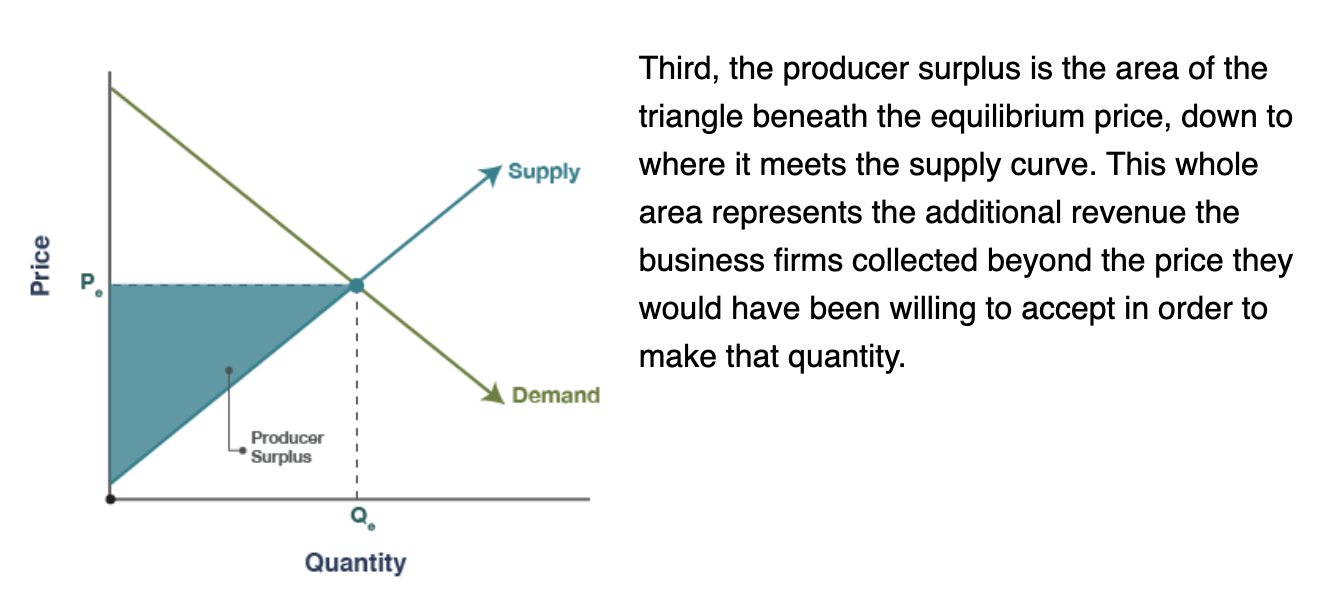
Producer Surplus: The difference between the price producers are willing to accept and the price they actually receive.
Usefulness: Economists use these concepts to advise businesses and governments. Consumers can use them to understand market pricing.
Total Economic Surplus: The sum of consumer surplus and producer surplus. It is maximized at the equilibrium point.
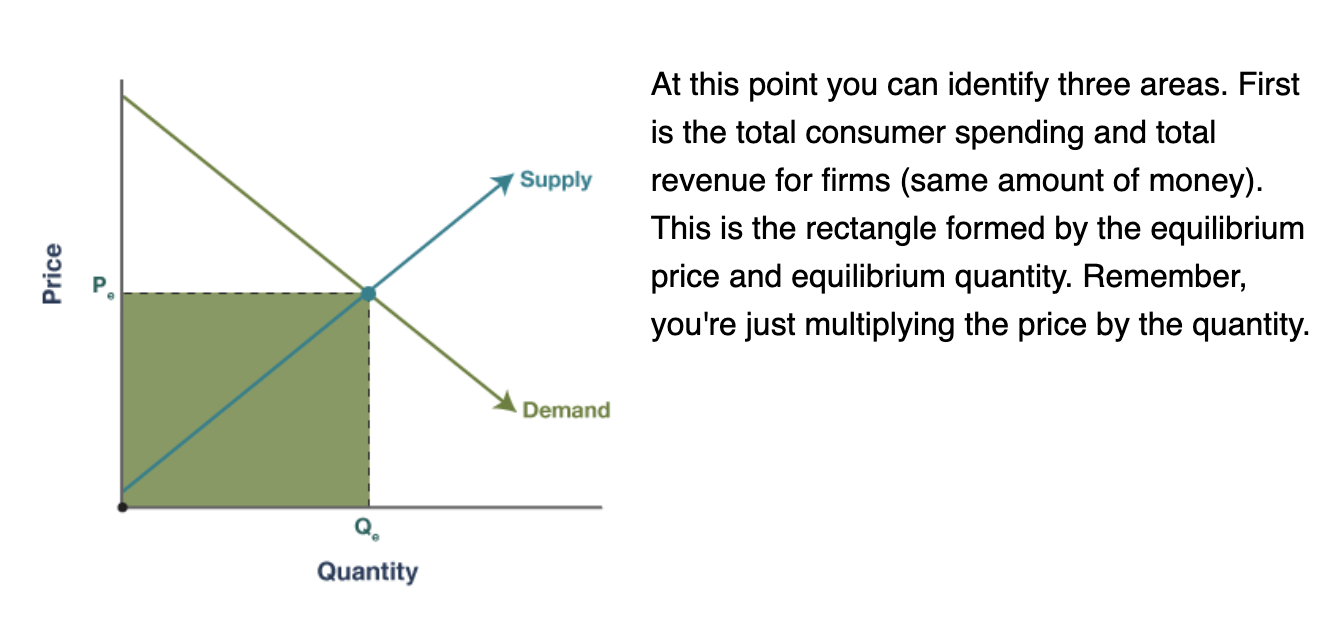
Working with Numbers
Calculations: If you are given numbers on the axes, be prepared to calculate consumer surplus (CS), producer surplus (PS), and total economic surplus (CS + PS).
Equilibrium: In equilibrium, you'll typically calculate the area of two triangles.
Disequilibrium: One surplus will be a triangle, and the other will be a triangle above or below a rectangle.