Environmental Notes
1.1 Continents and Oceans
7 Continents: Africa, Antarctica, Asia, Europe, North America, South America, Oceania
5 Oceans: Atlantic, Pacific, Indian, Arctic, Southern
Characteristics of Oceans:Pacific Ocean: 33% of Earth's surface, largest, contains Mariana Trench (11,034 m deep)
Atlantic Ocean: 20%, divided into North and South
Indian Ocean: Third largest
Southern Ocean: Site of southern circulation
Arctic Ocean: Smallest, around North Pole
1.2 Income Level ClassificationLICs: GNI per capita ≤ $1,086 (e.g., Ethiopia, Haiti)
MICs: GNI per capita $1,086 - $13,205 (e.g., India, Brazil)
HICs: GNI per capita > $13,205 (e.g., USA, Sweden)
Characteristics:LICs: Water scarcity, reliance on raw materials, corrupt governments, high emigration
HICs: Clean water, stable governments, low emigration
1.3 SustainabilityDefinition: Ability to meet present needs without compromising future generations.
Resources:
- Renewable: Timber, soil, freshwater
- Nonrenewable: Fossil fuels, minerals
1.4 Water CycleStages:
- Through-flow: Horizontal flow in soil
- Interception: Precipitation trapped by vegetation
- Infiltration: Water movement into the soil
- Run-off: Water flowing on surface
- Evaporation: Liquid to gas
- Transpiration: Water vapor from plants
- Condensation: Gas to liquid
- Groundwater: Water stored underground
1.5 Atmosphere StructureComposition: 78% Nitrogen, 21% Oxygen
Layers:
- Troposphere: Weather and water vapor, greenhouse effect
- Stratosphere: Ozone layer, temperature increases with altitude
- Mesosphere: Coldest layer
- Thermosphere: High temperatures, auroras
1.6 EcosystemsDefinitions:
- Population: Same species
- Community: Different species
- Ecosystem: Interactions between organisms and environment
- Biome: Geographic area with similar climateComponents:
- Abiotic: Non-living (water, climate)
- Biotic: Living (producers, consumers)Trophic Levels:
- Producers: Autotrophs (photosynthesis)
- Consumers: Primary, secondary, apex predatorsEnergy Transfer: 10% transfer efficiency, 90% lost as waste.
1.7 BiodiversityIndices: Measures species richness and evenness
Simpson's Index: Ranges from 0 (no diversity) to 1 (max diversity)
2.1 Environmental Research and Climate ChangeReliable Data: Consistent and replicable results
Bias: Influences on data interpretation
Challenges: Limited historical climate data, model uncertainties
Sampling: Random and systematic sampling methods
Direct approaches for data collection: surveys, environmental observations, etc.Environmental Data Techniques:
- Quadrats and Sampling: Estimate cover, abundance, and record species
- Mark-Release-Recapture: Estimate population size for mobile species
- Observational Tools: GPS, satellite data, etc.
Population Density:
- Definition: Number of people per square mile/km.
- Influencing Factors:
- Environmental: Climate, Topography, Natural Resources, Hazards.
- Economic: Job Opportunities, Industry, Infrastructure, Cost of Living.
- Social: Social Services, Quality of Life, Cultural Identity.
- Political: Government Policies, Conflicts.
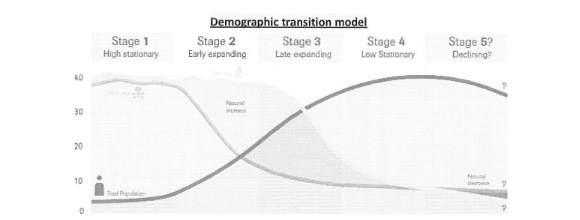
- Historical: Legacy of Settlement, Urbanization, Land Use.Population Change Factors:
- Immigration (i): Increase in population size.
- Emigration (e): Decrease in population size.
- Birth Rate (b): Births per 1,000 people/year.
- Death Rate (d): Deaths per 1,000 people/year.
- Growth Rate: Includes immigration, emigration, birth, and death rates. Natural change refers to birth and death rates only.Population Size Formula:
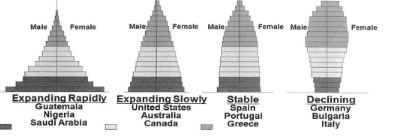
- Population Size = Population + [(Immigration + Birth) - (Emigration + Death)].Age Structure Diagram:
- Left: Males, Right: Females.
- Bottom: Pre-reproductive (0-14 years).
- Middle: Reproductive (15-64 years).
- Top: Post-reproductive (65+ years).
- Segment widths proportional to population sizes.
- Larger 0-14 cohort indicates future growth; narrower indicates decline. A wider 65+ cohort reveals longevity and better healthcare access.Dependency Ratio:
- Measures dependent population (under 15 and over 65) to working-age population (15-64).
- Higher dependency indicates economic burden on working-age group.
- Example:
- Expanding: Guatemala, Nigeria.
- Stable: United States, Australia.
- Declining: Germany, Bulgaria.High vs. Low-Income Countries (HICs and LICs):
- HICs:
- Low infant mortality; access to healthcare, education, contraception.
- Social stability; age structure: young (0-14) + older (65+).
- LICs:
- High infant mortality; lack of healthcare, education.
- High total fertility rate due to replacement births and early pregnancies.Impacts of Population Change:
- Aging populations lead to: Lower tax revenues, higher pension spending, pressure on healthcare, and increased dependency ratio.Managing Population Change:
- Improved contraception availability and education.
- Women’s health and education improvements.
- Pro-natalist Policies: Encouraging higher birth rates via financial incentives and support.
- Anti-natalist Policies: Reducing birth rates through family planning and economic disincentives.
- United Nations Agenda 21: Focuses on sustainable development and awareness.
- The Club of Rome: Advocates for awareness of population growth impacts on the environment and resources.