2.5.2 Output gaps
Use of AD/AS diagram to illustrate an output gap (level of spare capacity) in an economy
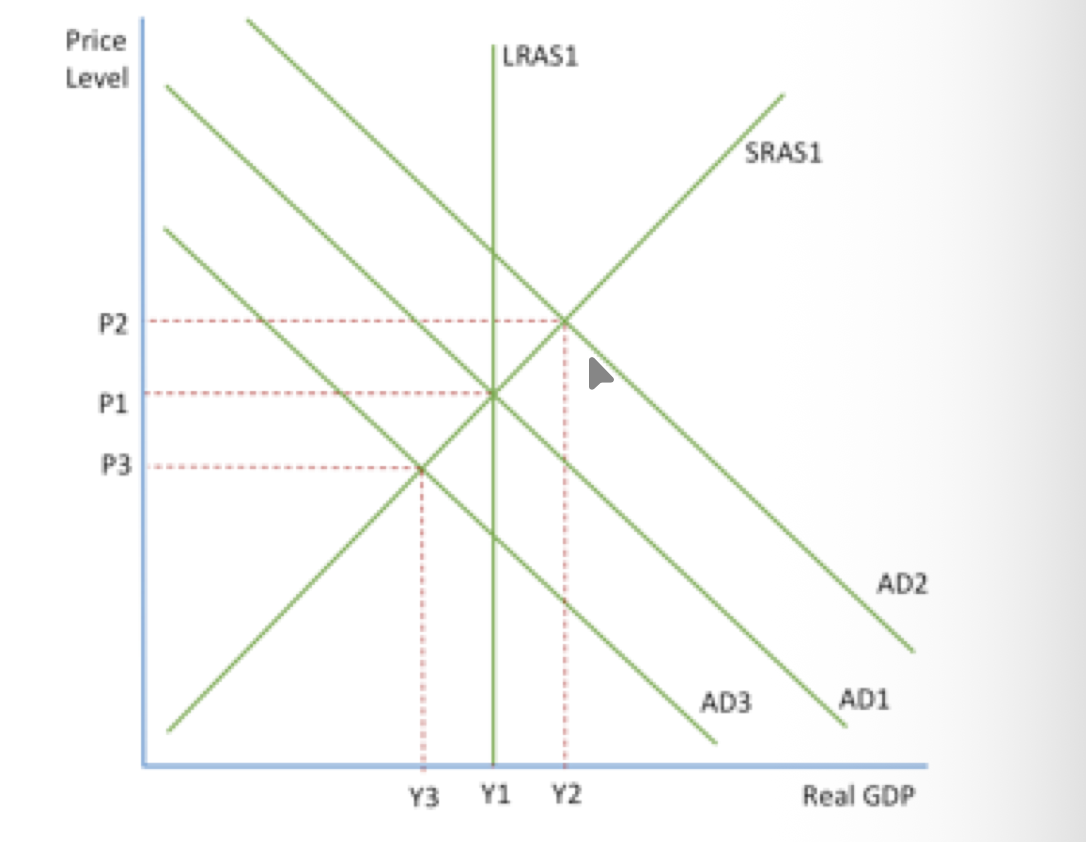
Output gaps can also bee illustrated using AS and AD diagrams. LRAS shows the full capacity output i.e. where all resources are being fully utilised and this can be linked to output gaps between the GDP trend line and actual GDP
An equilibrium to the right of the LRAS shows the economy working over capacity in the short term but to the left it shows the economy working under capacity.