APES Review
U1:
Introduction to ecosystems
ecosystem: interaction of living and nonliving things in a specific region
environment: the entire natural world
habitat: the specific environmental conditions that a given species needs to survive (environmental conditions + other organisms)
SYMBIOSIS NOT MUTUALISM
symbiosis= organisms living in close proximity to each other
mutualism: symbiotic relationship where both species benefit from the interacts
Terrestrial Biomes/Aquatic Biomes
Biome: an area that shares a consistent yearly average temp and precipitation patterns
biomes can shift as global temperatures change
aquatic biomes:
salinity (saltiness): plants/animals need to be adapted to the dehydrating effects of salt (e.g. mangroves have adaptations like pores in their leaves of thicker membranes
flow: disrupt the surface, allowing oxygen to diffuse in the water
carries sediments and with that nutrients
depth
Estuaries: where the mouth of a river empties out in the ocean
partially salt water partially fresh
huge amount of nutrient-rich sediments
Carbon cycle
Conservation of matter: matter neither created nor destroyed
reservoirs: things that temporarily store matter
sources: process that move matter around between reservoirs
sinks: reservoirs that store more matter than they give off
CARBON CYCLE
carbon sources return carbon to the atmosphere
while sinks remove carbon from the atmosphere
the amount of time carbon spends in diff reservoirs significantly varies- important to climate
photosynthesis: removes carbon from atmosphere and stores it in plant life
long lived plants can become carbon sinks
respiration: returns CO2 to the atmosphere as plants and animals break down glucose to use for energy
NITROGEN CYCLE
nitrogen cycles quickly through its resevoirs
the major nitrogen reservoir is the atmosphere
exists in a biologically unavailable form for plants and animals
nitrogen fixation: converts biologically unavailable nitrogen gas (N2) into biological forms like ammonia or nitrate
bateria with specialized enzyms fix nitrogen (in soil or symbiotic bacteria in the roots of legumes)
or lightning strikes or fossil fuel combustion
assimilation: plants taking in nitrogen and converting it into body tissues
PHOSPHORUS CYCLE
doesn’t have a gas phase, doesn’t enter atmosphere, cycles much more slowly
major reservoirs are rocks and sediments
weathering/erosion: breaking down of rocks by wind and rain and freezing and thawing of water
carried away by runoff or wind
often limiting factor of plant growth (plants have enough nutrients except phosphorus)
WATER CYCLE
driven by the energy from the sun
infiltration: water seeping thru the soil and recharging ground water reservoirs
transpiration: water evaporating from the leaves of plants
ocean is major water reservoir- but is not useable for humans
freshwater (ice caps, groundwater, rivers and lakes)
largest freshwater reservoirs are glaciers
PRIMARY PRODUCTIVITY
Primary productivity: rate at which plants in an area convert sunlight into glucose or plant tissue
Energy/area/time
e.g. 500 kilocaloris/m²/year
Respiration loss (RL): energy plant use up for their own cellular respiration
Gross primary productivity: total amount of energy plants product
net PP: energy plants offer after losing from RL
NPP=GPP-RL
TROPHIC LEVELS/ENERGY FLOW
trophic pyramid: shows how much energy flows through diff levels of food chains
primary producers
primary consumers (herbivores)
secondary consumers (predators)
tertiary consumers (predators/apex preds
Primary producers have most energy as they get directly from sun, as you move up the pyramid, there is less energy because it’s being used by organims
second law of thermodynamics: only 10% of energy from one trophic level is passed on to the next level (10% rule)
FOOD CHAINS AND FOOD WEBS
ARROWS show the movement of both energy and matter
when hawk eats the mouse, arrow points to the hawk as the energy is going from the mouse to the hawk
removal of one species can have a huge effect on other species
e.g. remove the tertiary consumer → increase in secondary consumers → decrease in primary consumers → increase in primary producers
UNIT 2
INTRO TO BIODIVERSITY
biodiversity: diversity of life forms in an ecosystem
genetic: variance of genes or traits found within individuals of a population
diversity protects species from things like diseases or environmental changes as more likely for individuals to have traits to combat or live through it
ecosystem: diversity of different types of organisms in an ecosystem
species richness: total number of species found in an ecosystem
species evenness: balance of population sizes within an ecosystem
species:
ECOSYSTEM SERVICES
ecosystem services:things natural ecosystems do that have finanical service to humans
provisioning: things direclty provided to us by nature (e.g. wood)
supporting: processes done by ecosystems that support a valuable human action (e.g. bees pollinate farmers crops, increasing their profits)
regulating: ecosystems stabilize climate or other conditions (e.g. trees sequester CO2, reduces expensive consequences of climate change)
cultural: recreational or intellectual benefits from nature (e.g. tourism or research)
DISRUPTION
drilling and transporting crude oil
decrease in fish revenue
increased storm damange
decrease in tourism (beaches covered in oil)
ISLAND BIOGEOGRPAHY
RULE 1: islands closer to the mainland have higher species richness (inverse relationship)
RULE 2: larger island habitats support more species - wider variety of plant and animals in the system (direct relationship)
islands have narrow range of habitat and food conditions- leading to specific adaptations
unable to adapt to or compete with when invasive species showed up
islands have higher percentage of specialist species than mainland
e.g. dodo birds had a lack of predators, resulting in larger body size and inability to fly
ECOLOGICAL TOLERANCE
ecological tolerance: range of conditions that an organism can tolerate before serious damage or death
optimal range: range of an environmental condition where organism can survive, grow, develop
zone of physiological stress: range of an environmental condition where an organism can survive, but suffers stress such as stunted growth or impaired reproduction
zone of intolerance: quickly leads to death
NATURAL DISRUPTIONS TO ECOSYSTEMS
periodic events: happen with regular frequency (e.g. rainy/dry seasons)
episodic events: less regular than periodic, but occur with some frequency (e.g. hurricanes, forest fires)
random events: occur with no regularity whatsoever (asteroids or volcanoes erupting)
earths climate gradually changes
impacts sea level (warmer → sea level rises)
may flood estuaries or low line coastal areas
light may not penetrate to shallow areas that become deeper
ADAPTATION
adaptation: genetic mutation that increases organism’s chance of survival
bc of genetic diversity there’s a range of traits within a species
members with
adaptation: genetic mutation that increases organism’s chance of survival
ECOLOGICAL SUCCESSION
two types
primary succession: moss and lichen colonize a bare rock (starts with nothing), can secrete acids to extract nutrients from rock, creating shallow rocky soil, allowing small plants to grow
pioneer stage→intermediate stage→climax community(shade-tolerant trees)
secondary succession: already soil present, pioneer species are grass and flowers (tends to take place after a disturbance like a forest fire)
keystone species: species so important to an ecosystem that its removal causes high ecosystem instability or even collapse
e.g. without wolves, deer may overpopulate, leading to decrease in vegetation
e.g. beavers and mangroves shape habitats that wouldn’t exist without them
UNIT 3
GENERALIST AND SPECIALIST SPECIES
specialist species: organisms with a really narrow niche, or narrow set of food or habitat requirements, more advantaged in stable ecosystems
generalist species: have a really broad ecological niche or range of food or habitat requirements (really resilient, advantage bc can easily adapt to changes)
K SELECTED/ R SELECTED SPECIES
k selected: typically live in populations that are at or near carrying capacity
few offspring
mammals
slow to reach sexual maturity
longer life spans
high level of parental care
KARE for their offspring
more likely to suffer from invasive species
advantageous where food competition is high
r selected: capable of a really high pop growth rate
quantity over quality
reach sexual maturity quickly
little to no parental care
produce large number of offspring (most don’t survive to adulthood)
high population growth rate
RUN away from offspring
advangagous when there is abundatn food resource
more likely to become an invasive species
biotic potential: max number of offspring a species can produce
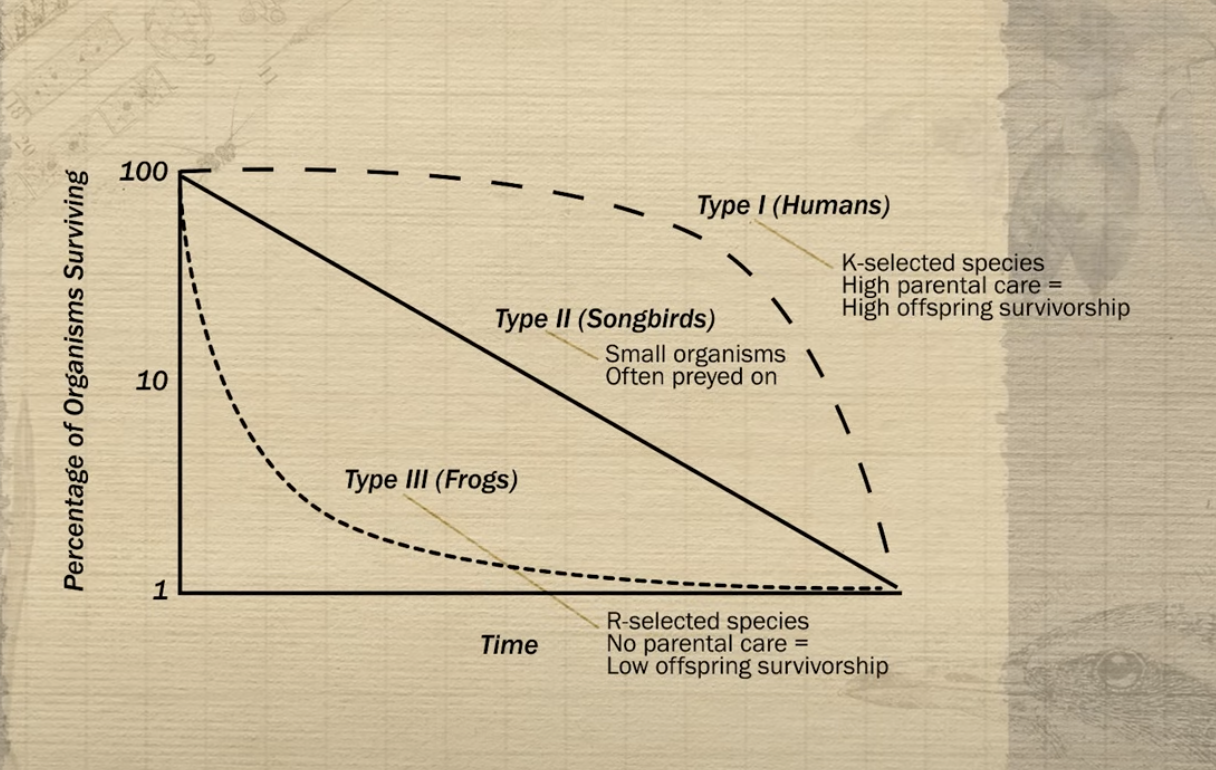
SURVIVORSHIP CURVES
survivorship: percentage of individuals of a given species that are still surviving at any point in the typical lifespan of that species
type 1 survivorship : k selected species, high parental care = high offspring survivorship (e.g. humans)
type 3 survivorship: r selected species, no parental care=low offspring survivorship (e.g. frogs)
type 2: small organisms often preyed on, some parental care (e.g. songbirds)
CARRYING CAPACITY
carrying capacity: max number of individuals of a given species that an ecosystem can support
competition for resources is a big part
limiting resources: things like food, water, shelter,that limit the number of how many individuals can survive in an ecosystem
overshoot and die off: repetitive cycle of exceeding carrying capacity →not enough resources → die back down
POPULATION GROWTH AND RESOURCE AVAILABILITY
density dependent factors: effects are greater at greater population density
density independent factors: limit population growth regardless of density (e.g. tsunami, forest fires)
uniform distribution: roughly equal space between each individual in the population
random distribution: growth depends on where the best resources are (e.g. where seeds fall, where sunlight is best)
clumped distribution: animals that form herds, or schools, or pods, for protection from predators
J-shaped curve (expontnentional)- not realistic
S shaped curve- logistic growth model- more realistic
AGE STRUCTURE DIAGRAMS
age structure diagrams: graphs that visualize the portion of a country’s population that is in each age cohort
three basic groups
prereproductive age (0-14)
reproductive age (15-44)
post-reproductive age (45+)
pre is much larger
high birth rate
high population growth rate
still industrializing
agrarian or farming economy
child labor is valuable
limited educational and economic opportunities for women
pre is slightly larger
still growing
growth is slowing down
economy is becoming more industrialized
health care and educational access are increasing
pre and reproductive are equal
population growth is verty slow
country is nearing a stable population siz
economy is likely industrialized
health care are education are widely accessible
pre is less than reproductive (bad!!)
highly developed economy
negative growth rate
low birth rate
increased life-expectancy with access to quality healthcare
TOTAL FERTILITY RATE
total fertility rate (TFR) average number of babies a woman in a population will give birth to in her lifetime
wide base on age strucutre diagram=higher TFR
high = still going industrialization, lack an education system for women -limiting their financial independence and control over their reproduction, can also be cultural or religious reasons
more industrialization →higher education for women →more job opportunities → no need for children and later pregnancy (also access to birth control)
HUMAN POPULATION DYNAMICS
crude birth rate/death rate (CBR/CDR): births and deaths per 1,000 ppl in a population
percent growth rate of a country = (CBR-CDR)/10
Rule of 70: 70/growth rate (%)
e.g. if rate is 1.037%, you do 70/1.037
infant mortality rate (IMR)
deaths of children under the age of 1, per 1,000 live births
infants especially susceptible to water-borne diseases
high IMR increases TFR, mothers have more children to replace
replacement level fertility: average children born per woman that a population would need to remain constant
developed nations rate: 2.1
developing higher than 2.1
gross domestic product (GDP): total market value of all finished goods and services produced in a country, divided by all the people living there
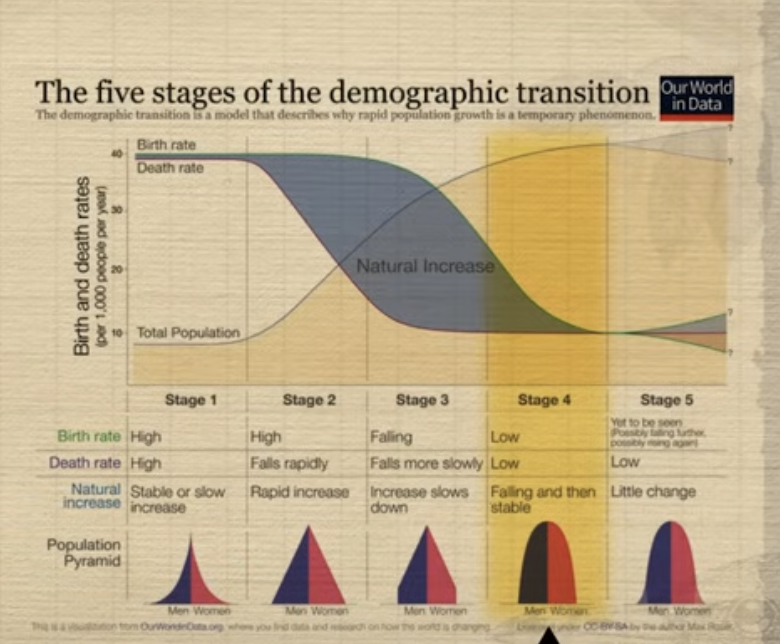
DEMOGRAPHIC TRANSITION
theory of demographic transition: over time, countries undergo industrialization- which decreases death rate and birth rate while increasing population growth and affluence
five stages (mainly first 4)
phase 1
pre-industrialized
agrarian economies
high birth rates
high death rates
little population growth
wide base in diagram, with very narrow top
phase 2
industrializing
transitioning from agrarian to manufacturing and service-based economies
stage 1 and 2 are developing countries
very high population growth
death rate falls dramatically
more of a triangle (birth rate remains high)
takes time to adjust
phase 3:
developed or industrialized
population growth slows
birth rate declining closer to the death rate
TFR approaching 2.1
phase 4:
highly developed
post industrial
TRF drops below replacement level
negative growth rate
population decline
small base (reproductive is larger than prereproductive)
UNIT 4
PLATE TECTONICS
tectonic plates: slabs of rocks or lithosphere floating on top of the mantle (magma sea- liquid from heat of earth’s core)
divergent boundary: plates move away from each other
two oceanic plates
seafloor spreading, trenches
convergent boundary: two plates collide
oceanic-continental: oceanic subducts underneath continental
volcanic mountain ranges
trenches where one plate is sliding beneath
transform pounday: two plates slide past each othre in opposite directions
earthquakes: two plates slide, but get stuck or locked, force of magma overcomes →slide all at once
SOIL FORMATION AND EROSION
soil: complex mixture of tiny particles of weathered rucks such as sand silt and clay, and organic material, and air, and water
parent material: mineral components come from weathering of rocks
organic matter (O horizon)- top layer
filled with organic material (decomposers, plant roots, partially decomposed biomass)
A horizon (top soil)
contains both organic matter and mineral components of soil
B horizon (subsoil)
little organic material
holds essential material
C horizon
rocks of parent material that have undergone very little weathering
weathering: break down of rocks into smaller pieces
erosion: movement of rock pieces by the wind and rain
removes a lot of nutrients vital to plant growth when moving topsoil
soil filters water
SOIL COMPOSITION AND PROPERTIES
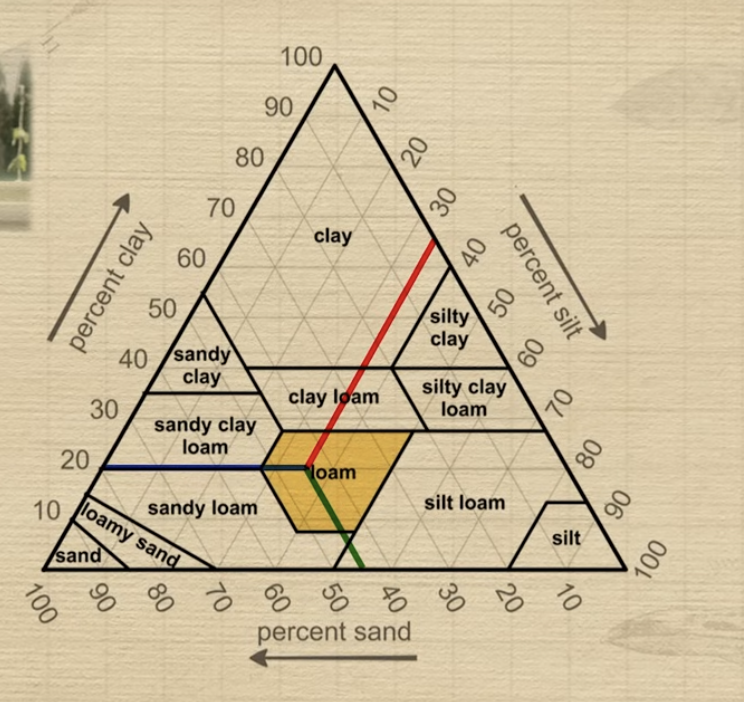
soil texture: percentage of sand silt and clay
sand: biggest particle
larger pores (empty space between particles)- allow water to drain (HIGH PERMEABILITY)
low holding capacity
slit: middle
clay: smallest particle
low permeability
tightly packed particles
high holding capacity
soil texture chart/triangle:
soil pH: measure of acidity of a soil
lower pH= more acidic and higher the H+ ion concentration
acidic soil have lower nutrient levels (H+ ions leach nutrients out of soil)
damage plants rooms by making toxic metals more soluble- can easily enter plant roots
nitrogen and phosphorus are the two biggest limiting factors for plant growth
soil fertility: ability for soil to support plant growth
EARTHS ATMOSPHERE
nitrogen, oxygen, argon, trace gases (most to least in atmosphere)
trace gases- can track heat (GHG)
troposphere: closest to earth
weather occurs here
tropo=change → constantly changing weather
stratosphere: S for second layer or saves us from the sun
ozone layer absorbs UV-B and UV-C radiation
mesosphere= middle
thermosphere= hottest layer
most direct solar radiation
northern lights
exosphere=outermost layer, merging with space
at each successive level, less and less densely packed molecules, and alternating inverse temperature levels (hot → cold → hot→ cold)
troposphere gets colder as you go up altitude (reverse relationship at each successive level)
GLOBAL WIND PATTERNS
properties of air
warm air holds more moisture than cold air
warm air rises
as air rises it experiences less pressure and it cools
water vapor in air condenses when air cools
hadley cell
sun directly hits earth (warm air) → warm air rises → warm air cools, leading to less pressure → starts to spread → sinks back down to earth 30 degrees N and S → 30 degrees has dry climate as air has lost its moistured
at 0 degrees, its rainy and low pressure
air between equator and 30 is deflected from east to west bc the earth is spinning west to east
leads to eastern trade winds (easterlies)
WATERSHEDS
watershed: an area of land that all drains into a central body of water
slope is important! determines where it goes, and how much precipitation can be runoff and how much is absorbed for plants (steeper → runoff)
amount of vegetation → more vegetation → less pollutants (more filtration)→ cleaner water
stormwater pollutants
sediment
plastic
motor oil
fertilizer
SOLAR RADIATION AND EARTHS SEASONS
insolation: amount of solar radiation an are recieves (watts per m²)
close to equator = more direct angle, concetrated area
higher latitudes → less direct radiation, spread over a large surface area
amount of atmosphere (more atmosphere in higher latitudes)
seasons happen due to earths tilt
(23.5)
at certain points o the year N or S hemisphere are closer to the sun, creating opposing seasons
june solstice
northern hemisphere maximally tilted towards the sun, opposite
longest day of the year in N, shortest day in S
tropic of cancer: suns rays hitting most directly at 23.5 N latitude
september equinox
earths tilt is parallel to the sun
day length in N and S roughly equal
most direclty on equator
december solstice
winter in N, and summer in S
opposite of june solstice
tropic of capricorn- 23.5 S latitude
march equinox
same as september basically
EARTHS GEOGRAPHY AND CLIMATE
prevailing winds move across a body of water onto a body of land, they carry a lot of moisture from evaporation of water into the air
snowbelt: high snow because winds pick up moisture from lakes
Rainshadow effect
windward side: portion of mountain that faces into the wind
recieves a lot more precipitation, because wind is carrying moisture from lake
leeward side: portion of the mountain away from the wind
drier bc air has lost its moisture
EL NINO AND LA NINA
ENSO: occurs in tropical pacific
oscillation between el nino conidtions, la nina conditions, and normal oceanic circulation
NORMAL:
trade winds blow warm surface water from E → W
lots of rainfall, low pressure to AU and SEA
upwelling: cold, nutrient-rich, oxygen-rich ocean water moves up to the surface to replace warm waters blown away by the wind
in south america
thermacline tilts E→ W: in east, cold water rises replacing warmer water
EL NINO: tradewinds weaken (and maybe reverse??)
warm surface water pooling up in SA instead of in AU and SEA
lead to flooding and landslides in SA
can lead to colder, drought like conditions in AU and SEA
hurts fisheries as suppresses upwelling
LA NINA: tradewinds stronger
greater than normal movement of warm surface water west- higher than normal temperatures in SEA and AU (cause things like flooding)
drier than normal conditions in SA (droughts), but help fisheries as increases upwelling bc more warm water is being blown westward, bring up nutrient and oxygen rich deep cold water