FOR ANACHEM FINALS
LECTURE 1: INTRODUCTION TO ANALYTICAL CHEMISTRY
ANALYTICAL CHEMISTRY - a branch of chemistry that deals with the separation, identification & determination of analytes (components) in a sample
AREAS OF ANALYTICAL CHEMISTRY :
Industrial Quality Control - requirements of companies for product quality
Bioanalytical Chemistry and Analysis - detection or analysis of biological components (e.g., proteins, DNA, RNA, carbohydrates)
Environmental Analysis - monitoring of pollutants, soil and water analysis
Forensic Analysis - criminology, DNA finger printing, finger-print detection, blood analysis (crime detection and court testimonies)
Clinical Analysis - analysis of blood, urine, feces, cellular fluids (used in medical diagnosis)
Pharmaceutical Analysis - analysis of physical properties, toxicity, metabolites, quality control, etc.
TERMS
Validate - prove that the method works and define its limitations (e.g., sample type, detection limits, interferences, concentration, sensitivity, etc)
Verify - ensure that analysts are able to obtain correct results using the method
Sample - representative of the population or gross sample
Analyte - substance to be identified, detected, or separated in some manner
Matrix - all other constituents in a sample except for the analyte
Interference - a specific component identified to be causing an effect
CHEMICAL ANALYSIS
Qualitative Analysis - an analysis to identify the material(s) present in a sample
Quantitative Analysis - an analysis to determine the amount of a material is present in a sample
Complete Analysis - amount of each constituent of the sample is determined
Partial Analysis - amount of a certain selected constituent in a sample is determined
CLASSIFICATION OF CONSTITUENTS IN A SAMPLE
Major (more than 1%)
Minor (0.1 to 1%
Trace (less than 0.1%)
Ultra trace (a few ppm or less)
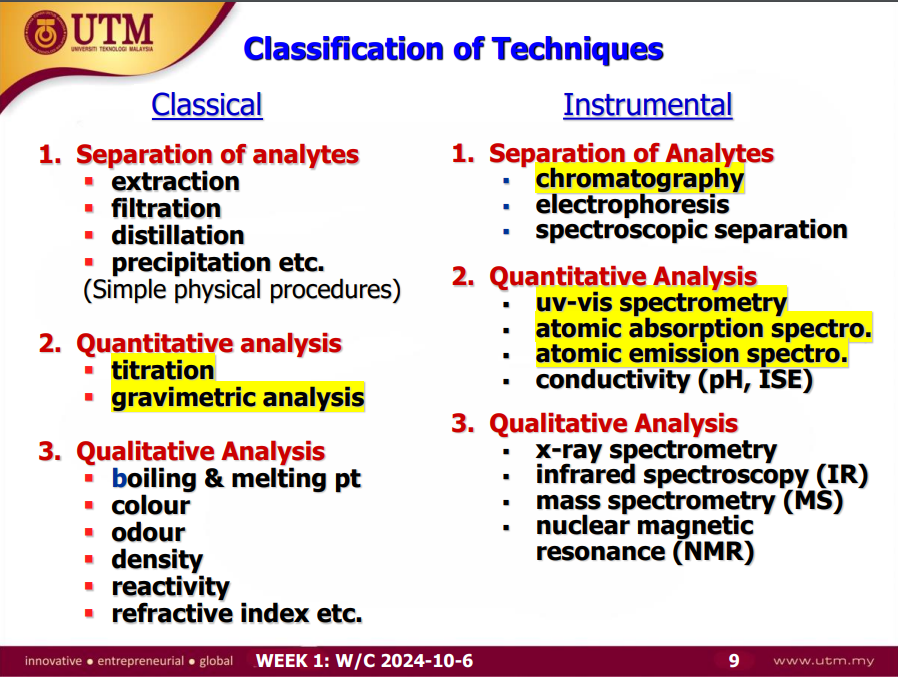
CLASSIFICATION OF ANALYTICAL METHODS
Instrumental Methods
Spectroscopic Methods - measure the interaction between analyte and electromagnetic radiation or the production of radiation by an analyte
Separation/Chromatographic Methods - measure peak areas of the separated components of a sample
High Performance Liquid Chromatography
Gas Chromatography
Electroanalytical Methods - measure an electrical property which is chemically related to amount of analyte
Classical Methods
Gravimetric Methods - measure mass of the analyte or a compound chemically related to the analyte
Volumetric Methods - measure volume of a solution containing sufficient reagent to react with the analyte
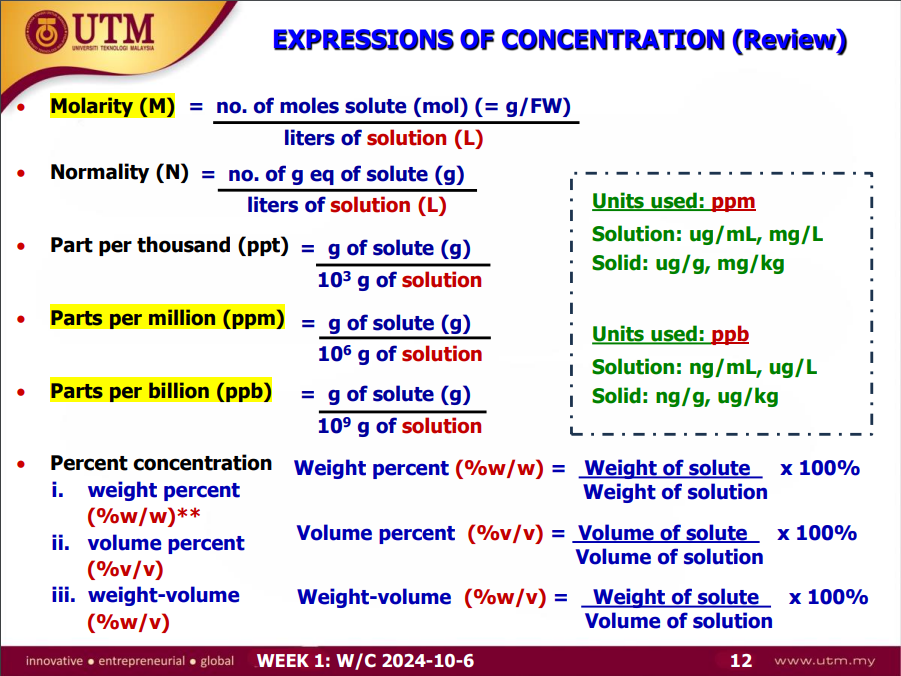
EXPRESSIONS OF CONCENTRATION
Concentration - the amount of solute in a known amount of solution (solute + solvent) with the formula: amount of solute / amount of solution
STEPS OF ANALYTICAL PROCESS
THE ANALYTICAL TRAIN:
PROBLEM DEFINITION
identify problems and formulate questions
need to translate general questions into specific questions which will be answered by chemical measurement
LITERATURE REVIEW / SEARCH
availability of methods or “standard methods” (e.g., journals, APHA, EPA, BS, ASTM Book of standards, methods of the AOAC, SIRIM, NIOSH Methods)
IN HOUSE METHOD - adopted from standard method with minor changes
COOKBOOK - analysis run by the instrument purchased
METHOD SELECTION
sample type, sample size & preparation required
skill and training of analyst
tools/instruments, standard solutions available
selectivity, precision, sensitivity required
cost and speed
time required
need In -situ testing?
IN-SITU Testing - refers to testing methods that are carried out directly on the ground, rock, or soil at a particular site
SAMPLING
the process to obtain a small representative and homogenous people
the MOST CRITICAL STEP because it can limit the accuracy of measurements
REPRESENTATIVE - content of analytical sample reflects content of bulk sample
HOMOGENOUS - content is the same throughout the whole sample
requires storage and preservation steps
sampling methods depends on the samples’ type, size and homogeneity, physical, and chemical states
SAMPLING STEPS:
Identify population
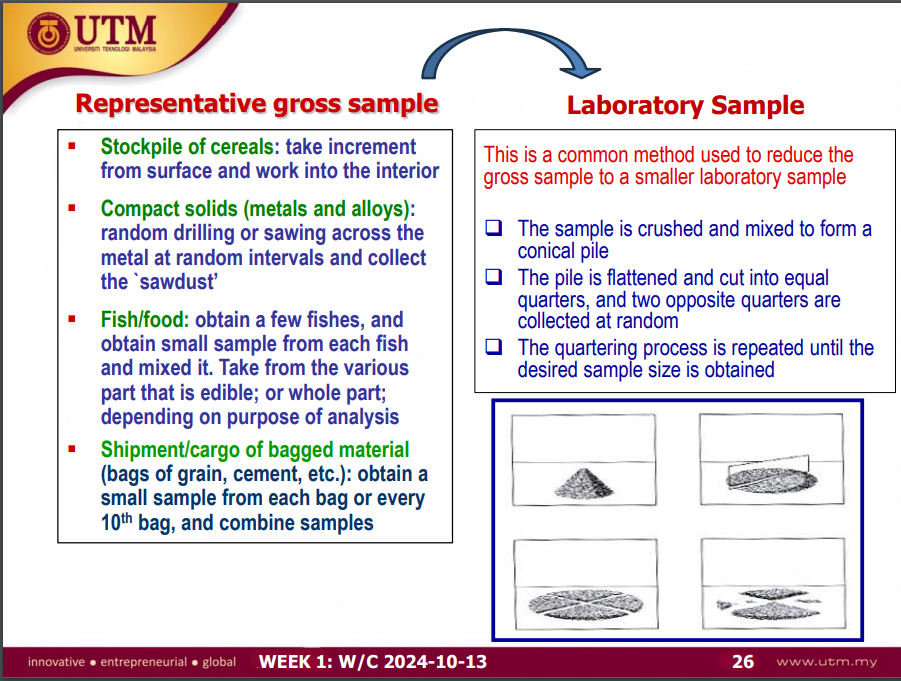
Collect a gross representative
Reduce gross sample to laboratory sample
COMMON SAMPLING METHODS:
GRAB SAMPLE - A portion of sample removed from the population
COMPOSITE - several grab samples combined to form a single sample
HETEROGENEOUS PARENT SAMPLES - several samples have to be taken
SAMPLING SOLIDS:
PROBLEM: Solid materials are heterogenous making sampling difficult
SOLUTION: Homogenization of Solid Samples
HOW? : By crushing, pulverizing, grinding, or rendering the sample into a thoroughly mixed powder
WHY? : The smaller the particle size of the sample, the lower the error in analysis. The more homogenous a sample is, the easier for digestion and extraction.
EXAMPLE: QUARTERING PROCESS
SAMPLING LIQUIDS:
Liquids are mostly homogenous and are easier to sample
REMINDERS:
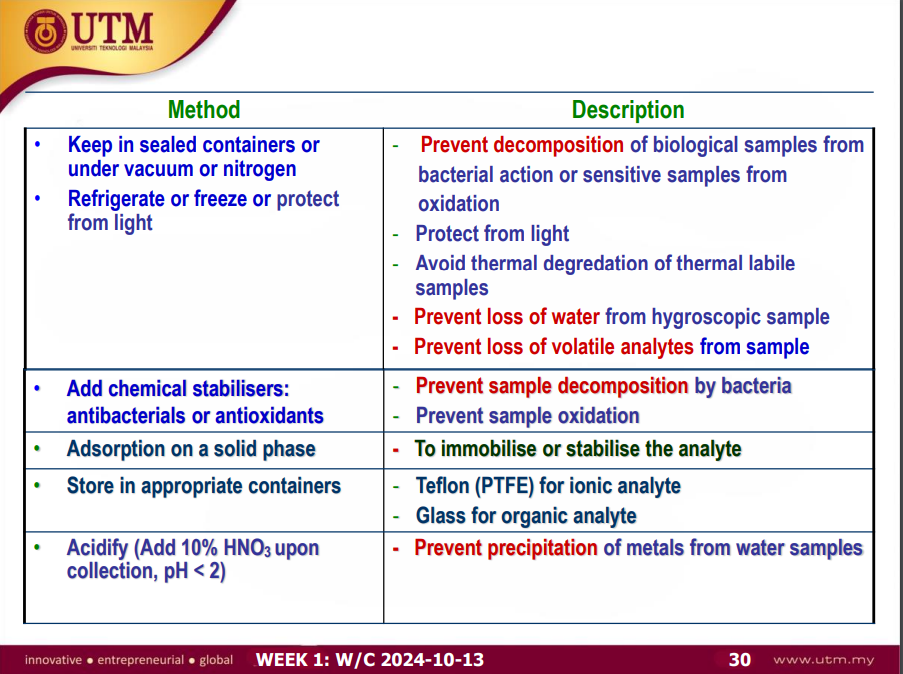
If necessary, add antibacterials (to prevent sample decomposition by bacteria), antioxidants (to prevent sample oxidation), and acidify (to prevent precipitation of metals from water samples.
If sample is non-homogenous and in small quantity, SHAKE AND SAMPLE IMMEDIATELY
If sample is from large stationary liquids such as lakes, sample at DIFFERENT DEPTHS using a thief sample
THIEF SAMPLER: a special device for obtaining aliquots at different level
If sample are biological fluids, the TIMING of sampling is very important (e.g., blood sample after fasting to analyze sugar)
SAMPLING GASES:
Gases tend to be homogenous and a large volume of a sample is required
WHY LARGE VOLUMES?: because of low density
EXAMPLE:
Air Analysis - use “Hi-Vol” sampler that contain filters to collect PM10
Activated carbon as adsorbent
Liquid displacement method: sample must be slightly soluble in the liquid and does not react with it
Breath sample: subject blows into an evacuated bag
USE TEDLAR BAGS to collect gas samples
SAMPLE STORAGE AND PRESERVATION - gross sample must be transported from sampling site to lab without any physical changes (adsorption, diffusion, volatilisation) or chemical changes (oxidation and microbiological degradation)
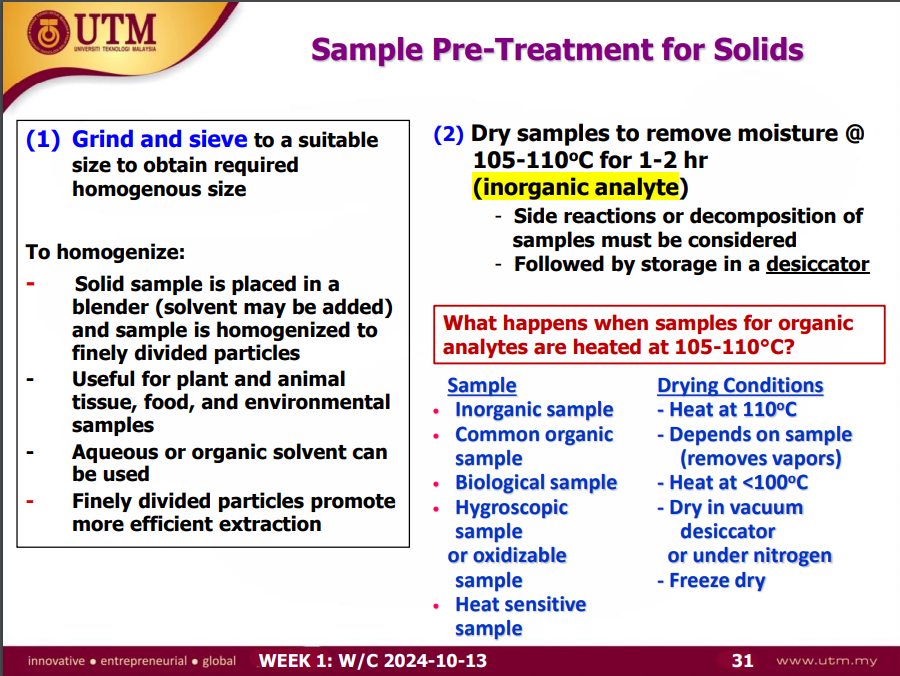
SAMPLE PRE-TREATMENT FOR SOLIDS: (1) Grind and sieve (2) Dry samples to remove moisture
SAMPLE PREPARATION
different for inorganic analyte and organic analyte
please see lecture 7 for the analysis preparation of inorganic analytes (acid digestion, microwave digestion, dry and wet ashing) and lecture 13 for the analysis and preparation of organic analytes (LLE, SPE, Soxhlet)
basically the step where the sample is prepared before used in various instruments (AAS and ICP for inorganic and GC and HPLC for organic)
ANALYSIS
External Standard Calibration Method
Standard Addition Method
Internal Standard
CALCULATION AND REPORTING
determine the concentration of the analyte in the analytical sample solution
use results to calculate the amount of analyte in the original (bulk) sample
Evaluate the results thru the appropriate use of statistics (must be reasonable, reliable and related to the problem
report results with accuracy and precision (include SD and mean) as well as conclusions
verify reports
LECTURE 2: INTRODUCTION TO SPECTROSCOPY
Spectroscopy - the study of the properties of matter through its interaction with different frequency components of the electromagnetic radiation
By describing light as waves, the optical properties or characterization of light are explained. This corresponds to frequency and wavelength: v = c/lambda, where v is frequency, c is the velocity of light, and lambda is the distance of one cycle
By describing light as particles, or photons (have no mass yet carry a specific amount of energy), interactions between radiation and matter (absorption and emission) are described.
EMR consists of quantum of energy: E = hv = hc/lambda, where h is the Planck’s constant
The shorter the wavelength, the higher the E
INTERACTIONS OF MATTER WITH ELECTROMAGNETIC RADIATION
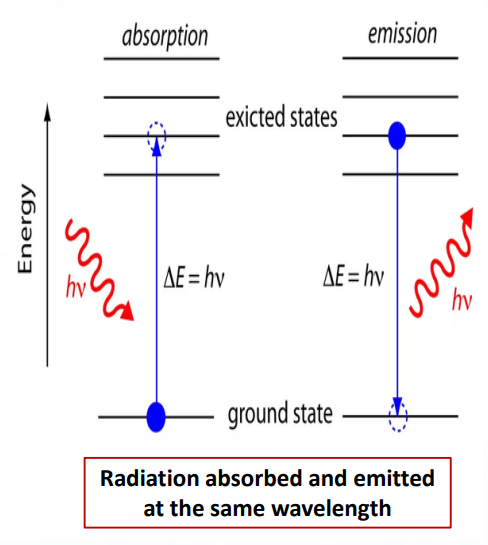
Absorption (to take up) - a transition (EXCITATION) from a lower energy state (level) to a higher state with transfer of energy from radiation field (flame) to an absorber (atoms of a metal)
Emission (to give off) - a transition (RELAXATION) from a higher energy state to a lower level with transfer of energy from the emitter to the radiation field.
Scattering - a redirection of light due to its interaction with matter
SPECTROSCOPY AND SPECTROMETRY METHODS
MOLECULAR
study of the light interactions with molecules
molecules can absorb (absorbed by bonding electrons), emit and scatter light
all these interactions allow us to know the identity and structure of substance (e.g., IR, NMR)
EXAMPLE: UV-Vis Spectroscopy
ATOMIC
measurement of the wavelength or intensity of light that is emitted or absorbed by free atoms (absorbed by valence electrons)
to do this type of measurement, a sample must be converted into atoms
EXAMPLES: AAS, AES, ICP
CHARACTERISTICS OF WAVELENGTHS ABSORBED AND EMITTED
depends on the identity of the compound
depends on the amount of analyte present in the light path
remains the same regardless of the quantity of the analyte present
INTERFERENCES
Spectral - absorption or emission of other components of the matrix that occur at the same wavelength of use for analysis
Chemical - materials determined are not in the same chemical or suitable form
Instrumental - excess illumination due to imperfections in the instrument
REMEMBER:
The color transmitted or the color we see is the complement of the absorbed light in the color wheel
Only transmissions within the visible region (350 - 750 nanometer) is visually seen with colors
The absorbed radiation is electronically measured
BEER’S LAW
FORMULAS:
Transmittance (T) = P (transmitted radiation, power out) divided by P0 (incident radiation, power in)
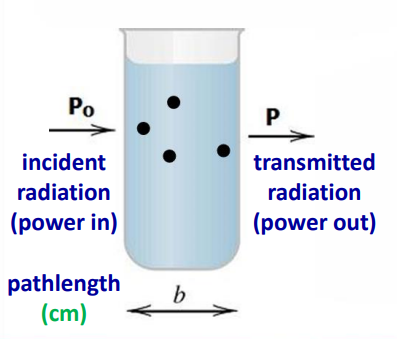
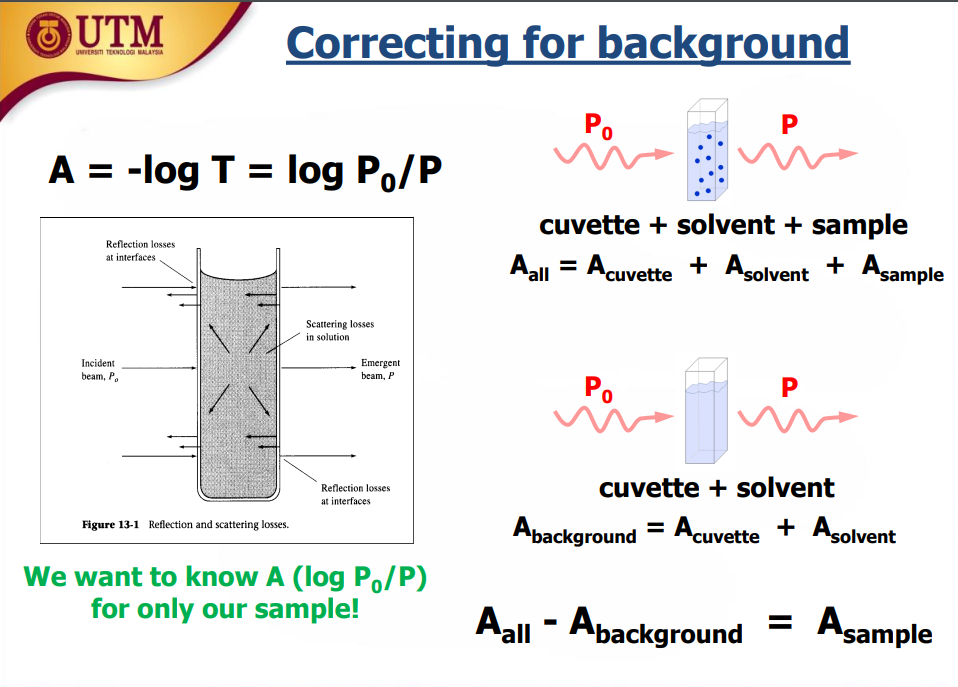
Absorbance = - log of T = log of [P0/P]
A = ebc
where e is molar absorptivity with unit L/mol-cm
A is the absorbance (unitless)
b is the path length (cm)
c is the concentration (mol/L)
As light passes through an analyte in solution, the intensity of the light is reduced. The lesser the transmittance, the higher the absorbance.
Absorbance is proportional to pathlength and concentration. The longer the pathlength and the higher concentration, the higher the absorbance.
DEVIATIONS FROM BEER LAMBERT LAW
Deviations occur when plotting Abs vs Conc does not produce a straight line
SPECTRAL DEVIATION
Polychromatic Radiation - Beer’s only apply when measurements are made with monochromatic source radiation.
If analyte absorbs at 635 nm with 10 nm bandwidth, it will absorb between 630-640 nm.
If slit width is large, allowing wavelength between 610-660 nm, matrix will absorb at wavelength outside the bandwidth.
This will result in an unintended higher absorption since it would also absorb matrices at the additional wavelength
Higher absorbance than normal will result to a positive deviation from the curve
Stray Radiation - results from scattering, and reflection off the surface of gratings, lenses, etc. The radiation may not have passed through the sample but detected by detector. This will result in an unintended increase in P and a decrease in absorbance. Such behavior results in a negative deviation.
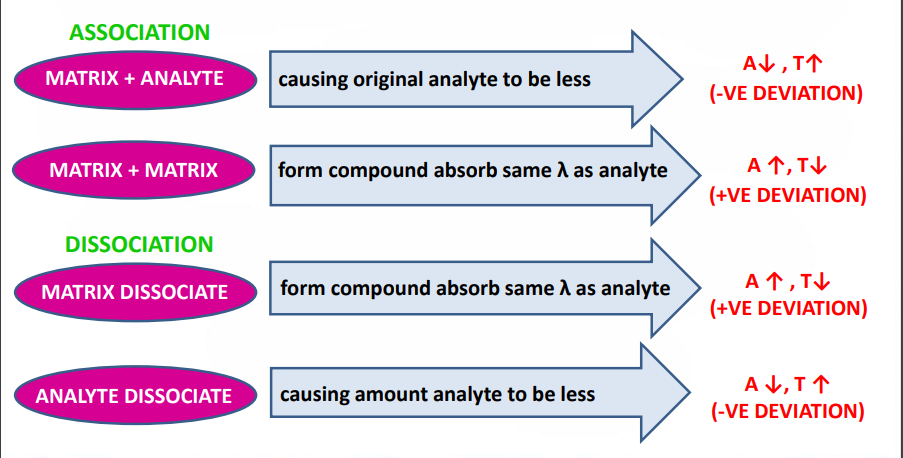
CHEMICAL DEVIATION
concentration changes
arise when an analyte dissociates, associates, or reacts
LECTURE 3: PRINCIPLES OF UV-VIS
Vacuum UV has a wavelength of less than 200 nm
UV has a wavelength of between 200 to 380 nm
Visible region has a wavelength of between 380 to 780 nm
SUBSTANCES can detect and quantify UV because the chromogen has chromophore.
CHROMOPHORE - substituent (atom or group of atoms) in a molecule that absorb light (radiation is not absorbed by all atoms in the molecule)
Chromophores in which the groups have pi electrons undergo pi - pi star transitions. (ex: ethylenes, acetylenes)
Chromophores having both pi electrons and n (non-bonding electrons undergo two types of transitions: pi to pi star and n to pi star. (carbonyls, nitriles, azo compounds and nitro compounds)
FACTS TO REMEMBER:
Color arises when a molecule absorbs certain wavelengths of visible light and transmits or reflects others
UV and visible light that hits the chromophore can thus be absorbed by exciting an electron from its ground state into an excited state
CHROMOGEN - molecule containing chromophore
Molar absorptivity (e) may be very large for strongly absorbing chromophores (>10 000) and very small if absorption is weak (10-100). In other words, e increases as absorption of chromophores increases.
Conjugation increases molar absorptivity. One of the most important factors affecting the wavelength of absorption by a molecule is the extent of conjugation. The increase in size of the conjugated system gradually shifts the absorption maxima (λmax) to longer wavelength
CONJUGATION - having alternating double and single bonds
ELECTRONS are responsible for most UV-Vis electronic transitions
UV-VIS ELECTRONIC TRANSITIONS:
n to pi star transitions
an electron of unshared electron pair is excited to pi star antibonding orbital
this transition involves the least amount of energy than all the transitions
therefore, this transition gives rise to an absorption band at longer wavelengths
pi to pi star transitions
this transition is available in compounds with unsaturated centres (e.g., simple alkenes, aromatics, carbonyl compounds)
this transition requires lesser energy than transition in a simple alkene
CONJUGATION
Bathochromic (red shift) - to longer wavelength
Hypsochromic (blue shift) - to shorter wavelength
Hyperchromic - to greater absorbance
Hypochromic - to lower absorbance
ABSORPTION OF UV by INORGANIC COMPOUNDS
By inorganic species - ions and complexes of elements in first two transition series
Absorb broad bands of visible radiation in at least one of their oxidation states, and are colored,
Absorption is between filled and empty d-orbitals
Charge Transfer Absorption - by charge transfer complexes (CTC)
Absorption has large molar absorptivity (>10000)
CTC consists of an electron-donor group bonded to an electron transfer.
Electron pair from donor is transferred to acceptor orbital
e.g., Iron III complex with 1,10 phenanthroline, Iron III with thiocyanate
In metal ion complexes, the metal ion serves as the electron acceptor
AUXOCHROMES - substituent groups which are not themselves optically active in the UV-Vis energy range but interacts with other chromophores to increase intensity and shift to higher wavelength. (e.g., hydroxyl, amines, halogens)
They provide unshared electrons that interact with pi electrons in the chromophore (n to pi conjugation)
INSTRUMENTATION
LIGHT SOURCES
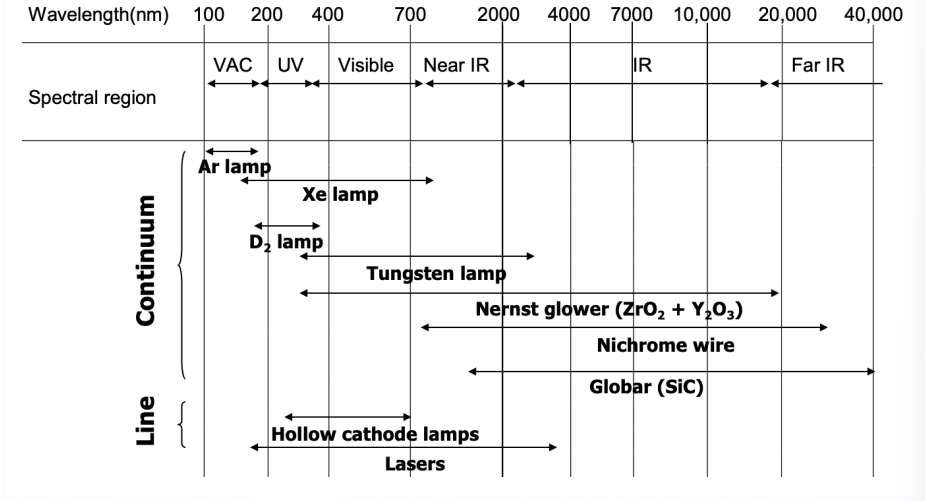
Deuterium and hydrogen lamp - covers UV: 200 - 330 nm
Tungsten lamp - covers UV-Vis: 330 - 700 nm
Xenon arc lamp - covers UV-Vis: 330 - 700 nm
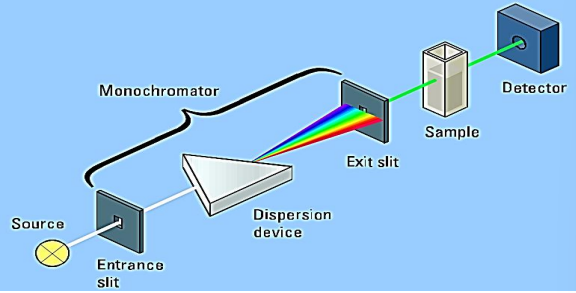
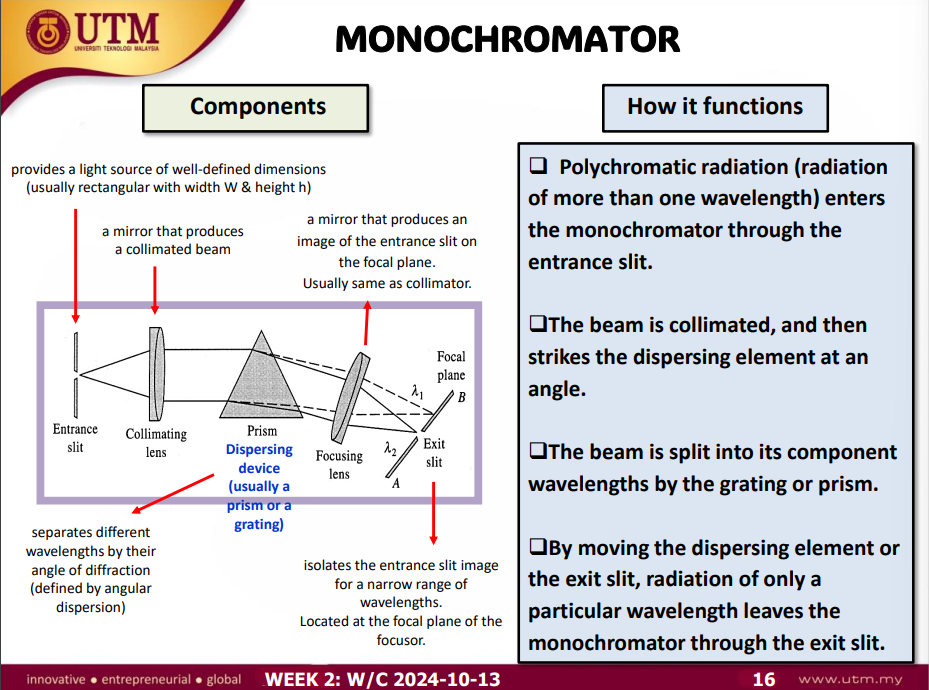
MONOCHROMATOR / WAVELENGTH SELECTOR
Photometer
uses filters to select wavelength
only detect a single wavelength at a time
has two types: Interference and Absorption
INTERFERENCE: remove selected wavelength by internal destructive interference and reflection
ABSORPTION: absorb unwanted wavelength
provide low resolution wavelength selection
suitable for quantitative work
wavelength cannot vary continuously
Spectrophotometer
uses monochromator to scan various wavelengths
input may be a continuum source or a line source
has two types: Grating and Prism
GRATING: uses diffraction, often producing a sharper line spectrum
PRISM: uses refraction, creating a continuous spectrum
produce high resolution
qualitative and quantitative work
wavelength can vary continuously
SAMPLE CELL
Cells (cuvettes) are selected appropriately based on wavelength requirements
Quartz (fused silica) - UV/Visible (>210 nm)
Silicate glass - Visible (>350 nm)
Plastic - Visible (>300 nm)
PRECAUTIONS ON USING THE CUVETTE:
Keep the cuvette clean
Don’t clean with paper products - use optical paper
Store dry. Store carefully and gently
Don’t get fingerprints on them.
Use the same sample cell during running the blank, standard and sample.
QUESTION: How does the following affect the sensitivity of the analysis?
Different pathlength size and shape - A longer path length allows more opportunities for the light to interact with the sample, resulting in higher absorbance values
Different material - Quartz has the capability of more light transmission and is more transparent. So, it is used for sensitive experiments. Besides, quartz is more temperature resistant. At the same time, glass and plastic cuvettes are not ideal for concentration and purity measurements.
Old or new - cuvettes used should be consistent especially when running the reference and sample whether it is new or old
THE SAMPLE SOLVENT - How does solvent choice impact UV-Vis spectroscopy readings?
SOLUBILITY - undissolved solutes can form aggregates or precipitates that can distort the absorption spectrum. Solute should be highly soluble in chosen solvent.
HYDROGEN BONDING - Hydrogen bonding or polar solvents interact more strongly with unshared electron pairs of the ground state molecule. This results to a greater stabilization of ground state molecules than excited ones. Thus, needing more energy required for the n to transition to pi star. MORE POLARITY, MORE ENERGY NEEDED. This also results in a blue shift.
SOLVENT ABSORPTION - Solvent must not absorb light in the same region as the solute. Solvent must be transparent in this region so that it will not interfere with the measurement and will result to a more accurate result.
IONIC STRENGTH - increasing ionic strength (increasing the concentration of solvent) shifts the maximum absorption peak towards blue while decreasing molar absorptivity, which is why the concentration of solvent is typically less than 50 mM.
PI STACKING - increases the absorption wavelength (red) since the intermolecular overlap of pi-orbitals causes excitation delocalization.
SOLVENT must also be inert or unreactive with the analyte
DETECTORS
PHOTOMULTIPLIER TUBE (PMT)
detects one wavelength at a time
Photon of radiation enters tube and strikes the cathode.
Cathode strike causes the emission of several electrons.
Electrons are accelerated towards first dynode (90 V more positive than the cathode)
Electrons strike the 1st dynode and emits several electrons for each incident electron
This electrons are accelerated towards second dynode to produce more electrons which will be accelerated towards third dynode, and so on.
The electrons will eventually be collected at the anode. By this time, each original photon has produced 106-107 electrons.
The resulting current is amplified and measured
There are detectors that can do full spectra detection such as CCD and diode arrays:
SOURCE - SAMPLE - MONOCHROMATOR - AREA DETECTOR
There are also detectors that do single wavelength detection such as the PMT
SOURCE - MONOCHROMATOR - SAMPLE - POINT DETECTOR
RECORDER / READOUT
UV - VISIBLE SPECTRUM - a plot of absorbance versus wavelength of a sample at different concentrations
SINGLE BEAM
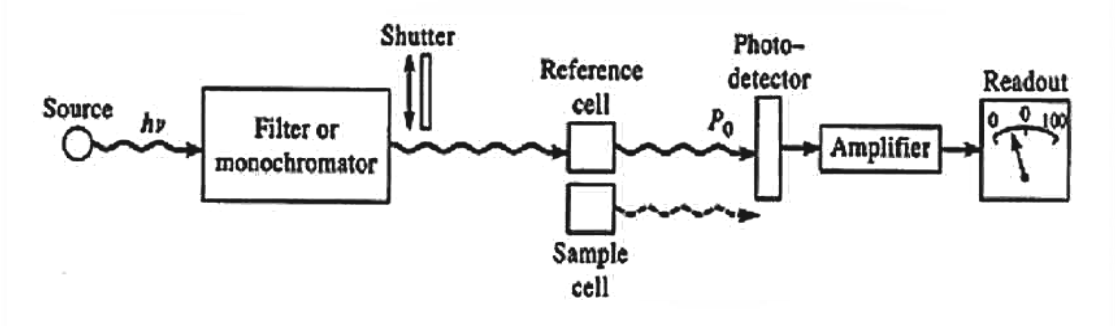
employs a single source to supply radiation to the sample and then the background in turn
ADVANTAGE - single set of components required (complex devices may be incorporated)
DISADVANTAGE - separate correction must be done for background spectrum due to solvent or matrix interferences (longer time)
DOUBLE BEAM
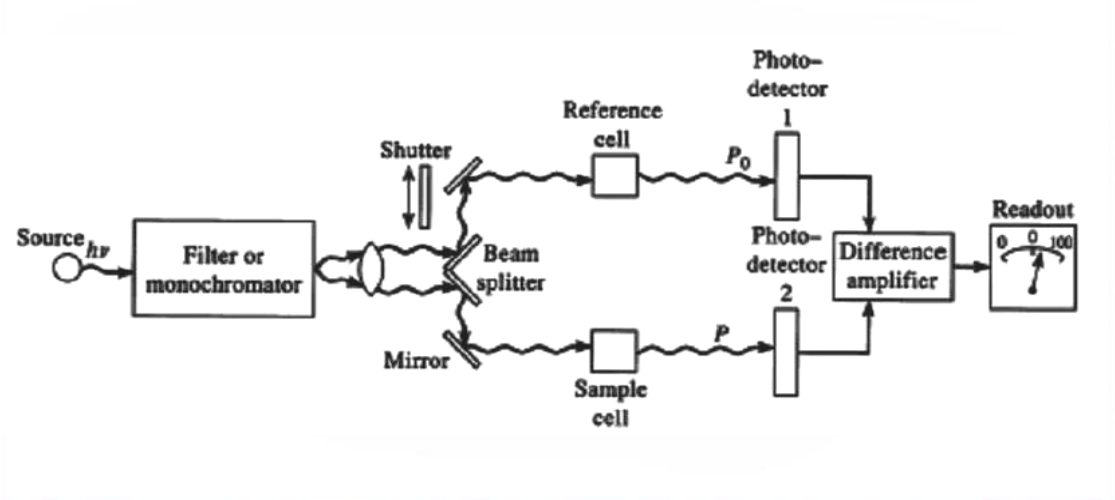
a single source sup[plies equal intensity beams through the sample and reference, which are then dispersed and detected alternately.
REMINDERS IN GENERAL PROCEDURE OF UV-VIS SPECTROSCOPY
Run a blank. This is done because the matrix, solvent, buffer might have their own absorbance.
Run standards for calibration plot for quantification analysis
Run quality control to check for accuracy
Run samples
In DUAL BEAM: simultaneous measurement of reference cell eliminates absorbance of background
IN SINGLE BEAM: it is required to measure the reference spectrum and subtract it from sample spectrum
Use the same cuvette because cuvettes have different sizes and lengths. Consistency is very crucial when it comes to reading for result accuracy. Using the same cuvette will ensure the same optical conditions.
HOW TO DO BACKGROUND CORRECTION:
LECTURE 4: PRINCIPLES OF AAS AND AES
Atomic Spectrometry - techniques for determining the elemental composition of an analyte by its electomagnetic or mass spectrum
ATOMIC SPECTROMETRY METHODS
Optical Spectrometry
AAS
F-AAS
GF-AAS
HG-AAS
AES
F-AES
ICP-OES
Mass Spectrometry
ICP-MS
INSTRUMENTATION OF ATOMIC SPECTROMETERS
EXTERNAL LIGHT SOURCES
Hollow Cathode Lamp (HCL)
the source of light is made from tungsten anode and cathode is composed of the element being measured
each analyzed element requires a different lamp
can be a single lamp or multielemental
Electrodeless Discharge Lamp (EDL)
made of metal/salt of interest sealed in a quartz tube filled with Ne or Ar at low pressure
energized by a field of radio frequency or microwave radiation for ionization of Ar to give a high frequency accelerated component
EDL has two advantages: (1) able to use light-generating substances that would react with metal electrodes in normal lamps, (2) have extended bulb life
EDL is much more intense and sensitive than HCL. Hence, it has better precision and lower detection limit for an intensity limited analysis
LIGHT CHOPPER
placed between the HCL and the flame
light is “chopped” with a rotating half-mirror beam-splitter device
this helps differentiate between the light absorbed by the sample and the emission from the flame, which can interfere with measurements
this also modulates the light beam improving its sensitivity and selectivity
SAMPLE INTRODUCTION
samples are dissolved in water
a flame is created, using ethyne and oxygen fuel (aka oxidant fuel)
aspirator sucks the liquid into the small tube from the sample container
fine aerosol is created and is mixed with fuel and oxidant for introduction into flame
the liquid is transferred to the flame where the sample undergoes atomization
the metals then absorb light from the source
MONOCHROMATOR
DETECTOR