Unit 2: The Price System & the Microeconomy
Demand & Supply Curves
Demand
Definition: The quantity of a good or service an individual is willing and able to purchase over a range of prices over a period of time.
Law of Demand: For most goods and services, the quantity demanded is inversely proportional to its price. As prices decrease, the quantity demanded typically increases, and conversely, as prices rise, the quantity demanded usually falls.
Exceptions to the Law of Demand
Veblen Goods: Defines “theory of luxury class.” Luxury items that show wealth - when price rises, demand rises. Also called “conspicuous consumption.”
Bandwagon Effect: Consumers tend to purchase a good or service because others are doing so, leading to an increase in demand as more people are attracted to the trend.
Giffen Goods: Inferior goods that have no substitutes. So, demand increases as the price rises, typically due to the loss of income.
Supply
Definition: The quantity of a good a producer is willing and able to offer for sale over a range of prices, over a given period of time.
Law of Supply: For most goods and services, the quantity supplied is directly proportional with its price.
If Price Rises→ Quantity Supplied Rises
If Price Falls→ Quantity Supplied Falls
Determinants of Demand & Supply
Shift of Demand Curve
Demand Condition Being Assessed | Rise in Demand → Shift to the Right | Fall in Demand → Shift to the Left |
|---|---|---|
Income | Normal Goods: Rise in Income; Inferior Goods: Fall in Income | Normal Goods: Fall in Income; Inferior Goods: Rise in Income |
Relationship of Goods | Substitute’s price rises; Complement’s price falls | Substitute’s price falls; Complement’s price rises |
Tastes & Preferences | More Advertising → Product becomes more Attractive | Less Advertising → Product becomes less Attractive |
Speculation | High Speculation that Good’s price will Rise | High Speculation that Good’s price will fall |
Population | Increase in Good’s Target Population | Fall in Good’s Target Population |
Income Distribution | More even distribution of income (Income Equality) | Less even distribution of income (Income Inequality) |
Shift of Supply Curve
Supply Condition Being Assessed | Rise in Supply → Shift to the Right | Fall in Supply /→ Shift to the Left |
|---|---|---|
Costs of Production | Lower wages (cheaper raw materials) | Higher wages (costlier raw materials) |
Resource Availability | Discovery of Ore Deposits | Trade Embargoes |
Climate Weather | Good Weather Conditions | Bad Weather Conditions |
Technology | Improvements in Technology | N/A |
Government Regulation | Minimum Government Regulation | Excessive Government Regulation |
Taxes & Subsidies | Less Taxes; More Subsidies | More Taxes; Less Subsidies |
Elasticity
What is Elasticity?
Definition: Elasticity measures how a change in one economic variable affects others, crucial in understanding demand and supply dynamics.
Types of Demand Elasticity
Price Elasticity of Demand (PED): Measures responsiveness of quantity demanded when the price of a product changes.
Cross Elasticity of Demand (XED): Measures the responsiveness of demand for one product when the price of another product changes.
Income Elasticity of Demand (YED): Measures how demand changes with a change in consumer income.
Price Elasticity of Demand (PED)
Formula:
PED = \frac{% \text{ change in quantity demanded}}{% \text{ change in price}}Sign of PED:
Always negative. Indicates an inverse relationship between price and quantity.
Interpretation of PED Values
PED > 1: Demand is relatively price elastic (responsive to price changes).
PED < 1: Demand is relatively price inelastic (less responsive to price changes).
Zero PED: No effect on quantity demanded regardless of price change (perfectly inelastic).
Infinite PED: Demand is perfectly elastic; any price change will result in infinite change in quantity demanded.
PED = 1: Unitary elastic; proportional changes in price lead to proportional changes in demand.
Practical Examples
Car Stereos: If PED = -0.2, a 5% price increase leads to a 1% decrease in quantity demanded (inelastic).
Designer Suits: If PED = -2, a 5% price increase leads to a 10% decrease in quantity demanded (elastic).
Determinants of Price Elasticity of Demand
Number and Closeness of Substitutes: More substitutes yield higher price elasticity (e.g., soft drinks).
Necessity vs. Luxury: Necessities tend to be inelastic while luxuries are more elastic.
Time Period: Consumers adapt slowly to price changes; hence, elasticity increases over time.
Proportion of Income: Products which represent a larger share of consumer income tend to have more elastic demand.
Applications of Demand Elasticities
Government Tax Revenues: High taxes on inelastic products (e.g., necessities) can maximize tax revenue.
Pricing Strategies: Understanding PED can aid in setting prices wisely to maximize revenue.
Income Elasticity of Demand (YED)
Definition: Measures how demand changes with changes in income.
Interpretation:
YED > 0: Normal goods.
YED < 0: Inferior goods.
YED > 1: Superior goods or luxury items.
0 < YED < 1: Basic necessities.
Cross Elasticity of Demand (XED)
Definition: Measures how the quantity demanded for one product changes in response to the price change of another product.
Substitutes (XED > 0): Price increase of one increases demand for the other.
Complements (XED < 0): Price increase of one decreases demand for the other.
Price Elasticity of Supply (PES)
Definition: Measures how much quantity supplied increases in response to price increase.
Interpretations:
PES > 1: Supply is elastic; quantity supplied increases more than price.
PES < 1: Supply is inelastic; quantity supplied increases less than price.
Factors Affecting PES
Time Period: Long term allows more response to price changes.
Excess Production Capacity: More capacity allows for increased supply.
Skill of Labor: Highly skilled labor can adapt production quicker.
Strategies for Firms to Improve PES
Invest in spare capacity.
Utilize overtime for labor.
Outsource production to meet demand increases.
Price Elasticity of Demand (PED): Measures responsiveness of quantity demanded when the price of a product changes. Example: Restaurant meals.
Cross Elasticity of Demand (XED): Measures the responsiveness of demand for one product when the price of another product changes. Example: Coffee and tea.
Income Elasticity of Demand (YED): Measures how demand changes with a change in consumer income. Example: Luxury cars as superior goods versus basic grocery items as necessities.
Interpretation of PED Values
PED > 1: Demand is relatively price elastic (responsive to price changes). Example: Designer handbags.
PED < 1: Demand is relatively price inelastic (less responsive to price changes). Example: Salt.
Zero PED: No effect on quantity demanded regardless of price change (perfectly inelastic). Example: Insulin for diabetics.
Infinite PED: Demand is perfectly elastic; any price change will result in infinite change in quantity demanded. Example: Highly competitive commodities.
PED = 1: Unitary elastic; proportional changes in price lead to proportional changes in demand. Example: A specific brand of soda reduces its price.
Consumer & Producer Surplus
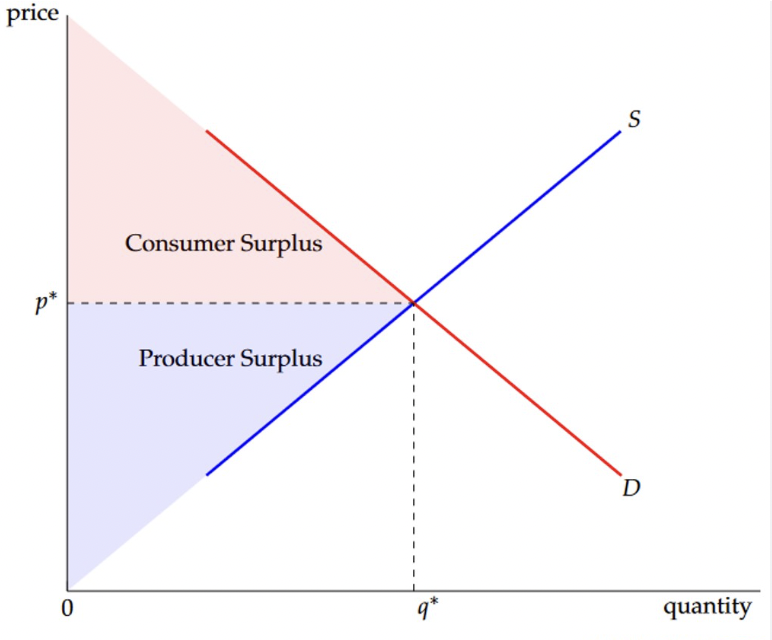
Consumer Surplus
Definition: The difference between the price the consumer is willing and able to pay and the price they actually pay.
Law of Diminishing Marginal Utility: Consumer surplus generally declines with each extra unit consumed.
Inelastic Demand Curves: Have larger consumer surplus, since consumers are willing to pay much higher prices to consume the good.
Increasing Consumer Surplus: by rise in supply or demand.
Decreasing Consumer Surplus: by fall in supply or demand.
Producer Surplus
Definition: The difference between the price the producer is willing to charge and the price they actually charge.
Increasing Producer Surplus: by rise in supply or demand.
Decreasing Producer Surplus: by fall in supply or demand.
Economic Welfare
Definition: The total benefit society receives from an economic transaction.
Calculation: Area of producer and consumer surplus added together.