Week 5: Enzyme Kinetics, Inhibition Mechanisms, and Allosteric Regulation
Fundamentals of Enzymology and Catalysis
Definition of Catalysts:
Catalysts are chemical agents that accelerate the rates of chemical reactions without themselves undergoing any permanent chemical modification or being consumed by the end of the reaction.
Most biological catalysts are proteins (enzymes), though catalytic ribonucleic acids (ribozymes) also exist.
Thermodynamic Principles:
Enzymes do not alter the chemical equilibrium of a reaction.
The position of the final equilibrium point remains identical whether an enzyme is present or absent.
The acceleration achieved by an enzyme ensures that thermodynamic equilibrium is attained significantly faster than in the uncatalyzed process.

Magnitude of Rate Enhancements:
Biological reactions in the absence of catalysts possess extremely long half-lives, ranging from days to millions of years.
Enzymes accelerate reaction rates by factors typically between and .
Experimental rate enhancement data compiled by A. Radzicka and R. Wolenden (Science 267:90–93, 1995):
OMP (Orotidine monophosphate) decarboxylase:
Nonenzymatic half-life:
Uncatalyzed rate (!):
Catalyzed rate (!):
Rate enhancement (!):
Staphylococcal nuclease:
Nonenzymatic half-life:
Uncatalyzed rate (!):
Catalyzed rate (!):
Rate enhancement (!):
AMP (Adenosine monophosphate) nucleosidase:
Nonenzymatic half-life:
Uncatalyzed rate (!):
Catalyzed rate (!):
Rate enhancement (!):
Carboxypeptidase A:
Nonenzymatic half-life:
Uncatalyzed rate (!):
Catalyzed rate (!):
Rate enhancement (!):
Ketosteroid isomerase:
Nonenzymatic half-life:
Uncatalyzed rate (!):
Catalyzed rate (!):
Rate enhancement (!):
Triose phosphate isomerase:
Nonenzymatic half-life:
Uncatalyzed rate (!):
Catalyzed rate (!):
Rate enhancement (!):
Chorismate mutase:
Nonenzymatic half-life:
Uncatalyzed rate (!):
Catalyzed rate (!):
Rate enhancement (!):
Carbonic anhydrase:
Nonenzymatic half-life:
Uncatalyzed rate (!):
Catalyzed rate (!):
Rate enhancement (!):
Enzyme Specificity and Binding Models
Active Site Organization:
The active site is a specialized three-dimensional crevice or pocket formed by specific amino acid residues distributed throughout the primary sequence of the enzyme protein.
Substrates bind within the active site via noncovalent interactions, placing functional catalytic groups in precise stereochemical proximity to target chemical bonds.

Enzyme Specificity:
Specificity represents the capacity of an enzyme to selectively distinguish its cognate substrate from closely related molecular analogues.
Proteolytic Cleavage Examples:
Trypsin: A digestive protease that hydrolyzes peptide bonds specifically on the carboxyl side of Lysine () or Arginine () residues; cleavage is strictly prevented if the subsequent residue is Proline ().
Thrombin: A critical blood-clotting endopeptidase possessing stringent specificity; it cleaves Arginine-Glycine () bonds exclusively within the extended sequence: .

Models of Enzyme-Substrate Binding:
Lock and Key Model (Emil Fischer, 1890):
Proposes that the unbound active site possesses a static, rigid geometry complementary to the conformation of the substrate prior to binding.
The substrate fits into the preformed active site in a complementary manner analogous to a key fitting into a lock.
Induced Fit Model (Daniel E. Koshland Jr, 1958):
Posits that the active site is structurally flexible rather than rigid.
Initial noncovalent contact with the substrate induces a dynamic conformational change in the enzyme, aligning key catalytic amino acid residues precisely around the substrate to form the functional enzyme-substrate () complex.

Chemical Kinetics Principles
Reaction Velocity Definitions:
For a fundamental reaction converting substrate to product ():
Velocity () is mathematically defined as the rate of disappearance of substrate or appearance of product over time ():
Reaction Order:
First-Order Reactions:
The reaction velocity is directly proportional to the concentration of a single reactant:
The rate constant has units of .
Second-Order Reactions:
Reactions requiring two colliding reactant molecules:
The rate constant has units of .
Pseudo-First-Order Reactions:
Occurs when a second-order reaction involves two substrates, but one substrate is maintained at a vast stoichiometric excess relative to the other.
The concentration of the excess reactant changes negligibly during the course of the reaction, causing the reaction velocity to appear directly proportional strictly to the concentration of the limiting reactant.
Most in vivo enzymatic reactions follow pseudo-first-order kinetics (e.g., hydrolytic reactions where water is a substrate present in massive excess).
Michaelis-Menten Kinetic Theory
Reaction Scheme and History:
Formulated in 1913 by Leonor Michaelis and Maud Menten to describe single-substrate enzyme kinetics:
Simplified two-step progression:
Initial Velocity Assumption ():
Measurements are conducted during the very initial phase of the reaction, when substrate has barely been depleted and product concentration () is approximately zero.
Under these initial conditions, the reverse reaction converting product back to intermediate () is negligible:
Rate-Limiting Step and Kinetic Parameters:
Product synthesis from the complex is slower than the reversible association/dissociation of and .
The second chemical step () represents the rate-limiting step; thus, overall velocity depends directly on the concentration of the intermediate complex ():
Catalytic Constant (!):
corresponds to the catalytic constant (), also termed the turnover number.
Equivalent to the maximal number of substrate molecules converted to product per unit of time by a single enzyme molecule when the enzyme is completely saturated with substrate.
Maximal Velocity (!):
The maximum initial velocity reached when all active sites on the total enzyme population are occupied by substrate ().

Michaelis Constant ():
Mathematically defined in terms of individual elementary rate constants:
Operational definition: the specific substrate concentration () at which the initial reaction velocity () is exactly half of maximal velocity ().
Represents the substrate concentration at which exactly half () of the available enzyme binding sites are filled.
Provides a physiological index of the substrate concentration necessary for substantial catalysis to proceed.
Quantitative interpretation:
Low indicates high affinity of the enzyme for its substrate (strong binding; small concentration needed to half-saturate active sites).
High indicates low affinity (weak binding; large concentration required to half-saturate active sites).
Dependence: value depends on the identity of the substrate, temperature, , and solution ionic strength.

Representative Values (Lehninger Table 6-6):
Hexokinase (brain):
Substrate ATP:
Substrate D-Glucose:
Substrate D-Fructose:
Carbonic anhydrase:
Substrate :
Chymotrypsin:
Substrate Glycyltyrosinylglycine:
Substrate N-Benzoyltyrosinamide:
-Galactosidase:
Substrate D-Lactose:
Threonine dehydratase:
Substrate L-Threonine:
The Lineweaver-Burk Double Reciprocal Transformation
Equation Derivation:
Taking the algebraic reciprocal of the hyperbolic Michaelis-Menten equation yields the linear Lineweaver-Burk expression:
Conforms to the standard equation for a straight line: .
Key Graphical Coordinates:
Independent variable (-axis):
Dependent variable (-axis):
Slope ():
-intercept ():
-intercept (where ):

Enzyme Inhibition Principles
Taxonomy of Inhibitors:
Enzyme inhibitors decrease the catalytic rate of an enzymatic reaction.
Classified broadly into irreversible and reversible modalities:
Irreversible Inhibitors
Reversible Inhibitors:
Competitive Inhibitors
Uncompetitive Inhibitors
Noncompetitive Inhibitors

Irreversible Inhibition:
Dissociates extremely slowly from the target enzyme because it becomes tightly bound via covalent modifications or extremely strong noncovalent associations.
Causes permanent inactivation of the specific enzyme molecules bound.
Classical Examples:
Penicillin: Irreversibly inactivates the bacterial enzyme transpeptidase via covalent acylation of an active-site serine, blocking peptidoglycan cross-linking in the bacterial cell wall, resulting in cell lysis and death.
Aspirin (Acetylsalicylic acid): Covalently modifies cyclooxygenase (COX) through transesterification/acetylation, suppressing the enzymatic biosynthesis of pro-inflammatory prostaglandins and thromboxanes.
Suicide Inhibitors (Mechanism-Based Inactivators):
A specialized class of irreversible inhibitors structurally resembling the normal substrate.
Binds reversibly to the enzyme active site and initiates the standard initial catalytic steps.
Instead of being converted into normal product, the catalytic machinery transforms the inhibitor molecule into an exceptionally reactive chemical intermediate.
This reactive intermediate immediately forms an irreversible covalent bond with active site amino acid residues, permanently disabling the enzyme.
Example: Fluoro-uracil (5-Fluorouracil, 5-FU), a suicide inhibitor used extensively as an anticancer chemotherapy agent.
Reversible Inhibition:
Characterized by rapid, noncovalent equilibrium binding and dissociation between the enzyme and inhibitor.
Activity of the enzyme is restored upon dilution or physical removal of the inhibitor.
Reversible Inhibition Mechanisms and Kinetics
Competitive Inhibition:
Mechanism of Action:
The competitive inhibitor () possesses structural similarity to the natural substrate ().
Competes directly with substrate for occupancy of the active site.
Prevents substrate binding by generating a dead-end enzyme-inhibitor () complex:
The equilibrium dissociation constant for the inhibitor is given by:
Overcoming Competitive Inhibition:
Can be completely outcompeted by increasing substrate concentration (); at saturating levels of substrate, all active sites remain occupied by .
Kinetic Consequences:
remains unchanged because infinitely high substrate concentrations outcompete the inhibitor.
Apparent increases (); more substrate is required to achieve half-maximal velocity.
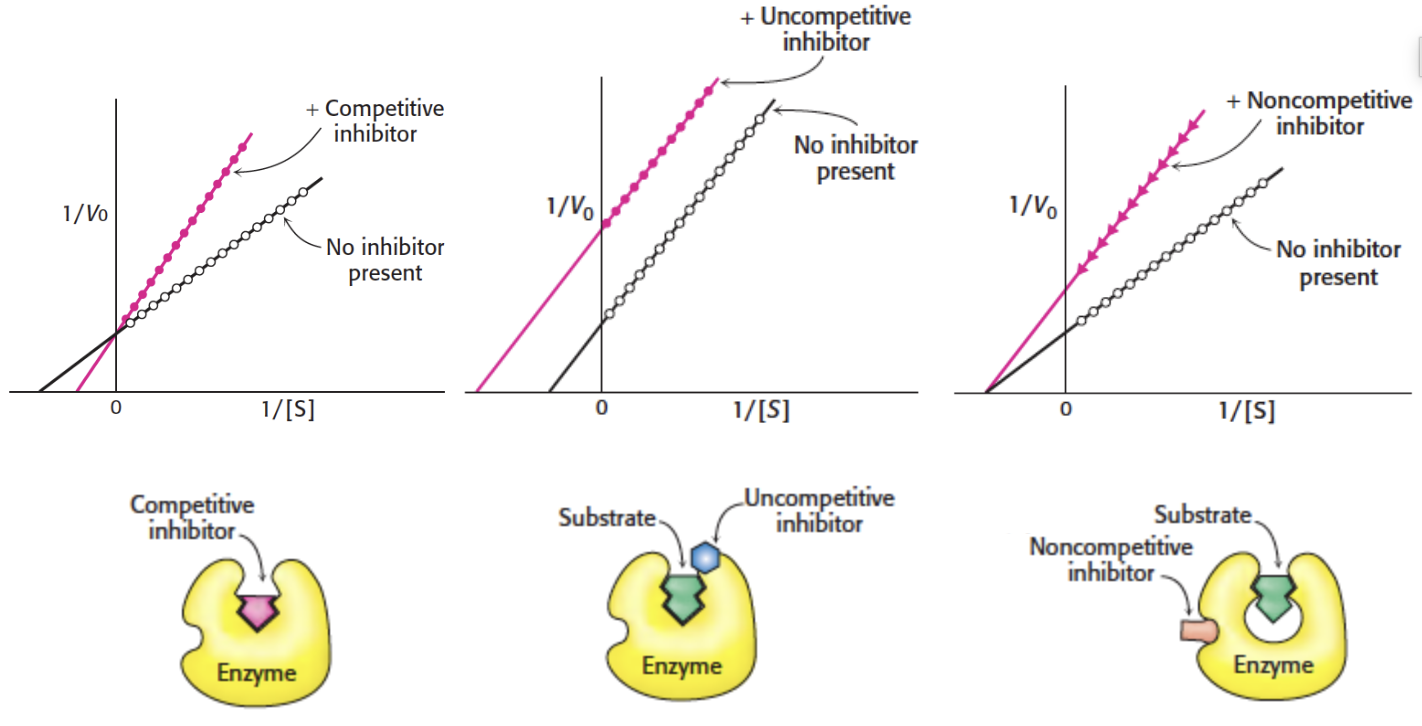
Lineweaver-Burk Diagnostic Profile:
Lines for uninhibited and competitively inhibited enzyme intersect directly on the -axis at identical values.
The slope () increases in the presence of inhibitor.
The -intercept () moves closer to the origin (becomes less negative).

Uncompetitive Inhibition:
Mechanism of Action:
The inhibitor binds exclusively to an allosteric pocket that is created or exposed only after substrate is bound to the active site.
Does not bind to the free enzyme (); binds strictly to the enzyme-substrate () complex to produce an inactive enzyme-substrate-inhibitor () complex:
The ternary complex is catalytically non-productive and cannot form product.
Kinetic Consequences:
Cannot be overcome by increasing substrate concentration.
decreases to an apparent lower value () because a fraction of the enzyme is trapped in the non-functional complex.
Apparent decreases by the exact same mathematical proportion as () due to Le Chatelier depletion of the pool, which pulls the equilibrium forward (reflecting an apparent increase in substrate binding affinity).
Lineweaver-Burk Diagnostic Profile:
Generates a series of parallel lines when comparing inhibited and uninhibited states.
The slope () remains constant because and decrease by the identical ratio.
The -intercept () shifts higher up the axis.
The -intercept () shifts further to the left (becomes more negative).

Noncompetitive Inhibition:
Mechanism of Action:
The inhibitor binds to a regulatory/allosteric site distinct from the active catalytic pocket.
Exhibits equal affinity for both the free enzyme () and the enzyme-substrate complex ():
Substrate binding is not prevented; the enzyme can simultaneously bind both substrate and inhibitor.
However, the resulting complex is catalytically inactive and cannot progress to product.
Kinetic Consequences:
Cannot be overcome by increasing substrate concentration.
decreases to a new, lower apparent value () as active enzyme is converted to non-productive forms.
remains unchanged because inhibitor binding does not disrupt substrate affinity for the remaining free catalytic sites.
Lineweaver-Burk Diagnostic Profile:
Plots intersect precisely on the negative horizontal axis at .
The slope () increases in the presence of inhibitor.
The -intercept () shifts higher on the vertical axis.

Side-by-Side Lineweaver-Burk Comparison:
Competitive: Lines intersect on the -axis; unchanged; increases.
Uncompetitive: Parallel lines; slope identical; both and decrease.
Noncompetitive: Lines intersect on the -axis; unchanged; decreases.
Pharmacological Assessment: Half Maximal Inhibitory Concentration
Potency Parameters in Biological Assays:
In drug discovery, pharmacological potency is quantified using functional inhibition assays.
(Half maximal inhibitory concentration): The precise concentration of an inhibitor compound required to reduce an enzymatic or biological response to of its baseline value in the absence of inhibitor.
: The concentration of an inhibitor compound required to reduce an enzymatic or biological response to of its uninhibited baseline (i.e., achieving inhibition).
The Cheng–Prusoff Relationship:
Formulated by biochemists Yung-Chi Cheng and William Prusoff to relate the functional metric to the thermodynamic dissociation constant () of the enzyme-inhibitor complex.
Under competitive inhibition conditions, the relationship is given by the Cheng–Prusoff equation:
Highlights that experimental values depend directly upon the ambient substrate concentration () and substrate affinity (), whereas is an absolute thermodynamic equilibrium parameter.
Allosteric Regulation and Non-Michaelis-Menten Kinetics
Characteristics of Allosteric Enzymes:
Allosteric enzymes do not obey standard hyperbolic Michaelis-Menten kinetics.
They function via the reversible, noncovalent binding of regulatory molecules known as allosteric modulators or allosteric effectors (frequently small cellular metabolites or cofactors).
Effectors alter catalytic efficiency by inducing concerted conformational changes across multiple protein subunits.
Modulator Classes:
Stimulatory (Positive) Modulators: Enhance enzyme activity or substrate affinity.
Inhibitory (Negative) Modulators: Decrease enzyme activity or substrate affinity.
Homotropic Regulation: The substrate and the regulatory modulator are chemically identical molecules (cooperativity across identical active sites).
Heterotropic Regulation: The regulatory modulator is a distinct chemical entity different from the enzyme's substrate.
Distinction from Uncompetitive and Noncompetitive Inhibitors:
While uncompetitive, noncompetitive, and allosteric inhibitors all bind to sites distinct from the catalytic active pocket, uncompetitive and noncompetitive inhibitors do not necessarily trigger cooperative quaternary conformational changes.
Their underlying kinetic profiles and saturation geometries are consequently distinct.
Subunit Structural Dynamics:
Allosteric enzymes generally consist of multi-subunit complexes comprising discrete Catalytic () and Regulatory () subunits.
Sequential Activation Mechanism:
In the absence of positive effector, the enzyme exists in a low-activity (low-affinity) state.
A positive modulator () binds specifically to the regulatory subunit ().
Binding triggers an allosteric conformational shift within the subunit.
This structural reorganization propagates across subunit interfaces to induce a high-affinity conformational state within the adjacent catalytic () subunit.
The catalytic subunit binds substrate () with significantly elevated affinity, forming the active enzyme-substrate complex.

Sigmoidal Kinetic Profiles:
Unlike the classic hyperbolic curves seen in Michaelis-Menten enzymes, homotropic allosteric enzymes display a distinctive sigmoidal (S-shaped) velocity versus substrate concentration ( vs. ) curve due to positive cooperativity.
Half-Saturation Parameter (!):
For sigmoidal kinetics, the substrate concentration required to produce half of the maximal velocity () is designated as (or ) rather than .

Modulator Effects on Saturation Curves:
Positive Modulator (!):
Shifts the sigmoidal curve toward the left.
Lowers the apparent (), increasing substrate affinity.
Transitions the kinetic profile toward a hyperbolic shape.
Negative Modulator (!):
Shifts the sigmoidal curve toward the right.
Increases the apparent (), reducing substrate affinity.
Exaggerates the sigmoidal character of the velocity curve.
Maximal velocity () remains essentially constant across these transitions in typical -system allosteric enzymes.

Comparative Review of Kinetic and Regulatory Features
Enzymatic Catalysis Core Summary:
Enzymes dramatically increase reaction rates ( to fold) without modifying final reaction equilibrium.
Specificity is achieved via stereochemical and chemical complementarity, characterized historically by the Lock and Key model and dynamically by the Induced Fit model.
Michaelis-Menten Kinetic Parameters:
: Maximal initial velocity under full active-site enzyme saturation.
; substrate concentration producing half-maximal velocity ().
: Catalytic turnover number per unit time.
Reversible Inhibition Profiles:
Competitive: Inhibitor binds to free at the active site; unchanged; increases.
Uncompetitive: Inhibitor binds strictly to the complex; both and decrease proportionally; Lineweaver-Burk lines are parallel.
Noncompetitive: Inhibitor binds equally to free and complexes; decreases; unchanged; Lineweaver-Burk lines intersect at the -axis.
Irreversible and Suicide Inhibition:
Irreversible agents bind covalently or with very slow dissociation kinetics (e.g., penicillin targeting transpeptidase; aspirin targeting cyclooxygenase).
Suicide inhibitors (e.g., 5-fluorouracil) are mechanism-based chemical trojans processed by catalytic steps into reactive inhibitors that destroy the enzyme.
Allosteric Enzymes:
Multi-subunit regulatory proteins that do not conform to Michaelis-Menten kinetics.
Exhibit sigmoidal substrate saturation curves governed by positive cooperativity.
Characterized by the half-saturation constant .
Positive modulators shift curves to the left (decreasing , increasing affinity); negative modulators shift curves to the right (increasing , decreasing affinity).