Capitalism Notes (lectures 10-21)
Lecture 10
Climate change video:
CO2 50% increase from 1815 to now and humans have been increasing amount of greenhouse gases in the atmosphere
Annual CO2 Emissions:
By country:
China has larger emissions than anyone else because they use coal
before their economy grew it was US (until the switch from coal to natural gases)
By fuel: largest emissions
1) oil from gushers 2) gas 3)oil 4) coal 5) traditional biomass (wood)
Lecture 11
Current events (3/21)
inflation increase from Jan -feb 2024 (was lower in november)
Increase in unemployement ( you don’t have a job but you have to say you’re looking for it to be considered unemployment
Growing divergence in household and payroll data: number of new jobs has been decreasing
Why are consumers so unhappy when economy is doing well?
Because the way inflation is measured has changed (removed cost of interest to borrow money out of the basket because it’s not a good)
Interest rates increase rapidly and the new inflation numbers aren’t showing the people who aren’t able to keep and buy homes becuse of it
Indirect method of forcing americans to buy EV (electric vehicles): Federal government gave law saying there cannot be a certain amount of carbon emissions by 2032
saying internal combustion engines must be minimized by certain time ( but not directly telling consumers they have to buy EV)
Lecture
How do we know if carbon is causing the temperature changes?
It’s difficult to know because there are a lot of factors
City temperatures usually measured in condensed city areas where the concrete holds heat so is it really that hot?
Measuring the temp of the world is difficult
How do we know temperatures from the past?
fossils show what plants grew where and we know what kind of temperatures the plants need → comparing to areas they were found in to today
Fossils, tree rings, ice cores
What caused ice ages?
what changes first? CO2 or temperatures that initiates the ice ages
we know temperature changes first bc ice ages were way before the time of humans emitting gases into the air
Is CO2 and temperature causational or correlated?
Historical information shows the temperature changes occurred naturally
Lecture 12
Current Events (3/26)
Apple case: lawsuit against apple saying the corporation is a monopoly and hinders competition
Apple makes APIs unavailable to firms using IOS (getting rid of this would probably remove government objections
If APIs were removed there would be more synchronization between androids and iphones and other apps
Lecture
How many years of temperatures not rising? → 20,000 years of warming then 20,000 years of cooling
Advice from dean of climate science: the world has always had fluctuating temps and would do it even if humans weren’t here
We don’t know how much faster are we warming temperatures outside of the pattern
Theories of how to slow global warming:
could increase cloud seeding to prevent sun from shining and increase cool temps or paint all roof tops of buildings white to increase reflection
Problem → 1)these are bandaid solutions to the problem 2) don’t really deal with the outcome will be 3) easiest/ quickest solution isn’t always right
Hockey stick graph: there’s been little variation in temperature changes over last thousand years, and in the 20th century it started increasing ( in shape of hockey stick)
warming faster because of humans
Lecture 13
Volcanoes affect world temperatures: volcanoes cool earth from dust particles they produce from eruption which reflects sunlight
‘strangest summer in history”: eruption caused sun to be blocked out globally for a whole year , cooled temps, and people died of starvation and diseases
Solar radiation management: doesn’t address effects of greenhouse gases and could have unknown consequences. Temporary solutions that could cause the issue to come back worse (could cause super heating)
Carbon tax: anyone who creates CO2 should be taxed
Discount rate:
If you value the future= low discount rate for CO2 tax (Obama)
No value for future= high discount rate for CO2 tax (trump)
What’s the harm of global warming? → increase of 3 degrees of temp is catastrophic for a lot of places (floods, bad weather)
Global deaths chart: floods, drought, earthquakes cause more deaths than any other disaster
Due to societies becoming more sophisticated, there are less deaths than previous thousand years due to increase technology and quality of life
Lecture 14
Economic harms if climate change:
NCA4 (Fourth National Climate Assesment) Chart: Left graph shows estimated changes in fossil fuels emissions and the right graph shows projections of direct damage to current US economy
Do both sides match up in shape? Yes
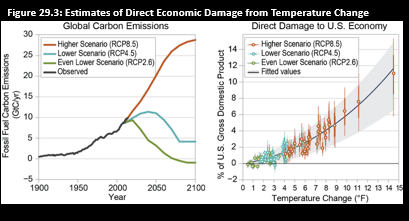
What’s economically wrong with the statement “number of extreme weather related events per year costs Americans 1 billion per event and has increase (accounting for inflation)?” → The info implies storms are getting worse and only accounting for inflation isn’t enough to show that it is costing americans more money. Same storms will cause more damage if GDP is larger (regardless if inflation)
Politics affects science
Climatologist and politicians (some) have acted unethically to promote theories (hockey stick)
Confirmation bias: looking for certain results to prove what you think is right (ignoring what goes against your beliefs)
effects science and economics
Lecture 15
Current events
John Stewart: on jimmy kimmel show saying that COVID was created in a lab in China that they were studying and broke out (there was only one lab so it had to have originated from there) → man-made
Scientists promoting false stories of where COVID came from to not take responsibility (there were no bats near Wuhan where the facility is so the theory that it came from bats is false)
US debt
Why the US needs debt:
Debt keeps track of the money that’s added to the economy and taken away
Why doesn’t the US pay it? → because most of it’s held by citizens (the money to pay it back that is, in bonds and securities)
What is debt used for? → usually for emergencies, it’s easier to borrow the money than tax/ burden the younger generations
Problem with borrowing money? → the government borrows daily for immediate consumption instead of long term playing which increases debt
Debt is not detrimental on its own but too much leads to bankruptcy
Have to watch GDP ratio because it shows whether there’s still a balance between money in the economy and national debt
Debt is basically taking away / burdening future generations to obtain resources the government doesn’t have today
There are 13 countries with debt higher than the US (Japan is leading all of them)
Deficit spending chart
debt to GDP ration in 1970’s to 2000s was not as high as it is now
When the government does well it’s supposed to spend less vs when it’s facing a problem
We get out of recessions by spending more (stimulus checks, paying people, providing jobs)
Lecture 16
What happened in Japan?
Stock market and real estate crash in 1990 caused Japan’s economy to not do well
Usually when there’s a crash in the stock market there’s a delay. It happens first then real estate goes
Government in Japan started to run deficits in an attempt to grow the economy
Retirement system
Retirement plan: government takes deductions from current working people’s incomes and gives it to those currently retired
Why? So when people stop working they have money they can use
Could the system work without the government? Yes, in Canada whatever company a person works for has to pay for their retirement fund by law
First taxes collected 1937 and first payout in 1940 ( you have to work 10 years to collect)
Government takes 6.2% of wages
Two ways to set up the system
1) Funded in advance (correct way) 2) Pay as you go (not financially sound) = only the government can do this
Pensions (funded in advance): you pay while you work, money goes in an account and earns interest. When you retire you use the money from the account
Social Security (pay as you go): current workers pay for previous workers
Who benefits?
Better deal for: low income workers because less is coming out of their pockets and for those who live long enough to actually receive the benefits
Worse deal for: those with higher incomes pay twice as much and people who die early don’t receive benefits
How to tell if anyone gets a good deal: Correct way to judge is by adjusting the amount being received for inflation and investment returns (you can’t compare the amount going out with the amount going in)
Medicare is similar to social security
it’s not getting back what you paid for or self contained (regular taxes pay for part of costs)
Hospital costs: taxes pay for costs hospitals must pay, medicine and visits paid for by general revenues and “part A” is funded like social security (what’s running out of money)
Social Security Video
If social security didn’t exists the elderly would have high poverty rates
Number of people working < retirees which makes it difficult to fund social security
Solutions: 1) increase money coming in ( taxes, other streams of revenue) 2) less money going to the fund (gradually decrease benefit amounts for upper/middle class and give more to lower class)
It’s difficult to take action because the solutions will be unpopular and people will vote out of office anyone who talks about reducing the amount of social security each person gets
Lecture 17
Current events
12 month inflation rate increase ( march 2023 - march 2024) and Federal government keeps promising to lower interest rates but haven’t
Mortgage rates are up (7%)
Consumers upset about high interests rates in the economy and need them to fall to feel better
Income Inequality
Is there an optimal level of inequality? : Unknown but zero inequality isn’t the answer because economy can’t function that way
socialism/communism failed because no incentive to work
Measuring inequality
Gini Coefficient: A / (A+B) 1) perfect inequality → coefficient = 1
2) Perfect equality → coefficient = 0
What does Lorenz curve show? → income /wealth distribution in a population
x axis goes from poorest to riches and Y axis shows share of income/wealth
Picketty (theory of distribution of wealth)
Says if interests rates are higher than growth rates → wealthy get a large share of economy (people who own bigger share own all the economy and this increases inequality)
R>G → increases shares
Lecture 18
Current Events
Self-driving cars: musk promised robot taxi’s and people wondering if it will ever happen because they’re four years late
people also say musk should pay for vehicles in case of accident
Nature of taxes
Taxes are how government creates revenue
Progressive vs regressive: 1) progressive → makes wealthy pay higher % 2) regressive → makes low income people pay higher % 3) neutral → everyone pays same %
Types of taxes: property, corporate, individual, consumption, social insurance
Top 1% graph → top 1% pays for 25% of all federal taxes
What kind of taxes: there were no income taxes until 1913 (texas doesn’t have this)
what are income taxes? = capital gains, lottery, anything you sell and get more money than what you paid, gifts, salary, gambling winnings
Sales taxes are state not federal
Property taxes: big source of texas government income bc there are no income taxes
Many fees: gas, garbage, water, social security, medicare, alcohol,
How much do people pay
Income tax:
1) top 1% → income tax 46% (share of total taxes = 26%)
2) Bottom 50% → 2% of total tax (share of total 10%) → poor people don’t pay a lot because of progressive tax
3) Top federal income tax rate → 40%
Lecture 19
Current events
Caitlin Clark: signed WNBA deal that is significantly less than NBA rookie’s get paid and everyone thinks it’s unfair
she will have outside contracts to make up for everything else
Share of total income going to Top 1% since 1990 graph
Picketty saying inequality has went down in almost every country
been questions if inequality has really been increasing (it’s unknown)
Aftertax / income distribution: Government has programs to redistribute $ to poor (welfare, food stamps, medicaid)
Article→ points data and measurements aren’t straight forward/ can misleading and trying to estimate people’s incomes before taxes is difficult (they are assumptions)
Researchers push idea that inequality has been increasing past 40 years in English speaking countries
new research says there’s no income inequality = it’s an ongoing disputes
Impact of redistribution
Gramm and Early: says top quintiles and looking at people’s incomes get (without taking out taxes) → top are making 60x income from bottom quintiles
after taxes households are making 17 x lower quintiles
There are new claims saying the change of how taxes are collected are different than 1970’s from when picketty was examining the data and was not able to take it into account
Tax law has seem to decrease inequality / disparity
What about wealth
Wealth tax: everything you own and putting a tax on it (but it’s all that you report so people can report less and get around high taxes)
How is wealth measured?: all income accumulated (not spend) ( if you have 100% and spend 70%, 30% saved is your wealth)
Wealth vs income: wealth is more concentrated and takes a long time to accumulate and last long while income is all assets-debt you owe
Why have wealth taxes flopped?
Some major countries have implemented and rescinded bc it’s hard to keep track of (it’s usually just property taxes)
Didn’t raise a lot of money and it caused disputes. People even leave the country it’s implemented in to avoid them
Penalizes those who save their money because wealth is what is saved and accumulated over time and that’s unfair to those → it would cause people to stop investing
Norway article: typical for rich ppl to retreat to other countries to avoid wealth taxes
Lecture 20:
Taxes
US inequality higher than other english speaking countries: US has a much larger market than other countries
US bigger market with lower taxes
Capital gains taxes
capital gains tax: when you sell something at a higher price from which you bought it
Long term rates or short term? → Long term because they are lower
Some people pay capital gains taxes when there is no actual capital gain (selling house more than what you bought it for in 2005 but haven’t adjusted for inflation)
Should we focus on income distribution?
Is it better to be poor in a country w/ higher and growing incomes (high GINI country) than poor in a poor country (low GINI country) → Yes because they would be better off in the richer country
Poverty rate video: America is the wealthiest and poorest economy (poverty rate is 18%)
Poor been stagnant?
people haven’t had an increase in earnings in last 50 years
Checks were bigger 40 years ago with PPP (purchasing power parity in real dollars) and real hasn’t increased at all
Measurements show worker’s wages have not been increasing
Over 60 years (measure of inflation)
CPI-U: main one and known to overstate inflation (6% increase in wages)
CPI-U-RS: shows to 10 % increase in wages
PCEPI: most accurate measurement and shows 23% increase
Wealthy America vs Poor America
Why is north america rich and south america poor now (roles reversed): because colonies had to fight for survival while spain was a world power in the beginning
Lecture 21
Current events
Stocks and bonds decreasing
Per Capita income 2022
per capita= individual income (different from household)
Average is that → Asians/whites have higher incomes than black people and hispanics
Income differs by religion, race, ethnicity
Why do Asians earn the most money?
Income is related to the amount of schooling AND how much you learn, major chosen, personality, work ethic, risk taking
Asian cultures usually go to school for complex degrees and learn a lot
Importance of education on income 2006: Asians continue to outpace everyone
Texas k-12 school performances
Texas does well even though they score few points below the highest earned grades
Texas has more of a distributed population with the type of kids that attend school and still earns good grades
Lecture 22
Current events
Predictions saying economic growth has been slowing down (1.6% for 1st 2024 qtr, 2023 chart 1.1% growth)
The actual growth for 2023 first quarter was 2% and predictions of recessions were wrong
Why are the graphs different?→ able to gather more info as time goes on and able to update and adjust measurements to be more accurate
Poverty line graph
1800’s → world was poor and everyone except a small percentage where far below poverty line of earning $2 a day (people in Asia were worse off)
1975 → distribution has 2 peaks= larger distribution of wealth and the creation of two different worlds now ( west vs other poor countries)
Asia still poor
2015 → unimodal (only one peak)= people now earn 5 x income they did in the past.
China is now extremely well of, why? → because they opened their market to capitalism
The world is more stable, less of the poor, more rich in the last 40 years