Legal Studies 443
1. What are the trends in immigration since 1850?
a. Who is the immigrant population in terms of nationality, age, citizenship, documentation status?
- Ellis Island 1st wave (from European countries)
- In the 1930s, the Quota system started that placed restrictions on immigration (setting numerical limits on the number of immigrants allowed to enter from each country per year)
- 1960 demographic → Ellis Island immigrants grew old
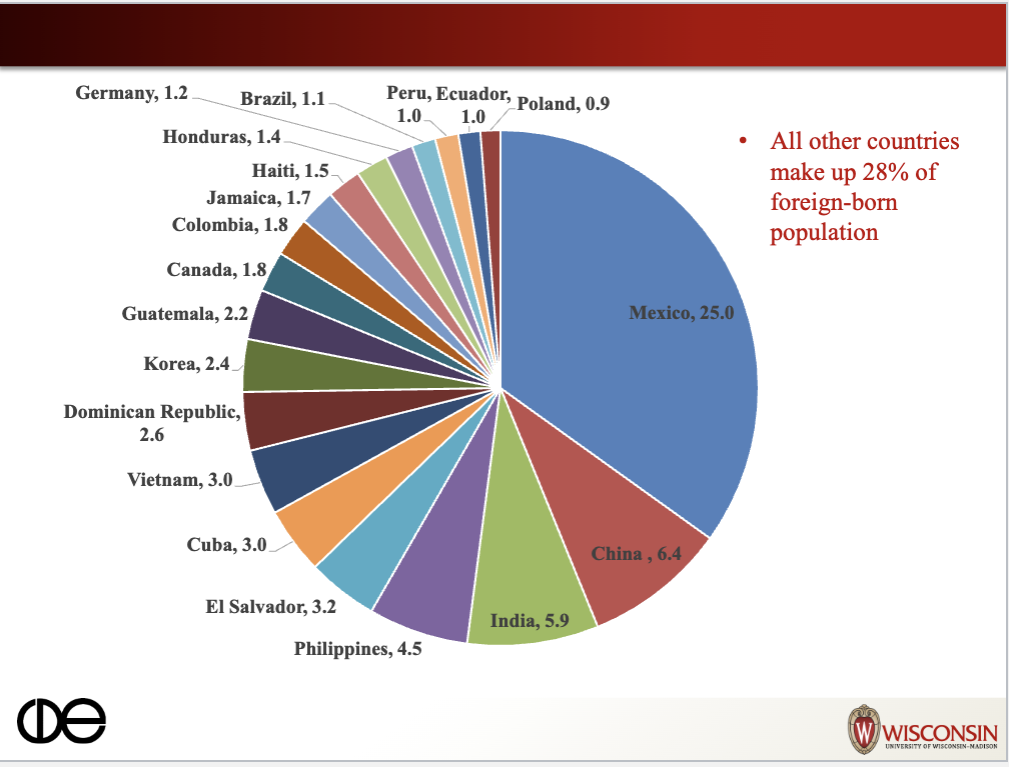
Top 5 countries of Origin: Mexico, China, India, Philippines, El Salvador
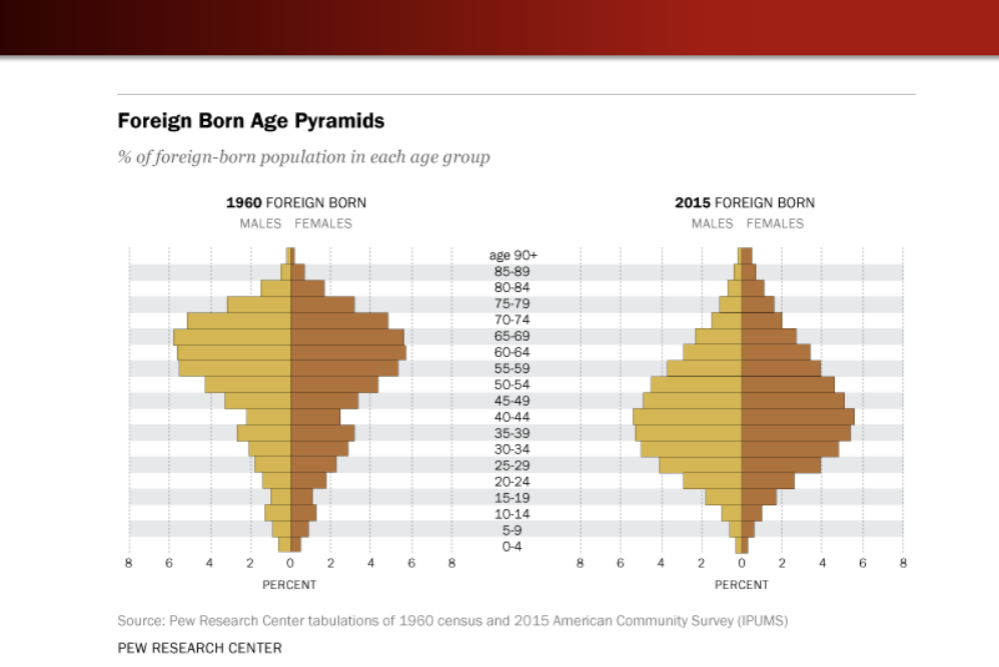
- 1960 demographic → Ellis Island immigrants grew old
- 2015 demographic → working middle-aged population (immigrate for economic reasons)
- age: revolving door where young mexican working men would come, but now it’s whole families (circular migration)
- Immigrant destinations: California, New York, Texas, Nevada, Florida
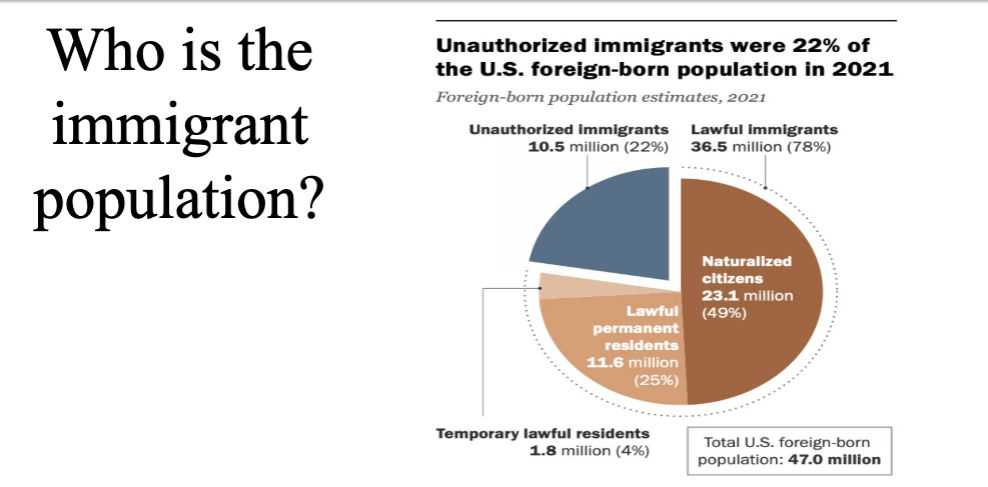
- How to know who is undocumented: residual methodology (look who is a citizen to find out who isn’t, we have a decent sense of how many people are here). Pull out likely documented population and residual is the likely undocumented population
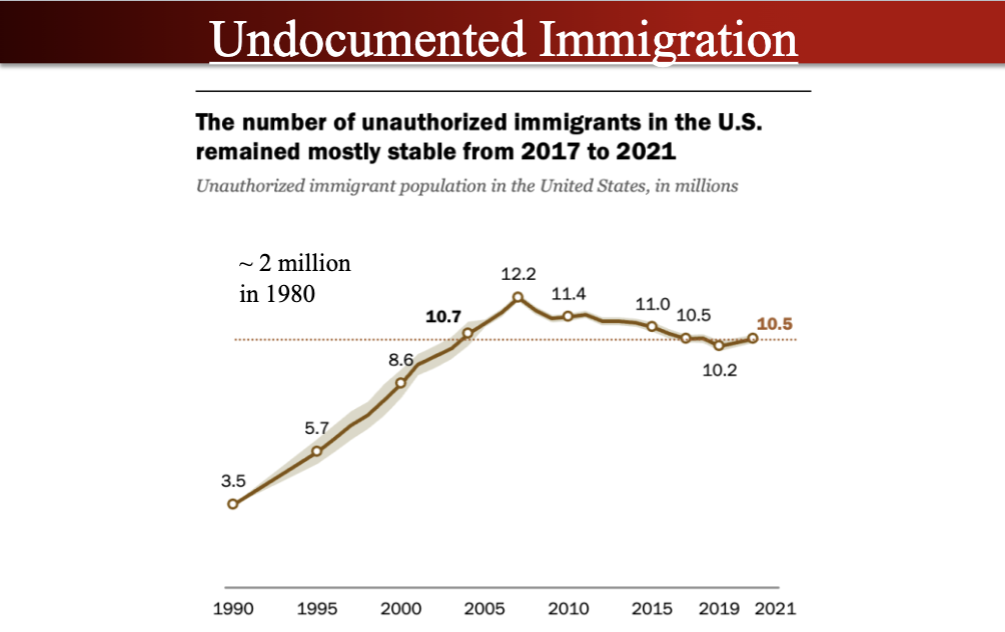
- 1990 → undocumented population increased majorly
- 2007/08 → Great Recession affects immigration (less jobs)
Housing market affected the most (large immigrant population)
- After 2005 → fewer people are coming and Obama’s presidency led to large deportation
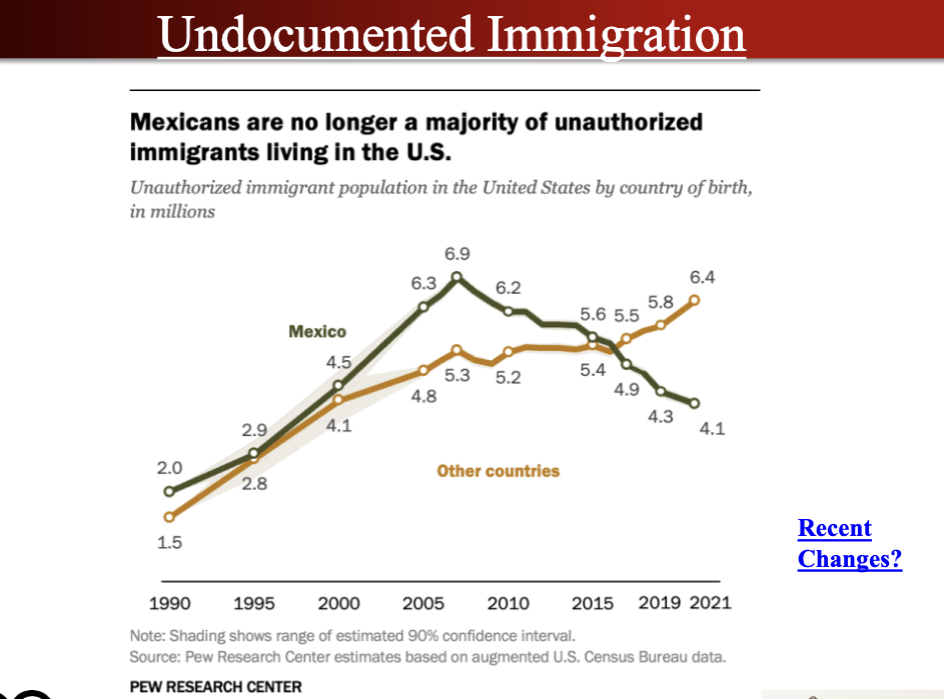
- Recent trend: mexicans aren’t the majority of unauthorized immigrants → instead venezuela, el salvador (central and south american increase)
- June 2024 → Biden cracked down on who could come and claim asylum
2. What are the trends in crime since 1960?
Violent Crime
Murder, Rape, Aggravated Assualt (most common), Robbery (interpersonal crime with threat of force, different from theft), Larceny (direct theft)
Young men commit the majority of crimes
Fall of Crime in the 1990s
Legalized abortion played a role?
Generation of criminals weren’t born (argument)
Increase in Incarceration Rates (reduce to some extent)
Economic → stronger, more employment opportunities (which attracted more immigrants because the economy was good)
Increase Policing (created incentive to hire more officers)
Violence and Immigration (1990-2016)
Foreign born population increases substantially as the violent crime rate goes does
Correlation doesn’t = causation
80s Increase in Crime
Gang violence
Baby boomers reached crime-prone age (18-24, young men)
Murder
Highest reported violent crime
There’s a body → don’t need anyone to come forward
We know crime rate increased because the murder rate went up
Gang violence increased in late 80s, early 90s
Powder cocaine vs crack → can be cut and sold in smaller quantities
Crack cocaine allowed lower income individuals to afford it
Gangs wanted to sell drugs → gang violence spiked largely around the issue of crack cocaine.
2020 → murder increased (30% increase from 2019)
Trust in the police dropped
Police were preoccupied with social unrests
Black men homicide death rates increased
Disparity of homicides rates between white and black men have never been so great than now in past decades
Increase in racial disparities between covid and longevity → homicide played a role
Covid disproportionately killed old people, it is disproportionately younger individuals who died from homicide.
Longevity: covid victims had fewer years to live (disproportinately kills old individuals), homicide victims had more years to live (disproportinately kills young individuals)
3. What are the three major ways we measure crime in the United States?
a. Describe their strengths and weaknesses.
Note: Crime measurement: The number of crimes/ per 100,000 people
The Federal Bureau of Investigation’s (FBI) Uniform Crime Report
Best for arrests, well-reported crimes, and homicides
Most popular (arrests)
About 93% of law enforcement agencies report
Annual reports for all crimes (except traffic violations)
Can be nation-wide, state, county, metropolitan statistical area, and city
Strengths:
National Data Source (standardized & compare across cities, states, etc)
Permits comparisons across diverse, states, cities
Can be combined with other data sources (census info, etc)
Weaknesses:
UCR only includes reported crimes
Victimless crimes & domestic violence crimes often not reported
Focuses on street crimes (focus on robbery vs focus on white collar crimes)
Issues with discriminatory policing? (NYC “Stop & Frisk”)
NYPD had been ‘deliberately indifferent’ to illegally detaining minorities (Judge Shira Schendlin 2013)
Blacks and Latinos comprise 90% of all stops
Reporting guidelines not enforced and not consistent across agencies
“Dark figure” of crime → gap between the number of crimes reported and the number of crimes that actually occur
National Crime Victimization Surveys (NCVS)
Best for victim data and underreported crimes (e.g. sexual assaults)
Created in 1972, most popular
Surveys 49,000 households, 100,000 indiv., 2x/year
Respondents (12 and older) asked about victimizations from past year
Strengths
Partially resolves problem of under-reporting
Official statistics may undercount crime by 70 percent
Nationally representative survey
Gets at the “dark figure” of crime
Better understanding of victims and contexts of victimization
Weaknesses
Suffers from selection biases
Over-reporting and under-reporting
Accuracy issues? Memory recall
Do all of these victimizations constitute ‘crimes.’
No data on victimless crimes or child abuse (no information on the homeless)
It's a household survey so they wouldn’t account for the homeless
Huge categories of crime and punishment in the U.S
Example: drugs (-50% of federal prisoners, -20% of State)
Shoplifting? DUI?
The undocumented population
Self Report Studies
Best for offender data and for “victimless crimes”
Prostitution, etc
Strengths
Illustrate the “dark figures” of crime
Learn more about the offenders
Understanding the causes of crime, not victimization
Anonymity and confidentiality
Examples: NLSY, Add Health, PHDCN, Monitoring the Future
Weaknesses
Can we expect honesty?
People may hide or exaggerate their crimes
Can we include the most serious offenders?
This includes “street” and “suite” crime
Example: From the book Everyone Lies → condoms (asked how often men have sex and how often do they use a condom when they have sex)
Incentive for Search History/Google → lying = incorrect information
Self Reported Studies Source → schools (high/middle)
Serious offenders uncommon in high school (would get petty crimes, but nothing serious)
Many crimes are committed by people who dropped out of high school
Access to criminality is different in schools (working at a bank vs going to school)
Real World Example
I am working on a project investigating the effect of undocumented immigration on crime
What data should I use: UCR → focus on violent crime (more readily reported)
Harder to get an estimate from cities vs states (undocumented immigrants)
4. What are the trends in deportation?
Ronald Reagan Administration: The Immigration Reform and Control Act was signed by President Ronald Reagan and enacted in November 1986. The act granted temporary legal status to any undocumented immigrants who had been living in the United States continuously since 1982 so long as they paid a $185 fee and could demonstrate good moral character.
Between 2008 and 2015, nearly 3 million people were deported from the United States, roughly 270,000 more than over the entire last century
Obama Administration = increase in deportation
Code 1835 & 1836 most prosecuted immigration crimes
Return (people caught at the border) vs Removal (deportation)?
Increasing shift from returns to removals in starting in 2000s
Trump dislikes this because they will just come back
Turn to the criminal justice system/criminal prosecution for undocumented
Apprehensions of Mexicans at U.S borders fall to near-historic lows in 2015
Net Migration from Mexico Below zero after the Great Recession
Apprehensions of citizens of countries other than Mexico increased with Trump
In 2019 a majority were Family Units were apprehensions
Family separation policy damaged Trump in polling
ICE Removals (2008-2021) decreased
Apprehensions at the U.S-Mexico Border increased in 2020
Biden Administration granted humanitarian parole
During the pandemic, most migrant encounters at the U.S-Mexico border have resulted in expulsion under Title 42
5. What are the theories of international migration?
a. Neoclassical economics
International migration stems from geographic differences in supply and demand for labor
Workers move from low-wage countries to high-wage countries
Rooted in micro-level theories of rational choice:
Migrants estimate the costs and benefits of moving to various international locations and then go to wherever the expected net returns are the greatest
U.S. 58,030 PPP (purchasing power parity → how much units of monetary value does it take to get something e.g. a pound of flour)
Mexico 17,740 PPP
The United States became richer than Mexico in 1970
Shortcomings of Neoclassical Theory
Migration should not occur in the absence of a wage differentials
Wage inequality doesn’t track immigration that well
Between 2005-2015; U.S-Mexico wage inequality grew while U.S experienced net negative migration from Mexico
Why would we see circular migration?
Undocumented immigration from Mexico was largely circular until that late 1980s
Why wouldn’t you stay in the U.S permanently to enjoy higher wages
Expected income is only one of the motivations for immigration
Summary:
The Neoclassical Economics Theory explains migration as a response to wage differences between countries. People move from low-wage to high-wage nations to maximize income, making rational cost-benefit decisions based on expected earnings versus migration costs.
Key Ideas:
Labor flows where wages are higher, balancing supply and demand over time.
Individuals calculate risks and rewards, migrating when benefits outweigh costs.
Markets naturally adjust—migration reduces labor surpluses in sending countries and increases labor competition in receiving ones.
Criticisms:
❌ Wage gaps don’t always predict migration (e.g., declining Mexican migration despite growing U.S.-Mexico wage inequality).
❌ Ignores non-economic factors like family, education, or violence.
❌ Fails to explain circular migration—why some migrants return home instead of staying permanently.
Takeaway:
Neoclassical theory explains labor migration well but oversimplifies—real migration decisions involve social, political, and economic factors.
b. New Economics of Labor Migration
Migration decisions are not made by isolated actors
Decisions are made within larger units of interrelated people, typically families or households but sometimes entire communities
People don’t just act individually to maximize expected income but also work collectively to overcome failures in capital, credit, and insurance markets (like investors diversifying risks)
Summary
Unlike neoclassical economics, which views migration as an individual decision, this theory sees it as a family or household strategy to manage economic risk.
Key Ideas:
Families send migrants abroad to diversify income sources and reduce financial instability.
Migration helps overcome market failures (e.g., lack of credit, insurance, or job stability in home countries).
Example: A farmer’s family sends a member abroad to work, ensuring income even if the harvest fails.
Criticism:
❌ Doesn’t fully explain why some families migrate while others don’t in similar conditions.
Takeaway:
Migration isn’t just about wages—it’s a collective risk-management strategy to improve family security.
c. World Systems Theory
Major unanswered question: what are the contexts in which people make decisions?
International migration is linked to the changing structure of global markets
ex: building an infrastructure/transportation makes it easier
Ex: San Diego/El Paso → has good infrastructure and access to cities for easier migration
Migration is a natural outgrowth of the disruptions and dislocations that occur in the process of market expansion and penetration
Ex: growth of commercial/industrial agriculture → machines cut workers
The same factors that facilitate the movement of goods, commodities, information, and capital, promote the flow of people by reducing the costs of movement
Summary of above information: Migration naturally results from the disruptions and displacement caused by market expansion. For example, as commercial and industrial agriculture grows, machines replace human workers, forcing them to seek jobs elsewhere. The same systems that make it easier to move goods, money, and information also lower the costs of migration, encouraging people to relocate
d. Segmented Labor Market Theory
Immigration less about push factors in sending countries, but pull factors in receiving countries
The demand for inexpensive labor stems from four fundamental problems
(1) Structural Inflation
Supply and demand are not the only thing that determines wages; status and prestige do as well.
Employers would have to raise wages proportionately throughout the job hierarchy
Ex: McDonald’s workers vs a lawyer (prestige/status)
If you raise the wages at the bottom, you have to raise the wages all throughout (Ex: High minimum wage in California)
Argument against minimum wage → businesses want to make money so they lay people off, kiosks at McDonalds.
(2) Social Constraints on Motivation
These are inherent to job hierarchies
People work for both income and status. The bottom of the hierarchy offers little status and little opportunity for upward mobility.
How do immigrants fill this niche?
Many are target earners seeking to make money to solve a problem or improve status at home
By comparison, the wages may not seem as low
May view themselves as part of the status system of home country
(3) Duality of labor and capital
Capital can be idled but not laid off (owners bear cost)
Labor can be released when demand falls (workers bear cost)
Primary labor market
Stable, skilled jobs with good tools and equipment. Employers invest in their human capital through training and education, Highly professionalized, often with contracts. They are expensive to let go.
Secondary Labor Market
Poorly paid, unstable jobs which they can be laid off at any time with little cost to the employer (limited mobility)
In the past, this demand was met by women, teenagers, and rural-to-urban migrants (don’t have much rural-to-urban migrants anymore)
These sources have shrunk in advanced societies
Women now have careers (divorce and labor market participation)
Declining birth rates
Urbanization
Other Factors that Influence Migration Decisions?
Violence
War (syria) - 5.2 million refugees to Europe in 2016 (up from 1.6 M in 2010)
Natural disasters (Haiti 2010; El Salvador 2001)
Persecution (Cuba)
Mariel boatlift (1980) - 125,000 Cubans arrived in Florida
Summary
This theory argues that migration is driven more by demand in receiving countries than by conditions in sending countries. Wealthy nations have a structural need for low-wage labor that native workers avoid.
Key Ideas:
Primary vs. Secondary Labor Market:
Primary – Stable, well-paid jobs with mobility (e.g., professionals).
Secondary – Low-wage, unstable jobs with little security (e.g., farm labor, housekeeping).
Native workers reject low-status, low-wage jobs, creating demand for immigrant labor.
Employers prefer migrant workers, who accept lower wages and limited mobility.
Criticism:
❌ Ignores why some low-wage native workers still take these jobs.
Takeaway:
Migration fills permanent labor shortages in undesirable, low-status jobs.
e. Social capital Theory
Migrant networks are a set of interpersonal ties that connect migrants, former migrants, and non-migrants at places of origin and destination through reciprocal ties of kinship, friendship, and shared community origin.
They increase the likelihood of international movement because they lower the costs and risks of movement and increase the expected net returns of migration.
f. Cumulative causation theory
Once begun, private institutions and voluntary organizations rise to meet demand of people seeking entry
Can create black market in migration services (coyotes)
Each act of migration alters the social context within which subsequent migration decisions are made, thus increasing the likelihood of additional movements
Summary: Cumulative causation theory explains how migration becomes a self-sustaining cycle. Once migration begins, it creates conditions that encourage further movement. As people migrate, they establish networks that lower barriers for others to follow. Over time, private institutions and voluntary organizations emerge to meet the growing demand for migration services, sometimes leading to black markets, such as human smuggling operations (e.g., coyotes). Each act of migration changes the social and economic landscape, influencing future migration decisions and making continued movement more likely.
6. What is the history of U.S-Mexico migration? How does this history relate to
contemporary patterns of immigration?
1848 Treaty of Guadalupe Hidalgo
U.S acquires present day California, Arizona, New Mexico, and Texas (parts of Colorado, Nevada, and Utah)
Nearly all Mexican Americans today came after 1848
The Era of Enganche: 1900-1929
The arrival of railroads increased connections ‘western economy is desperate for workers
U.S recruiters employ coercive policies (“the hook” or “indentured”)
WW1 increases labor needs
1917 Congress seeks to limit immigration (Attorney General exempts Mexico)
Numerical limitations are not applied to Mexico
Mexico is experiencing political and economic instability (1910-1920) due to the Mexican revolution
The Era of Deportations: 1929-1941
During the Great Depression, immigrant attitudes harden
U.S launches coordinated deportation campaign
Mexican population in U.S drops by 41%
1930: 639,000
1940: 377,400
The Bracero Era: 1942-1964 (-5 million Mexicans)
WWII creates huge demand for labor, particularly in agriculture
Binational agreement to bring temporary farm workers from Mexico
168,000 workers
1954: INS launches “Operation Wetback”
Substantially increases border apprehensions (>1 million)
Double the number of braceros (-400,000 - 450,000)
The Era of Undocumented Immigration: 1965-1985
In the same vein as the civil rights movement, Congress ends the bracero program
Growers have become dependent on Mexican labor
22 years of the program had created a structural demand (farm labor is now viewed as “foreign” work)
Program created significant stock of migrant related human and social capital
A gov’t sponsored program that set in motion the self-perpetuating forces of cumulative causation
By 1982, Mexican economy collapses
Sharp reductions in the number of Mexican legal immigrants allowed
Chance of capture is ⅓
Leads to “repeated trials model”
Largely circular (28 million entries, 23.4 million departures)
The Great Divide: 1986-2000
1986 Immigration Reform and Control Act (IRCA)
50% increase in INS funding
Sanctions on employers who hire undocumented workers
Amnesty program for long-term undocumented immigrants
Legalized ~ 2.3 million
As legislation wound down, undocumented immigration picked up
The historical patterns of Mexican immigration to the U.S., as outlined in these eras, have directly shaped contemporary immigration trends in multiple ways:
1. Structural Dependence on Mexican Labor
The Bracero Program (1942-1964) established a long-term reliance on Mexican labor, particularly in agriculture. Even after the program ended, the demand for low-wage labor remained, and undocumented immigration increased.
Today, the U.S. economy, especially in industries like agriculture, construction, and service work, continues to depend on Mexican and Central American migrant labor. Many of these jobs are still considered “foreign” work, echoing the patterns set in motion by the Bracero Era.
2. Cycles of Restriction and Legalization
The Era of Deportations (1929-1941) and Operation Wetback (1954) show that economic downturns and shifts in public sentiment often lead to stricter immigration enforcement.
Similarly, contemporary policies fluctuate between crackdowns (e.g., increased ICE raids and border security) and legalization efforts (e.g., DACA and temporary protected status programs).
The 1986 IRCA legalized millions of undocumented immigrants but also strengthened enforcement—a pattern that continues today, with discussions about border security often tied to potential legalization pathways.
3. Cumulative Causation and Social Networks
The Bracero Era and Era of Undocumented Immigration (1965-1985) helped establish migration networks, where past migrants assist new migrants in finding work and settling in the U.S.
Today, these networks continue to facilitate immigration, including undocumented migration. Family ties and community support structures built over decades play a major role in sustaining migration patterns.
4. Tightened Immigration Policies and Militarization of the Border
Since the Great Divide (1986-2000) and the IRCA, border security has increased dramatically, making it more difficult and dangerous for migrants to cross.
Contemporary policies, such as the expansion of Border Patrol and the use of technology (drones, surveillance), reflect an ongoing effort to control migration, despite continued demand for labor.
Unlike earlier periods of circular migration (e.g., high return rates during the Bracero Program), stricter enforcement has encouraged permanent settlement rather than seasonal migration, since returning to Mexico has become riskier and more expensive.
7. What does Gonzales mean when he says undocumented youth need to “learn to be
Illegal?”
Youth need to “learn to be legal”: Gonzales uses the phrase “learning to be illegal” to describe the transition that undocumented youth undergo as they move from a legally protected childhood to an adulthood marked by exclusion and illegality. During childhood and adolescence, undocumented youth often experience a form of “suspended illegality,” where they can attend school and participate in social life without direct legal consequences. However, as they transition to adulthood, they begin to encounter significant barriers when they attempt to access higher education, obtain a driver’s license, or seek legal employment. Gonzales argues that undocumented youth must retool their aspirations, daily routines, and survival strategies to adapt to the constraints of illegality. This process places them in a state of developmental limbo, preventing them from fully integrating into society and often leaving them vulnerable to economic exploitation and social exclusion.
How does being undocumented affect the transition to adulthood?
Undocumented youth cannot legally work, vote, receive financial aid, or drive (in most states), and there is constant fear of deportation
As a result, unauthorized status becomes a defining feature of late adolescence and early adulthood.
Identity formation
Friendship patterns
Aspirations and expectations
Social and economic mobility
Discovery: Ages 16-18
Through school, they developed aspirations rooted in the belief that they were part of the fabric of the nation and would have better opportunities than their parents
There was a “jolt” around age 16
Finding a part time job, applying for college, and obtaining a license – all markers of transition – require legal status
Fear of detection curbed interactions with teachers and peers.
Uncertainty in the future and severing of support structures led to withdrawal.
Many were unaware of resources available.
Learning to Illegal: Ages 18-24
The realization of a few choices sets in.
Difficult to make successful transition to college
Sufficient money
Family permission to delay or minimize work
Reliable transportation
External guidance and assistance
Coping: Ages 25-29
They begin viewing their legal circumstances as permanent
Many drop career aspirations for security and stability
Especially difficult for college educated
Why?
No advantage in the low-wage labor market
The only markets they have access to.
The entry into a stigmatized identity has negative and usually unanticipated consequences for their educational and occupational trajectories, as well as for their friendships and social patterns.
Fear of becoming a disenfranchised underclass.
Whether they become a disenfranchised underclass or contributing members to our society, their fate rests largely in the hands of the state
8. How does the process of “illegality” differ by factors such as generation, gender, or
local context?
Generation
First-generation immigrants (e.g., Mauricio, the father): Experience illegality as personal devaluation, feeling that their life is inherently worthless without legal status. Mauricio’s quote, “without papers, life isn’t worth much,” reflects this deep sense of exclusion and marginalization.
1.5-generation immigrants (those who came as children): Experience illegality as stigma, which Goffman defines as a process that spoils one’s normal identity based on societal reactions. They grow up in the U.S. and feel like they belong, yet they face constant reminders that their legal status marks them as different. Isabel’s statement about the word “undocumented” being her “scar” highlights how stigma is both negative and all-encompassing, shaping their identity.
Coping and Socialization: Since they are raised in the U.S., the 1.5 generation may take risks their parents wouldn’t, as seen in Mario’s actions at the airport. They also attempt to minimize their stigma by emphasizing meritocratic values—arguing that their education and contributions should validate their belonging. The idea that being in high school or college proves their worth reflects an effort to distance themselves from negative stereotypes of undocumented immigrants.
Resentment Toward Structural Injustice: Some, like Jovani, express frustration that they are being punished for something beyond their control—having been brought to the U.S. as children. This highlights the broader issue of structural inequity, where legal status creates lifelong consequences for individuals who had no agency in their migration.
Gender
Mothers struggle with the inability to care for their children as expected due to prolonged separation, stress, and limited access to social services. Regardless of their immigration status, they often feel lost in seeking help, as expressed in the quote: “The hard part is that we don’t know where to find help anymore.”
Fathers face pressure to fulfill the traditional role of financial provider. Their work often places them in public spaces, increasing their risk of detention, unlike women, who spend more time in private spaces and feel less threatened by immigration raids. As one father states: “We put ourselves at risk because we have no other choice.”
Young women experience illegality as a stigma affecting their self-image, feeling unattractive or undesirable. They attempt to counteract stereotypes by presenting themselves as clean and organized: “I want to look clean and organized so I don’t fit the label.”
Young men see illegality as a barrier to social life and relationships, particularly in dating, where financial limitations make them feel inadequate: “I can’t say ‘hey let’s go out, but you have to pay.’ That’s not cool. So I just don’t go out.”
Local Context
Living in a community with mixed-status families can be helpful
“It hasn’t been easy, but we feel comfortable in our community” (Aminta)
Nayeli had to keep her father’s status a secret
Felt hostility from neighbors on immigration issues
Mixed Families:
The concept of mixed-status families—where some members are documented (often older siblings or parents), while others are undocumented (often younger siblings with birthright citizenship)
(people in families who are documented, most often parents or older siblings, vs people who are undocumented, most often younger siblings with birthright citizenship)
“Talking about my mom is hard, If she ever was late, if she wasn’t back from church or from work on time we all worry…(Mayra U.S citizen)
A sense of insecurity makes it difficult to build solidarity
Neighbors, even documented, may avoid police to protect their undocumented neighbors
Ex: child with broken bone but no one called an ambulance
9. How do undocumented workers face a “double disadvantage” in the labor market?
The undocumented are 1.) channeled into the secondary labor market (meaning working for a non-Mexican employer and being paid cash with no taxes withheld), and 2.) they earn less money than their legal counterparts (regardless of their employment sector)
Why is the secondary labor market bad? → Illegal immigrants are often channeled into low-paying, unstable jobs with little security or opportunity for advancement. These jobs typically lack benefits like healthcare, legal protections, and job security.
Unauthorized Mexicans and the Labor Market
Not since the days of slavery have so many residents of the United States lacked any social, economic, or political rights and enjoyed so few legal protections.
What is secondary labor employment?
Working for a non-Mexican employer and being paid cash with no taxes withheld
10. What is selection bias?
Selection bias occurs when the individuals or groups being studied are not randomly selected, leading to results that are systematically skewed. This bias can arise when certain characteristics influence who is included in or excluded from a study, making the findings unrepresentative of the broader population.
Hard to measure immigration. Selecting Immigrants → Undocumented vs Documented
Ex: Article Evaulation: Didn’t include information about what population was being studied → Undocumented vs Documented
11. What are the trends in immigration enforcement?
Trends in Immigration Enforcement
Increasing Border Security and Spending
The U.S. has significantly increased immigration enforcement, spending more on it than on the FBI, DEA, Secret Service, Marshalls, and ATF combined.
Border Patrol budgets have steadily risen, along with the number of federal law enforcement officers deployed for immigration enforcement
Tighter Laws and Policies
Major legislative efforts include the Immigration Reform and Control Act (1986), Illegal Immigration Reform and Immigrant Responsibility Act (IIRIRA) (1996), USA PATRIOT Act (Creates the Department of Homeland Security and increases Border Patrol budget an additional $300 million dollars), and others that expanded enforcement powers
Shift from Circular to Permanent Migration
In the past, migration between the U.S. and Mexico was more circular (workers would come and go).
However, due to higher risks and costs of crossing, many undocumented immigrants now stay in the U.S. permanently instead of returning home
Why did immigration enforcement “backfire?”
Why didn’t “deterrence through prevention” work?
As border crossings became riskier and more expensive, fewer migrants returned to Mexico.
Instead of deterring migration, enforcement encouraged migrants to stay longer and settle permanently → creates ethnic enclaves
Little to change the underlying macroeconomic factors
An abundant supply of labor and low wages in Mexico juxtaposed with perpetual demand for labor and higher wages in the U.S.
Since job opportunities in the U.S. remained attractive, migrants continued to come despite stricter enforcement
(2) Social Capital Theory
Through network connections, migrants gain access to information and assistance for unauthorized border crossing
Prior to 1986 there was already a well-developed infrastructure of social networks (including employment networks) capable of supporting and sustaining undocumented border crossing and settlement in the United States
What did Border Enforcement do?
Border enforcement decreased the odds of crossing at traditional locations (San Diego, El Paso)
As migrants were diverted away from relatively safe and well-trod pathways in urban areas into more remote, isolated, and environmentally hostile sectors of the border, crossings grew increasingly difficult and hazardous, and the share relying on the services of a paid guide, which had always been high, steadily rose.
70% in 1970 to 100% in 2010
12. What are the trends in local immigration ordinances?
The Law and Order Foundation of Local Ordinances
2005 and 2010, state legislature enacted over 300 anti-immigration laws (Gulasekaram and Ramakrishnan)
259 anti-immigrant laws were proposed by local governments (county, city, etc)
Research Question: How do policy makers and citizens talk about policies dealing with undocumented immigrants? How are problems and solutions framed?
Local Immigration Ordinances
Hazelton, PA
Illegal immigration Relief ordinance passed in July 2006
Led by Mayor Lou Barletta
During 5 hours on the witness stand he said Hazelton is being ruined by violent crime, crowded schools, and a clogged emergency room at the city’s private hospital. Though he admitted he had no idea how many such immigrants are in his city
Immediately challenged. Both District and Circuit courts rule the employment and rental provisions unconstitutional because they were preempted by federal law.
Escondido, CA
Similar to Hazelton. Law passed in Oct. 2006 by a 3-2 vote banning landlords to rent to undocumented immigrants
Challenged in court and the City agreed to permanent injunction.
Gov. Schwarzenegger signs AB 967 (2007) prohibiting cities from enacting laws that require landlords to check legal status and bars landlords from voluntarily doing so
Farmers Branch, TX
Nov. 2006 Ordinance 2892. Cannot rent to undocumented immigrants. English only ordnance and 287(g) agreement with ICE
Rental ban is declared unconstitutional (Supreme Court refuses to hear appeal)
Prince William County, VA
Oct. 2007 Resolution 07-894
Restricts social services to elderly undocumented and those with disabilities. Limits access to drug treatment. Verification of legal status for business permit and expands 287(g) program to include juvenile detention facility.
Evaluations of this policy show a reduction in non-citizens, but minimal impact on crime and cost saving.
a. How are these policies framed?
Framing:
“The people of the City of Hazelton find and declare…that illegal immigration leads to higher crime rates, contributes to overcrowded classrooms and failing schools…”
Farmers Branch wants to safeguard against terrorism.
Five Categories of Framing:
1. Political / Legal (“Law & Order”)
2. Nationalistic / Cultural
3. Traditional Quality of Life
4. Economic
5. National Security
(1) Law and Order
Order vs Chaos
“I simply want my city back”
“I think the board has emphasized that this is about the rule of law. It’s what our American civilization is all about; this is the basis of it.”
“America is a country of laws...If we break down our laws, this country will fall to ruin.”
“Not to implement law is...to create anarchy...That is Mexico”
(1) Illegal is Illegal
“It’s real simple; when you cross the border illegally, you compromise the sovereignty of the country. And despite what everybody else has told you, if you’re here illegally, if you cross the border illegally, you are a criminal! Don’t keep saying, ‘I’m not a criminal. I’m not a criminal.’ You’re a criminal.”
“Once a human being has broken the law, he has an easier step...to break more laws.”
When you start justifying once criminal act, it becomes easier and easier to justify more . Illegal is illegal, period.”
(1) Legal v Illegal
“What I witnessed was a direct slap in the face to all hardworking, law- abiding citizens of this country...our elected officials need to reprioritize the concerns of our law-abiding, legal residents over those who are operating lawless in our country.”
“The illegal aliens need to protest in their own country and cities, not ours. We are being invaded and need to take back what’s ours.”
“We are not against immigration, because that is what this country, this country, was built on, but they came here as citizens. They saluted the flag, they held our flag, and they conformed to the way of the American people. And it is a great country. And that is all we are saying today. The word is ‘illegal,’ against the law, ‘illegal’, and I support this motion.”
The effect of Local Ordinances?
State omnibus immigration laws targeting undocumented immigrants result in immigrant outflows of population and employment. However, there is little evidence of native “inflows.” In fact, some of these groups actually experience an adverse impact on population and employment associated with implementation of the immigration legislation. (Good 2013).
Noncitizen and naturalized Latinos from states without such policies were much less likely to move to states with them than in the 1990s. U.S.-born Latinos exhibit migration aversion to hostile states, albeit at a weaker level.
13. Why might immigration increase crime? Why might immigration decrease crime?
What does the weight of the evidence say in regard to the immigration-crime nexus?
Decreased Crime:
(1) Selection
People who come here are highly motivated because it's difficult to come to the U.S. (“playing the long game”)
Ability to delay gratification because there’s more at stake
(2) Formal social control
Worst punishment under the law for immigrants (strong incentive to avoid criminal wrongdoing)
Hiring more police if constituents are worried about crime
(3) Social capital and family structure
Economic revitalization and social networks
Ex: ethnic enclaves → Chinatown
More likely to have better family structure (2 parent home vs 1 parent)
Immigrants more likely to be entrepreneurial (economic revitalization)
Immigrant communities are tight knit = economic growth
(4) Cultural diffusion
The code of the streets
In certain places, what matters is your reputation. You want to have a reputation of someone who shouldn’t be messed with. E.g. in certain neighborhoods not making eye contact
Immigrants don't understand the code of streets, so things that may have turned into a conflict don’t actually occur because they don't share the same culture of violence. The issue diffused before it even started.
Increased Crime
Crime-prone population
Young men are more likely to immigrate → younger people likely to commit more crime
Population instability
Social disorganization theory
New immigrant communities often experience economic hardship, population instability, and weak social ties, making them vulnerable to crime and disorder.
This is because informal social controls (strong community ties, neighborhood watch, cultural norms) take time to develop.
Different immigrant groups = more conflict between groups
Poor labor market opportunities
Poverty, low educational attainment
Double disadvantage
Lost economic prospects for native workers
Lower socioeconomic status and education are more likely to commit crime, if immigrants come and take these jobs then crime would increase. Immigration increasing poverty for certain groups
Competitive pressure on low skill jobs
Illegal drug markets
What does the weight of the evidence say in regard to the immigration-crime nexus (relationship)?
There is not overwhelming evidence for one side, but there’s a weak negative correlation.
14. What is the Paradox of Assimilation?
As their children (second and third generations) assimilate, they may experience worse educational, economic, and social outcomes rather than improvement.
This contradicts the expectation that each successive generation will do better than the last.
2nd generation immigrants show educational and socioeconomic improvements over their parents but…
They tend to fare worse on crime, health, divorce, substance use
1st generation brought as young children have higher crime than those brought as older children
Pattern holds for most racial/ethnic groups, except Asian immigrants
2nd generation tends to be less crime prone
Why?
2nd generation engage in crime for the same reasons that explain involvement in crime among typical native-born youth
Overall trend: shows that second-generation immigrants commit crimes at lower rates than native-born individuals, those who do engage in crime tend to be influenced by social and environmental factors rather than their immigrant background itself.
Ex: immigrants are more likley to move to a neghborhood of lower socio-economic status which could allow the children to engage in more criminal acts
Gang involved peers
Delinquent peers
Parental education
School attachment
Emotional ties to parents
15. Is the immigration-crime relationship similar in European countries?
In Western Europe, the story is different (Germany, Switzerland, Sweden)
1st and 2nd generation immigrants tend to be more involved in crime than native born
Immigrants with “illegal status” in the Netherlands more crime-prone than native born
In Germany and the Netherlands, Turkish and Moroccan 2nd generation tend to have higher crime rates than other groups
Complicated by lack of generation data and classifications due to citizenship laws
In the UK, immigrants with poor labor market opportunities are more likely to commit property crimes (true of native groups)
16. What are the contemporary debates on immigration and crime?
a. What is the evidence thus far regarding these more recent questions?
Authors of Debates: Shihadeh and Barranco 2010 | Feldmeyer and Harris 2013
Debate #1: Old vs New Destinations
Immigration may affect crime differently in new vs old immigrant destinations
Dramatic shift in immigrant destinations since 1990
Rooted in Social Disorganization
New destinations provide less immigrant opportunity
Immigrants in new destinations are less socially and economically integrated
Ex: Finding co-ethics in Ny vs in Nebraska | trying to find a Russian lawyer
Debate #2: Racial Differences?
Immigration may have varied effects for different racial/ethnic groups:
May increase black violent crime by displacing workers
May increase Latino violence in new destinations
Re-Examining Latino Immigration and Crime (Light, 2017) (argues that they use wrong tool in this article)
Major Limitation: Entirely dependent on cross-sectional data (2000).
Substantively: longitudinal data is better suited to examine “flow effects” - how change in one process affects change in another
Cross-Sectional: if immigrants move to worse off areas upon arrival, what will be the relationship between immigration and crime?
Positive relationship if the case was that immigrants moved to worse off places upon arrival
Longitudinal: If immigrants reduce crime over time, what will be the relationship between immigration and crime?
Homicide rates should be decreasing in New Destinations with the increase of Latino Immigration
Debate #3: Undocumented Immigration?
Undocumented: ? vs Overall/Latino (list of authors on the slide)
Data: U.S. States 1990-2014
Dependant Variables: Violent Crime rates (murder, robbery, assault, rape)
Focal Measure: Undocumented Immigration (lagged 1 yr.)
Source: Center for Migration Studies; Pew Research Center
Data lagged – used change in a year to estimate the change in crime to estimate it between a different year (independent variable has to become before dependent variable in this relationship)
Covariates: (lagged 1 yr) | structural disadvantage
Legal immigrants
Poverty
Low educational attainment
Single parent children
Percent black
Unemployment rate
Percent manufacturing
Perfect managerial/ professional
Percent urban
Incarceration rate
Gun availability
Drug activity
Less Crime or Less Reporting?
Unauthorized immigrants have strong incentives not to report crimes to the police
National Crime Victimization Survey (NCVS)
Annual
90,000 households (~160,000)
State-level estimates (2000-2012)
Violent victimization
Rape, sexual assault, robbery aggravated and simple assault
Robbery
Aggravated assault
Conclusions
Undocumented immigration negatively associated with violence
Challenges public perception and political rhetoric
Public policy implications
Secure communities did not reduce crime. Why?
AZ AB- 1070 and AL Bill 56 are unlikely to reduce crime
Debate #4: Undocumented Immigration, Drugs, and Alcohol Problems
“They weren’t all brought in by their parents. For everyone who's a valedictorian, there's another 100 out there who weigh 130 pounds — and they've got calves the size of cantaloupes because they've been hauling 75 pounds of marijuana across the desert.” – Steve King (Iowa Congressman)
Research Question: does the increase in undocumented immigrants correspond with the opioid epidemic? Alcohol problems?
Dependent variables
Druge arrests
Drug overdose deaths
DUI Arrests
DUI fatalities
Why use these meausres?
Arrests are a function of two people's behavior (the one getting arrested and the officier) change in policing behavior or individual behavior?
Debate #5: Undocumented Immigration and Terrorism (Social Science Research)
After 9/11, immigration policy became inextricable from counterterrorism policy
Competing Views
Undocumented immigration increases terrorism
Importing terrorists; radicalizations
Undocumented immigration is unrelated to terrorism
Few unlawful migrants come from terror-prone countries
Few terrorists in U.S. came lawfully
Debate #6: Does Immigration Enforcement Reduce Crime?
Not enough ICE officers right now
They need local cooperation
Secure Communities
Goal: to ensure that every person arrested for a crime by local law enforcement is screened by the federal government for immigration violations
In 2008, the pilot program ran in 14 jurisdictions. By 2013, the Department of Homeland Security (DHS) reported that S- Comm was active in all 3,181 countries
In its first 4 years, ICE detained over 250,000 immigrants through the program and has deported over 200,000.
Did Secure Communites Work?
No!
Comprehensive analyses of the Secure Communites program by two independent teams of researchers revealed no impact of S-Comm on crime.
Why not?
The increase in criminal deportations were primarily for less serious criminals, such as traffic offenders
Local immigration enforcement may undermine public safety by marginalizing immigrant communities and impeding cooperation between police and local residents
Debate #7: Do Sanctuary Policies Increase Crime?
Why would they?
Sanctuary Policies → these are areas that generally don’t cooperate with ICE
Lyons et al (2013)
How do immigrant political opportunities affect the relationship be/w immigration and crime?
San Diego Police Proc 6.18: “officers shall not make an effort to look for violations of immigration law.”
Madison: “an individual’s immigration status is immaterial with respect to MPD’s mission statement, core values, and operational systems. Immigration status is only relevant when an individual has committed serious crimes directly related to public safety.”
Neighborhoods benefit most from immigrant concentration in terms of homicide reduction in cities that limit local enforcement of federal immigration laws.
Why?
Favorable political contexts bolster social organization by enhancing trust and public social control within immigrant neighborhoods.
Closed regimes may foster processes that disrupt social organization, including immigrant distrust of local government, detachment from neighborhoods, and social isolation.
Debate #8: Do amnesty police policies affect crime?
Amnesty policies → not a path to citizenship
Why might IRCA affect crime?
Nearly 3 million legalized under IRCA
Large variation in the timing and geographic distributions of legalizations
Also variation when the amnesty programs ended (May 1988, LAW and Nov. 1988, SAW)
Legally authorized workers (1982)
Seasonal agricultural workers (1 year)
Amnesty had no effect on violent crime, but decreases property crime (Baker 2015)
Why?
Prospects are good in labor market could allow for more working hours (don’t know exactly why)
Amnesty had no effect on murder, assault, rape, arson, kidnapping or weapons offenses in Baker County, Texas (Freedman, Owens, and Bohn 2018)
But did decrease income-generating crimes
Consistent with the idea that when people have good labor market opportunities, they are less likely to engage in crime
Debate #9: Doesn’t any crime by an undocumented immigrant increase crime?
If the metric for “increasing violent crime” is that any person of a specific group has committed a crime, then this is true for literally all groups (i.e. all genders, ages, religions, sports, teams, etc.) For example, white grandmothers have committed violent crimes, as have children. Thus, would it be correct to claim that children increase violent crime? Or that removing grandmothers and children would make us safer?
Does this mean New York is more dangerous than Detroit?
Illustrative Example: Women are less violent than men.
Reply: That is not true because in 2015 over 78,000 women were arrested for violent crimes, and nearly 1,000 were arrested for homicide according to FBI records. Those statistics in no way contradict the original statement that men tend to be more violent. It doesn’t change the fact that in that same year men accounted for 80% of all violent arrests, and 89% of all homicide arrests. Which means that the rate of violent crime tends to be much higher among men than women. If there were no women, then the violent crime rate for the population would be the violent crime rate among men. Thus, for 2015 the violent crime rate would be 195 per 100,000 in the population without women, when in actuality the violent crime rate was 120 per 100,000 in the population. In other words, our chance of being violently victimized would be substantially higher were the population of women removed, even though they have committed tens of thousands of offenses. The same logic holds for removing immigrants.
Debate #10: Do undocumented immigrants commit more crime?
Data???
Neither the Unifrom Crime Reports (UCR), the National Crime Victimization Survey (NCVS), nor the National Incident-Based Reporting System (NIBRS) record information about immigration status.
Data Quality has gotten worse!
California stopped reporting the number of noncitizens in their custody to the Bureau of Justice Statistics (BJS) in 2013 and in 2017 became a “sanctuary state” by limiting information sharing between local criminal justice officials and federal immigration authorities (10). In 2016, they along with Nevada, New Hampshire, North Dakota, and Oregon did not report information on citizenship in their prison populations, and the BJS speculates that other states “likely provided undercounts” (11, p. 13).
Texas Dept. of Public Safety
Cooperate with DHS to check and record the immigration status of all arrestees throughout the state, including their legal status.
“To our knowledge, Texas is the only state that requires the determination and documentation of immigration status as part of its standard criminal justice records practice. Combined with the fact that we have complete information for every jailable arrest in Texas, our dataset is ideal for comparing the criminality between undocumented immigrants, legal immigrants, and native-born citizens. Simply put, no other data source in the United States could accomplish this task with the same degree of breadth, rigor, and detail.” (Light, He, and Robey 2020)
Debate #11: Historical Change in Immigration and Crime?
These differences are not due to changes in observable characteristics (age, race, marital status, state of residence, education).
Due to changed in immigration policy
No U.S. citizen immigrants show the greatest decrease and the timing is off (deportations did not show up until the 2000s)
Timing is off, saw an upturn in deportations → after 2000, especially after 2008 with Obama
Due to change in relationship b/w incarceration and crime?
Unlikely: would understate immigrant crime if CJ institutions were in favor of immigrants
Undocumented underreporting? Unlikely – they observe declines from all sending regions, citizens, and before increased deportations
The widening of the incarceration gap is part of a trend of growing differences between immigrants and the US-Born