Supply and demand
Demand: The quantity of a good or service consumers are willing and able to buy.
Price of the goods and services, person prefrences, and income are the main influencing factors.
The law of demand states that as the price of a good or service decreases, the demand increases. This is due to the fact that lower prices generally bring more buyers. There are exceptions, however they happen due to non-price factor, meaning that if just imagine that, for example, all goods were equal in quality, and there was no status associated with them, people would obviously rather buy an Anko handbag then a Chanel. However as luxury is associated with Chanel, it changes the demand of the handbag. The law of demand can be represented by how the demand curve is. You can see as the price goes higher, the quantity decreases.

Supply: The quantity of a good or service producers are willing and able to sell.
Main influence factors are technolgy, production costs and number of sellers.
The law of supply states that as the price of a good or service increases, the quantity a producer is willing to produce will also increase, a trend visible on the supply curve.

Equilibrium: Everyone in the economic field tries to reach equilibrium, or the clearing price. This where the demand level is equal to the level of supply.

Surplus: When there is a higher supply than demand, due to the fact that sellers have made the price point to high. To clear a surplus, sellers must decrease the price.
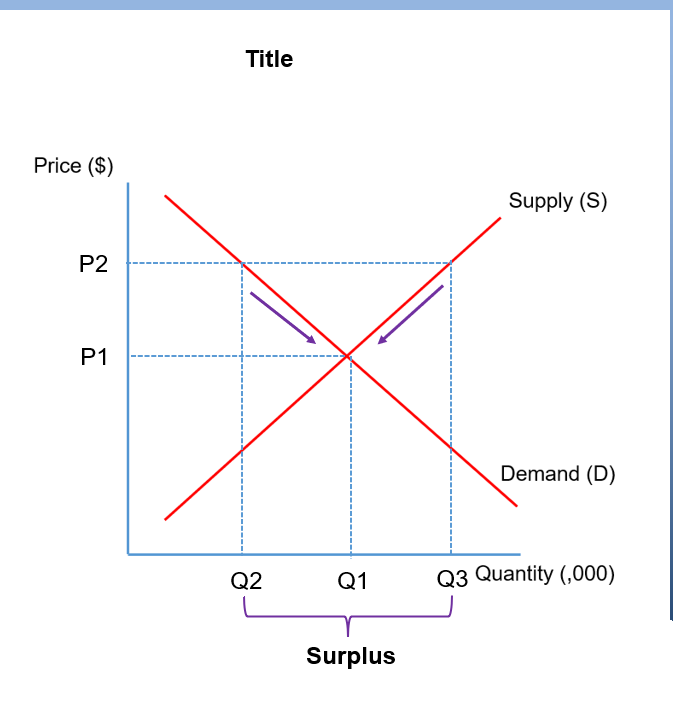
As you can see, P2 was the price set, making the quantity demanded only Q2, showing that for the stock to get cleared, at Q3, the price must go down.
Shortage: Opposite of surplus, when there is more demand then supply.

Curve shifts: Happens due to non-price factors, such as natural disasters causing there to be less of something, making the more expensive. Something such as this would cause a leftwards shift in the supply curve (as you can see in S2 below), as there is a decrease in the quantity being supplied. Something such as a subsidy in the cost of production causes there to be a rightwards shift (as you can see in S3 below) in the supply curve, as the supply increases due to the price being less to make.

Demand also does something similarly. For example, if a social media trend starts, the demand of a good/service will increase, and move rightwards (as we can see in D2 below). However if a social media post shows bad quality, it might mean the demand will decrease, causing a leftwards shift (as you can see in D3 below).
