Notes
INVESTIGATING MECHANISMS OF NEURAL BLAST CELL DIFFERENTIATION REGULATION BY A GROWTH FACTOR:
-As an organism completes development, more stringent restraints are placed on cells to prevent uncontrolled growth
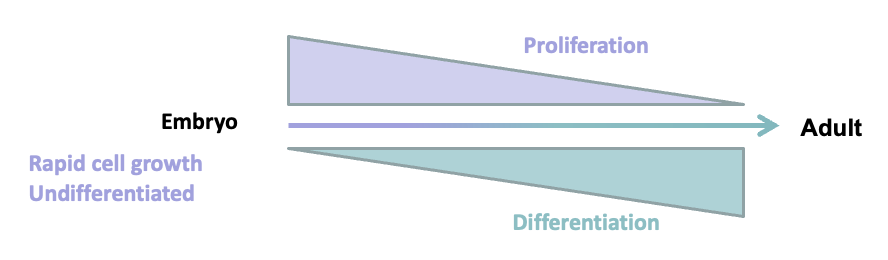
-differentiation= specialisation
-growth factors are peptides that are released by signalling cells to impact on the fate of target cells
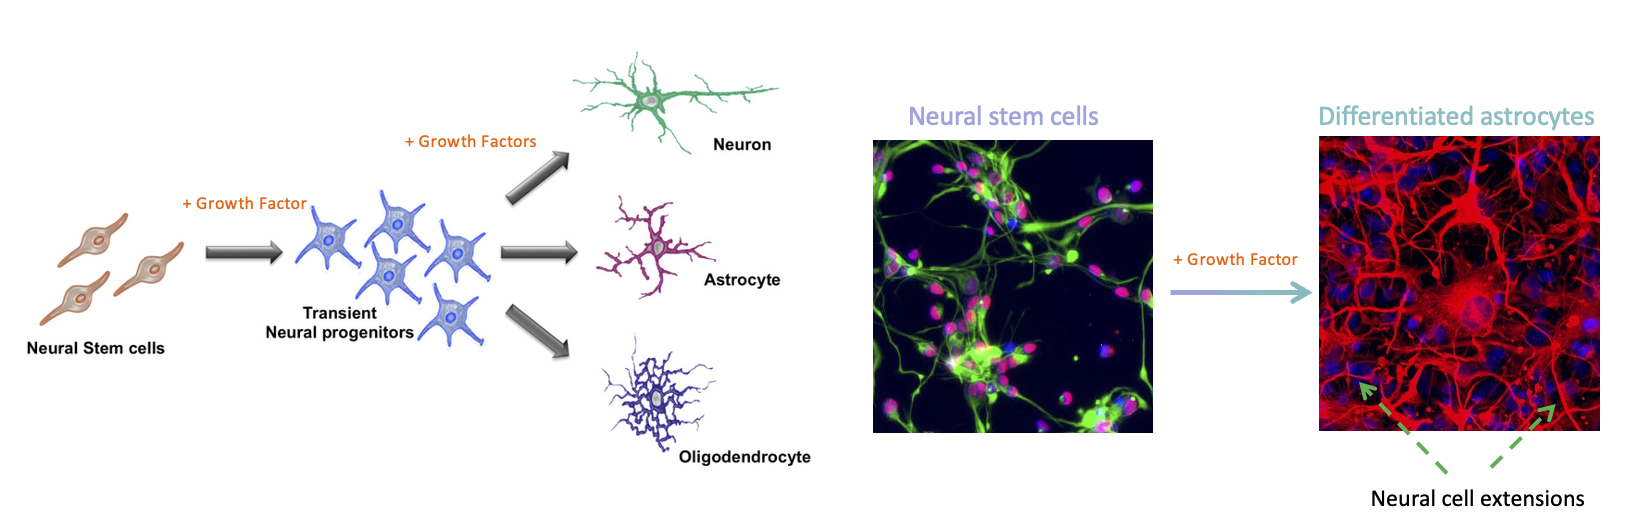
-growth factors can direct transient neural progenitor cells into their final differentiated form
-changes in gene expression is key for differentiation to take place
TO IDENTIFY GENES INVOLVED:
Candidate approach: informed analysis of genes you think may change in response to growth factor treatment using quantitative PCR. Downside is limited output
Global Analysis: RNA-sequencing allows all gene expression changes to be interrogated to identify cohorts of genes involved in differentiation
PRINCIPLES OF RNA SEQUENCING
-RNA sequencing (RNA-seq) is used to measure the amount of mRNA produced from each gene in a sample. If a gene is active, it is transcribed into mRNA, and RNA-seq can detect and quantify that.
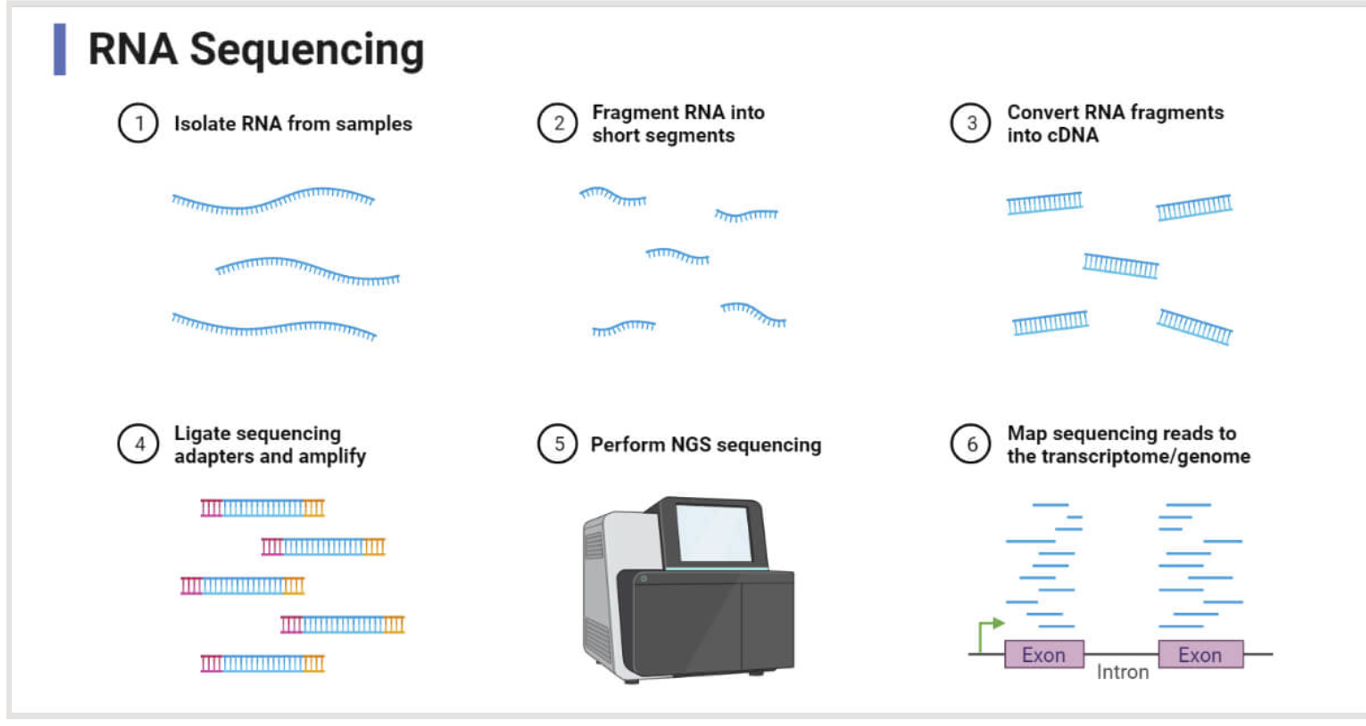
-No need to worry too much about process
-by aligning our sequencing reads to human genome we can identify all transcripts that are expressed in our cells. this is called Trancriptome
-we can compare transcriptomes between different cell populations: e.g those treated with and without growth factors to identify global transcriptional changes during process of differentiation.
-heatmaps can be used to present data, individual replicate samples are shown as columns, genes are shown on the right of the image and expression level is shown by the colour key
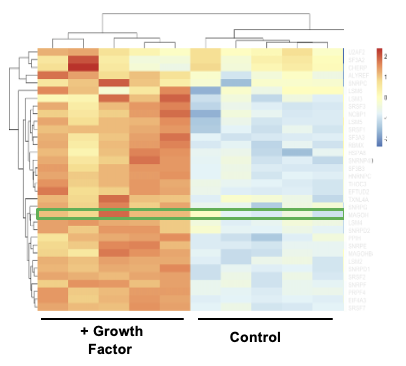
-yellow to red means increased expression, yellow to blue means decreased expression
-need to validate that your gene of interest’s mRNA levels are elevated upon cell differentiation:
-do this using quantitative reverse transcriptase PCR—> Isolate RNA, generate cDNA by reverse transcription, determine level of cDNA for the sequences of interest by quantitative PCR
-only 30% of genes with upregulated mRNA translate to increased protein expression
Techniques for Studying Protein Expression
Western Blotting
Immunofluorescence
ELISA
flow cytometry
Immunofluorescence
Immunofluorescence is a technique used to detect proteins directly in intact cells using antibodies, providing cellular distribution information.
Indirect Immunofluorescence-example to detect native synaptophysin in cells
Primary Antibody Binding: The primary antibody binds to the synaptophysin.
Secondary Antibody Binding: Conjugated to fluorescent tag
-when you get engagement of your secondary antibody to the primary antibod, the flourophore is activated and light emission is detected using a fluorescent microscope
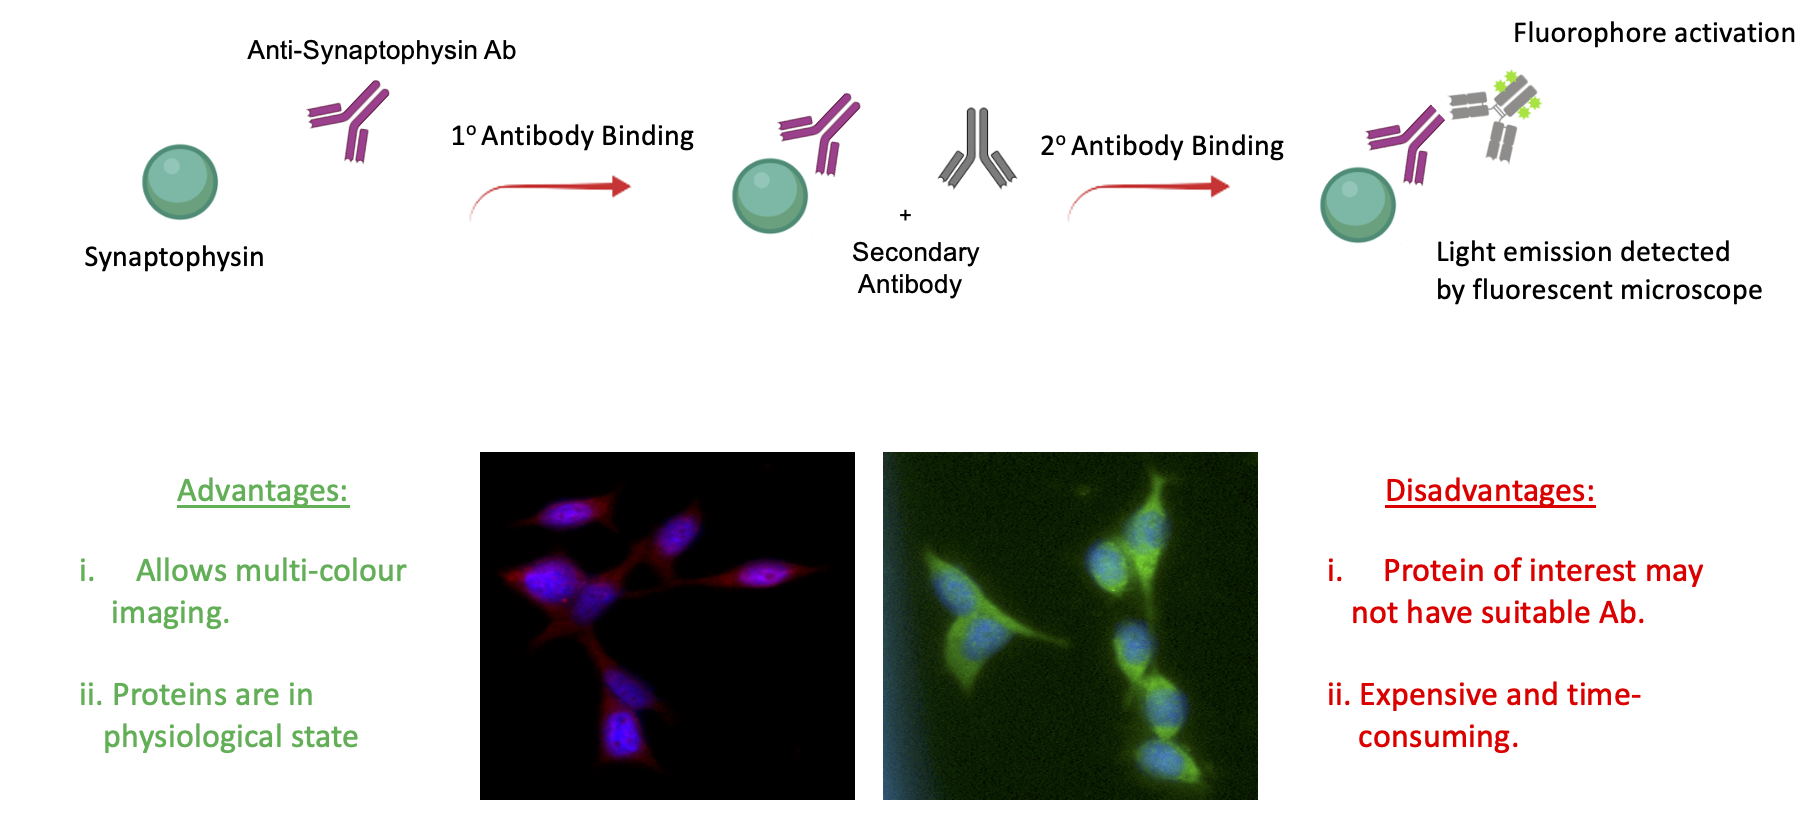
Advantages
Allows multi-colour imaging-can use different flourophores together in one experiment, would be used to see if 2 proteins are interacting as colours would merge
Proteins are in physiological state as in you haven’t modified it
Disadvantages:
Protein of interest may not have suitable Ab.
Expensive and time-consuming.
Direct Immunofluorescence
-take cDNA of gene of interest and clone it into a vector that contains the gene sequence for green flourecent protein (GFP). Transfect plasmid into cells so a GFP-Synaptophysin fusion protein generated inside the cells. GFP can be activated under particular light wavelength down a fluorescent microscope. when it lights up it will indicate where Synaptophysin is inside the cell.
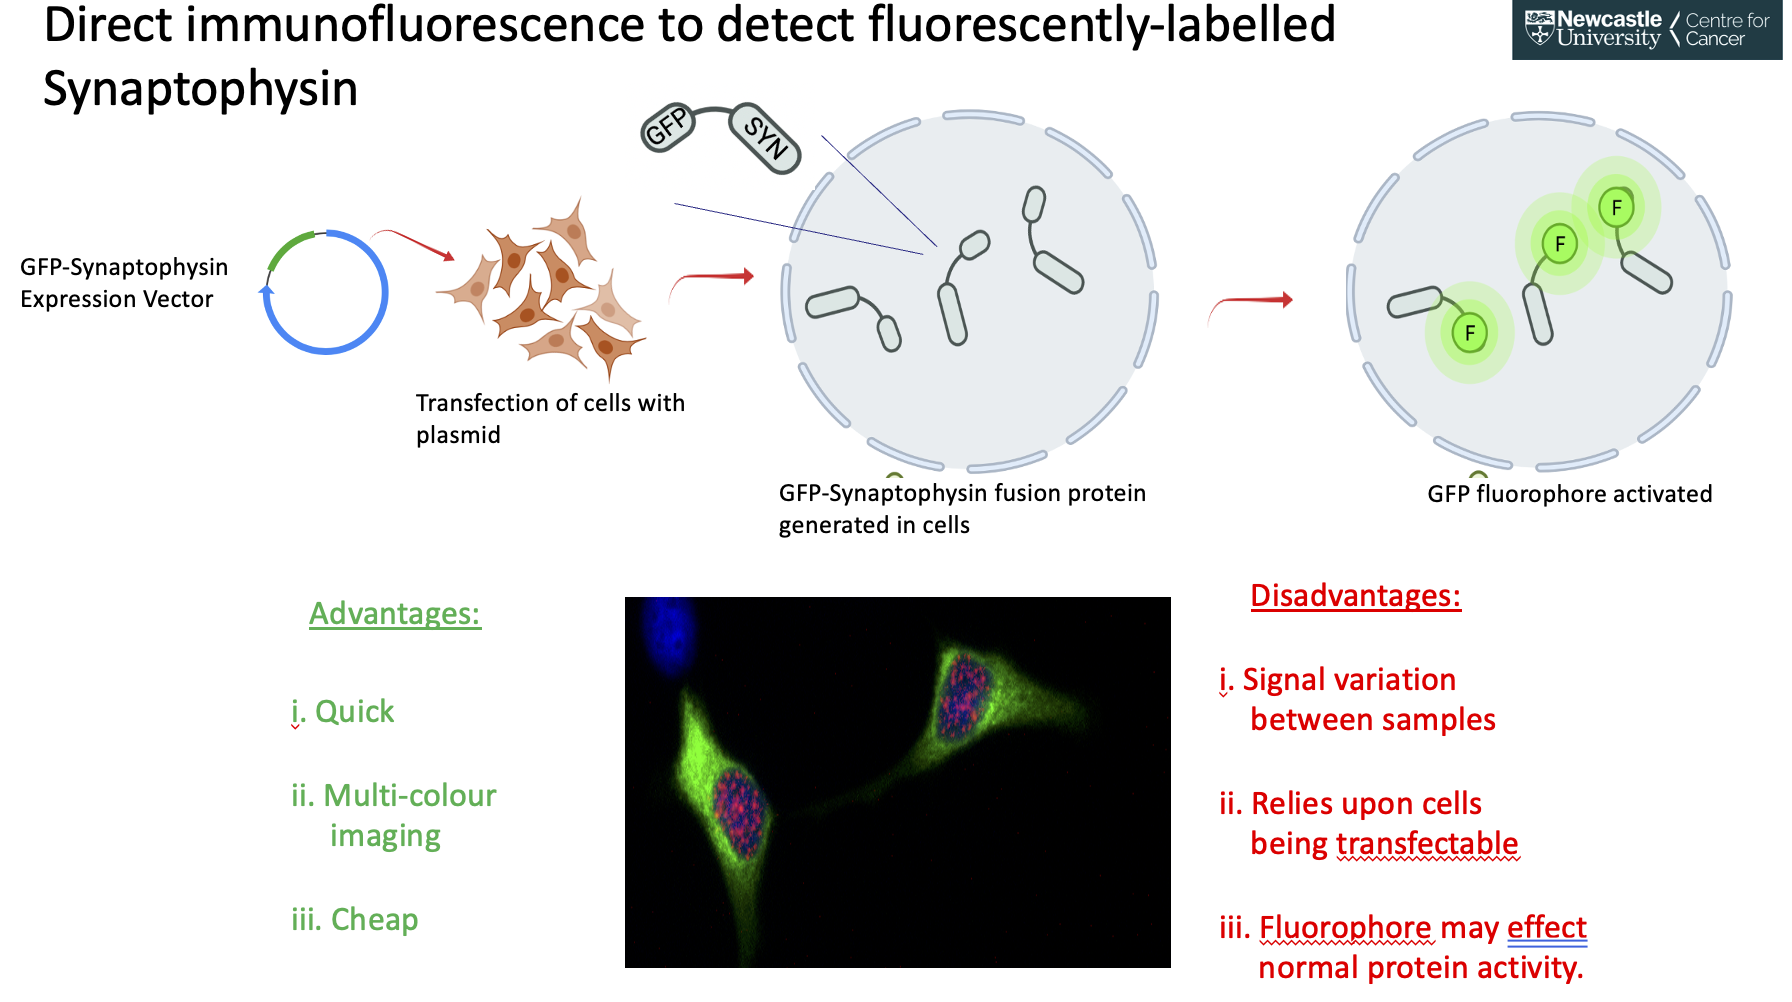
Advantages:
Quick
Multi-colour imaging
Cheap
Disadvantages:
Signal variation between cells in the samples
Relies upon cells being transfectable
Fluorophore GFP may affect normal protein activity.
Confirming Red Fluorescence is protein of interest in example experiment
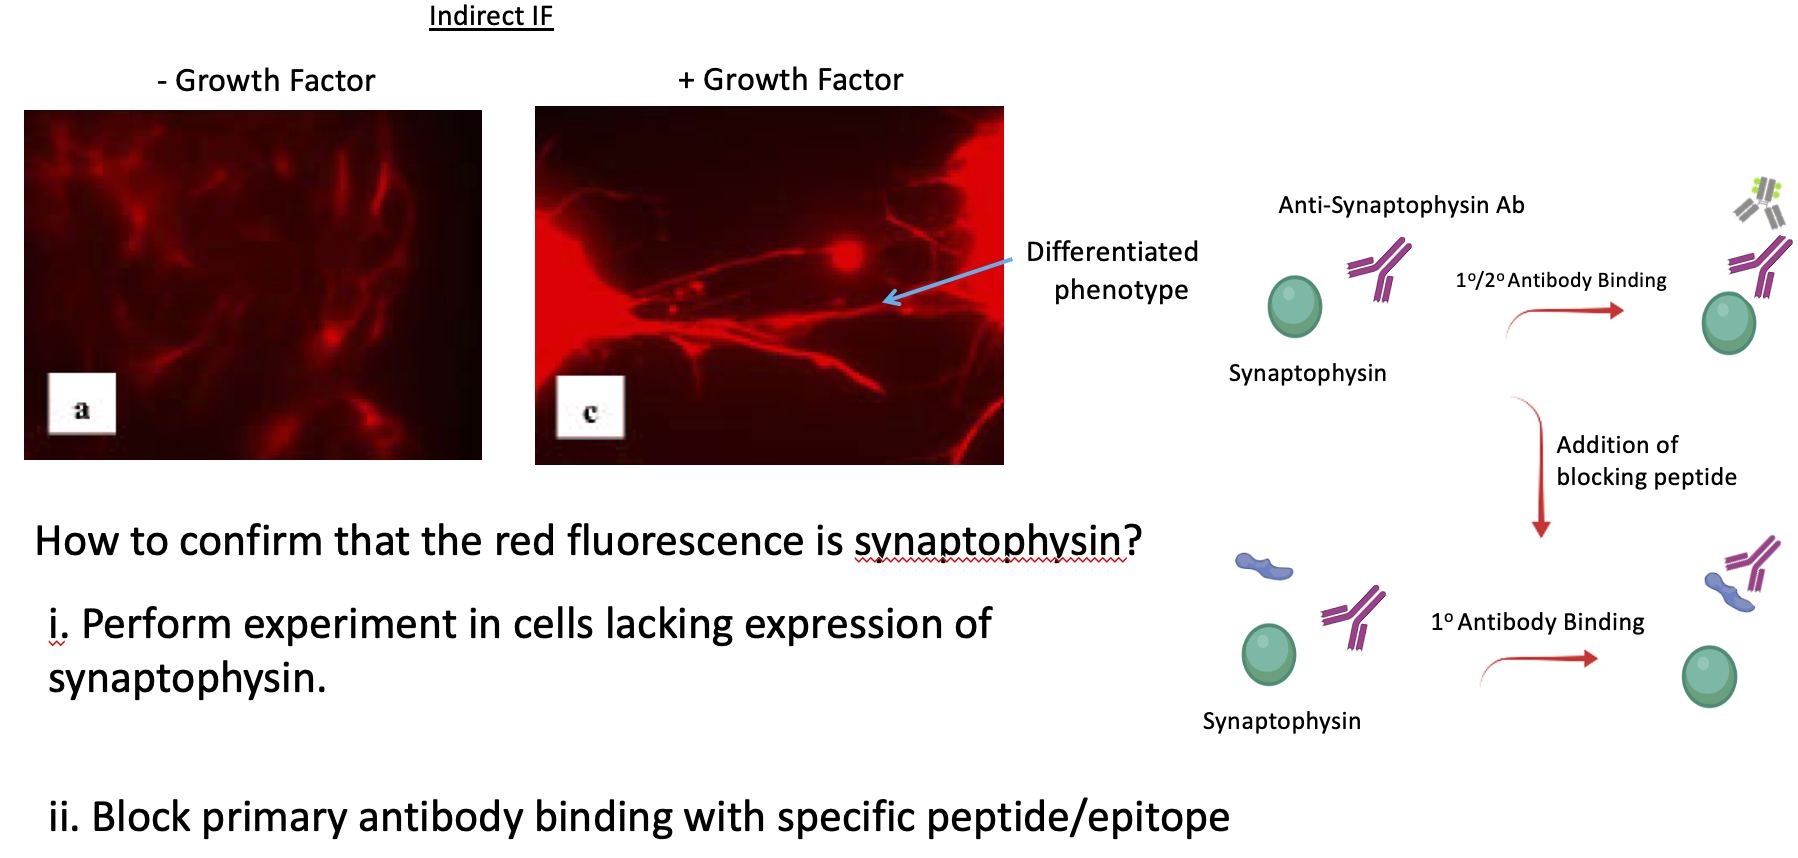
To confirm that the red fluorescence is synaptophysin:
Use a negative control by performing the experiment in cells known to lack synaptophysin expression (e.g. synaptophysin knockout cells or a non-neuronal cell line). If the antibody is specific, there should be no red fluorescencein these cells.
Pre-absorption control: Incubate the primary antibody with a specific blocking peptide or epitope (corresponding to the synaptophysin antigen) before applying it to the cells. If the antibody is specific, fluorescence should be significantly reduced or absent, indicating that the antibody is not binding non-specifically.
-now to quantify the level of increase in synaptophysin you would do an ELISA
ELISA (Enzyme-Linked Immunosorbent Assay)
ELISA is useful to quantify the level of a specific protein in a complex protein mixture (cell lysate).
Sandwich ELISA
Cell lysate is added to a vessel containing the capture antibody.
The target protein (analyte) specifically binds to the capture antibody.
The vessel is washed, and the primary antibody is added, which binds to the target protein.
The secondary antibody is added and selectively binds to the primary antibody.
The secondary antibody-conjugated enzyme is activated to generate a colour change.
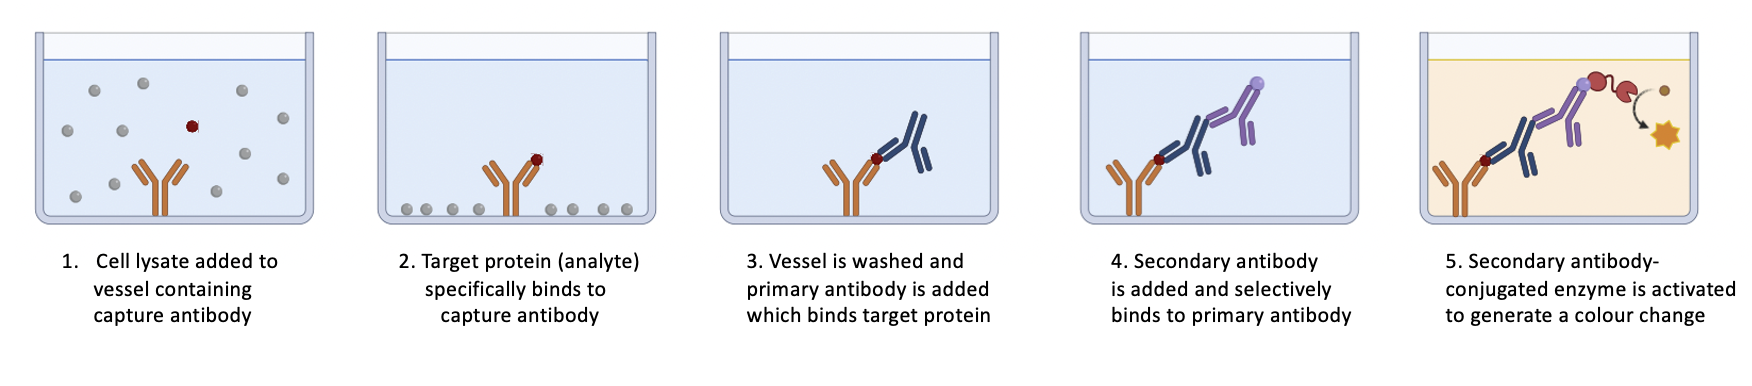
The intensity of colour change at end of experiment is proportional to the quantity of target protein in the mixture.
QUANTIFY SYNAPTOPHYSIN EXAMPLE:
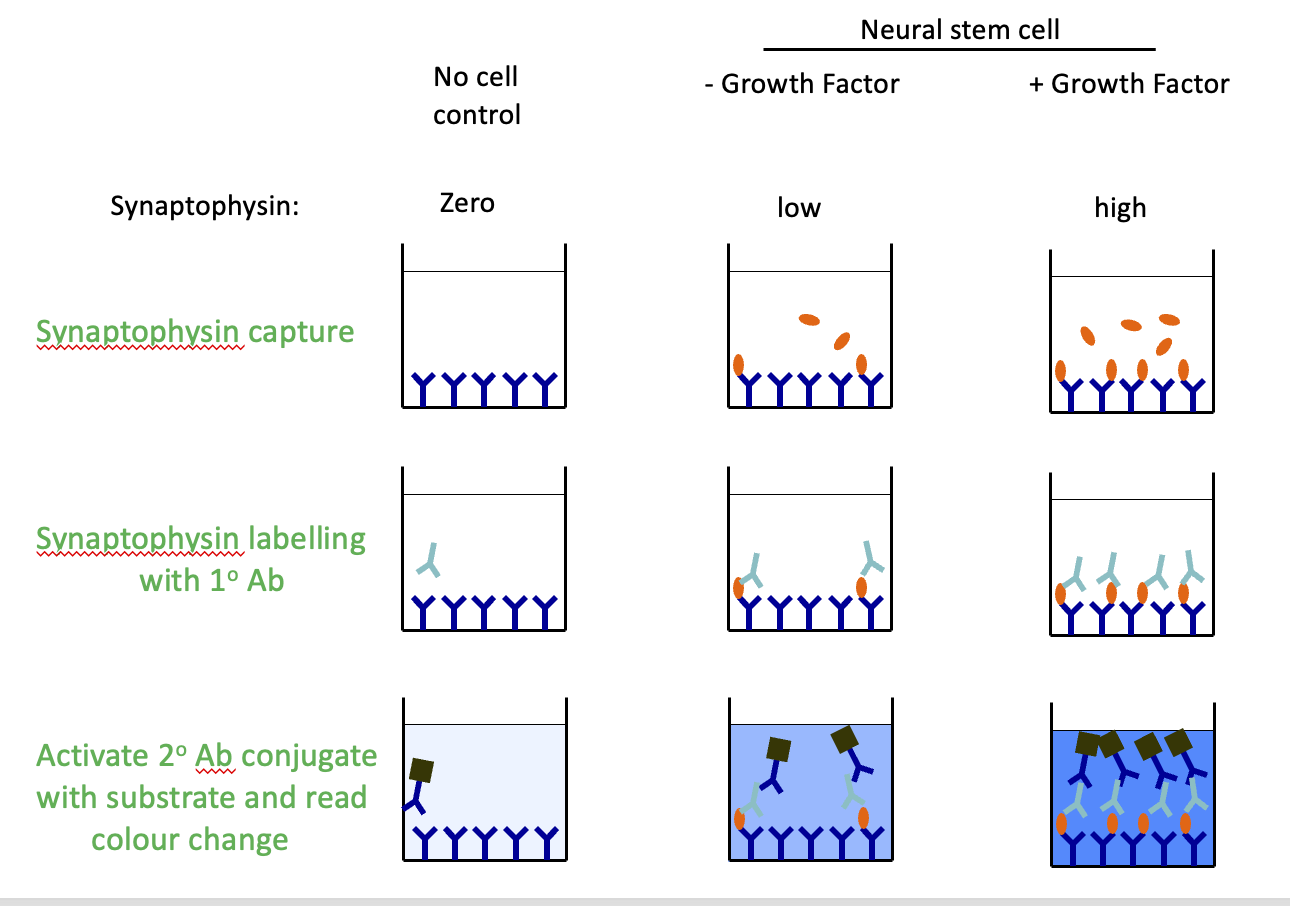
-assume that synaptophsyin levels will be low in absent of growth factors
QUANTIFYING UNKNOWN SAMPLES REQUIRES THE GENERATION OF A STANDARD CURVE:
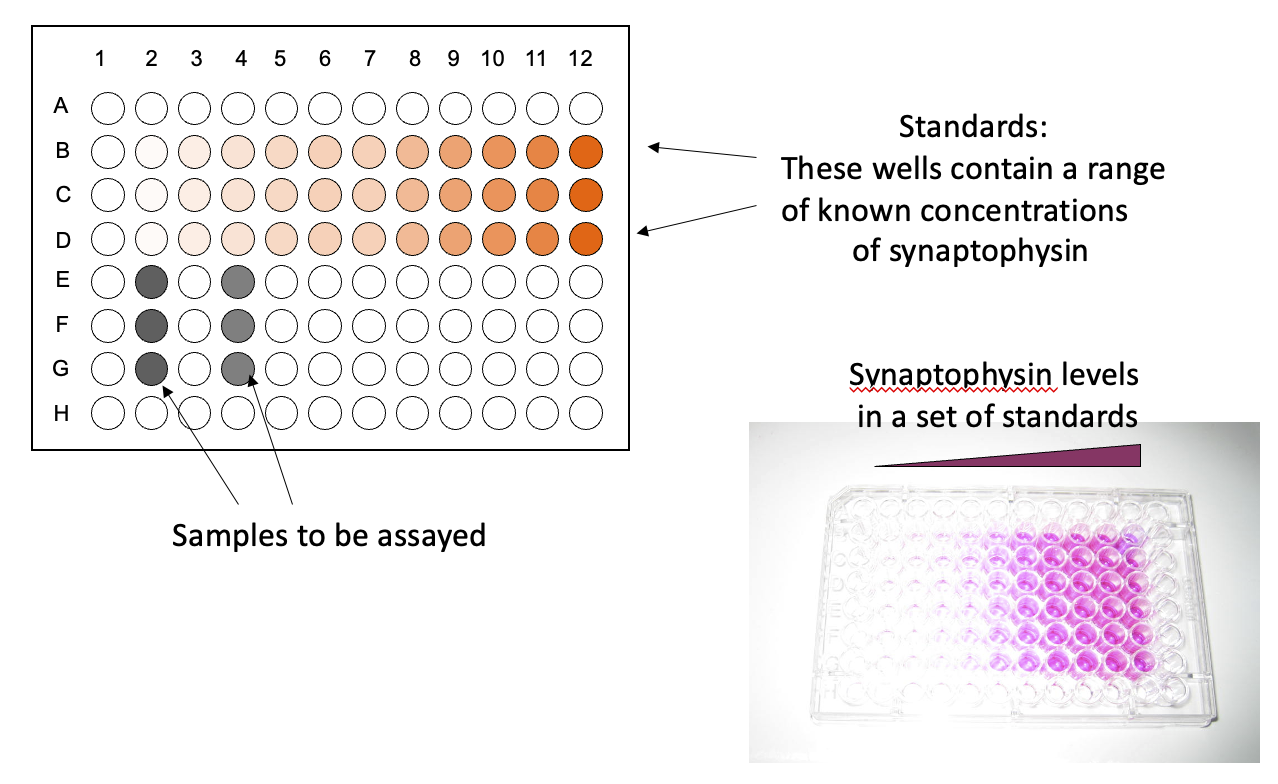
-Wells contain a range of known concentrations of synaptophysin to create a standard curve. Using standard curve we can work out how much synaptophysin is in our unkown samples
-colour changes read on spectrophatometer
-plotted in triplicate
Preparing for ELISA
cells grown on plates
Collect cell lysate.
Measure protein concentration. ([protein])
Student requires total protein per well in a total volume of .
Calculations Example
Concentration of untreated cell lysate =
Student requires for his experiment
What is the volume of lysate required to provide ?
Calculate dilution factor:
Calculate volume for : or
Add to generate solution
ELISA Plate Reading and Data Analysis
The ELISA plate is read using a spectrophotometer for each unknown and standard sample. Optical density is directly proportional to protein concentration.
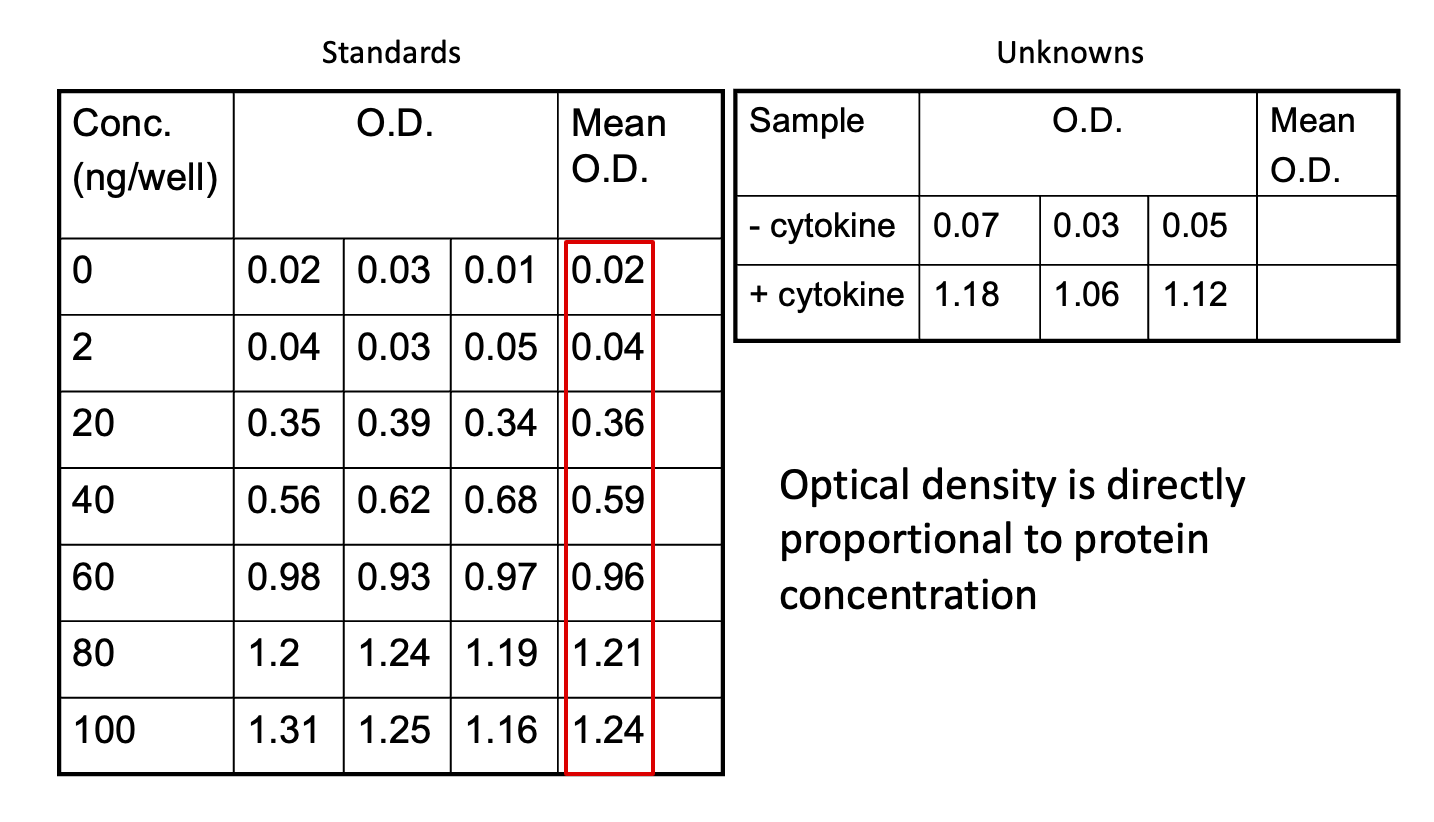
-optical density mean is directly proportional to protein concentration
Plot a curve of standard samples (Optical density. on y-axis; Protein on x-axis).
Estimate synaptophysin concentration in the 2 lysates.
-first step is to work out the mean OD values of the 2 unknown samples
-plot data and do a line of best fit
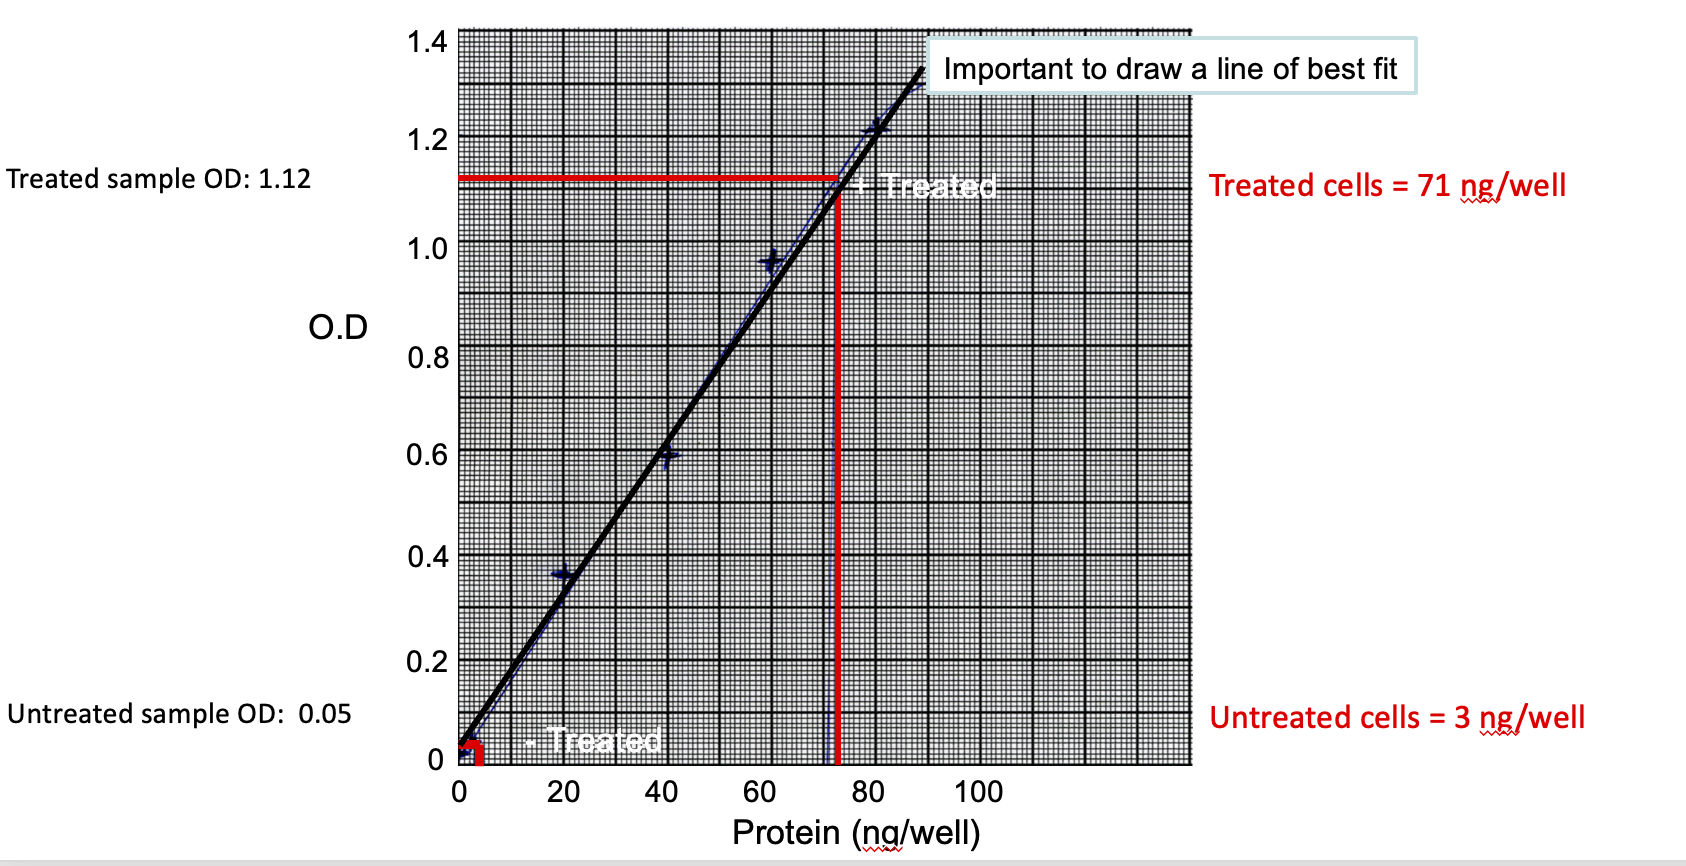
-then read off x axis the protein concentration
-the amount of total protein per well in untreated sample was 50 micrograms. in 50 ug total protein we have 3 ng synaptophysin in untreated cells
-must workout the amount of synaptophysin in 1mg of total protein:
1mg/50ug or 1000ug/50ug= 20
3ng x 20= 60 ng/mg in untreated cells
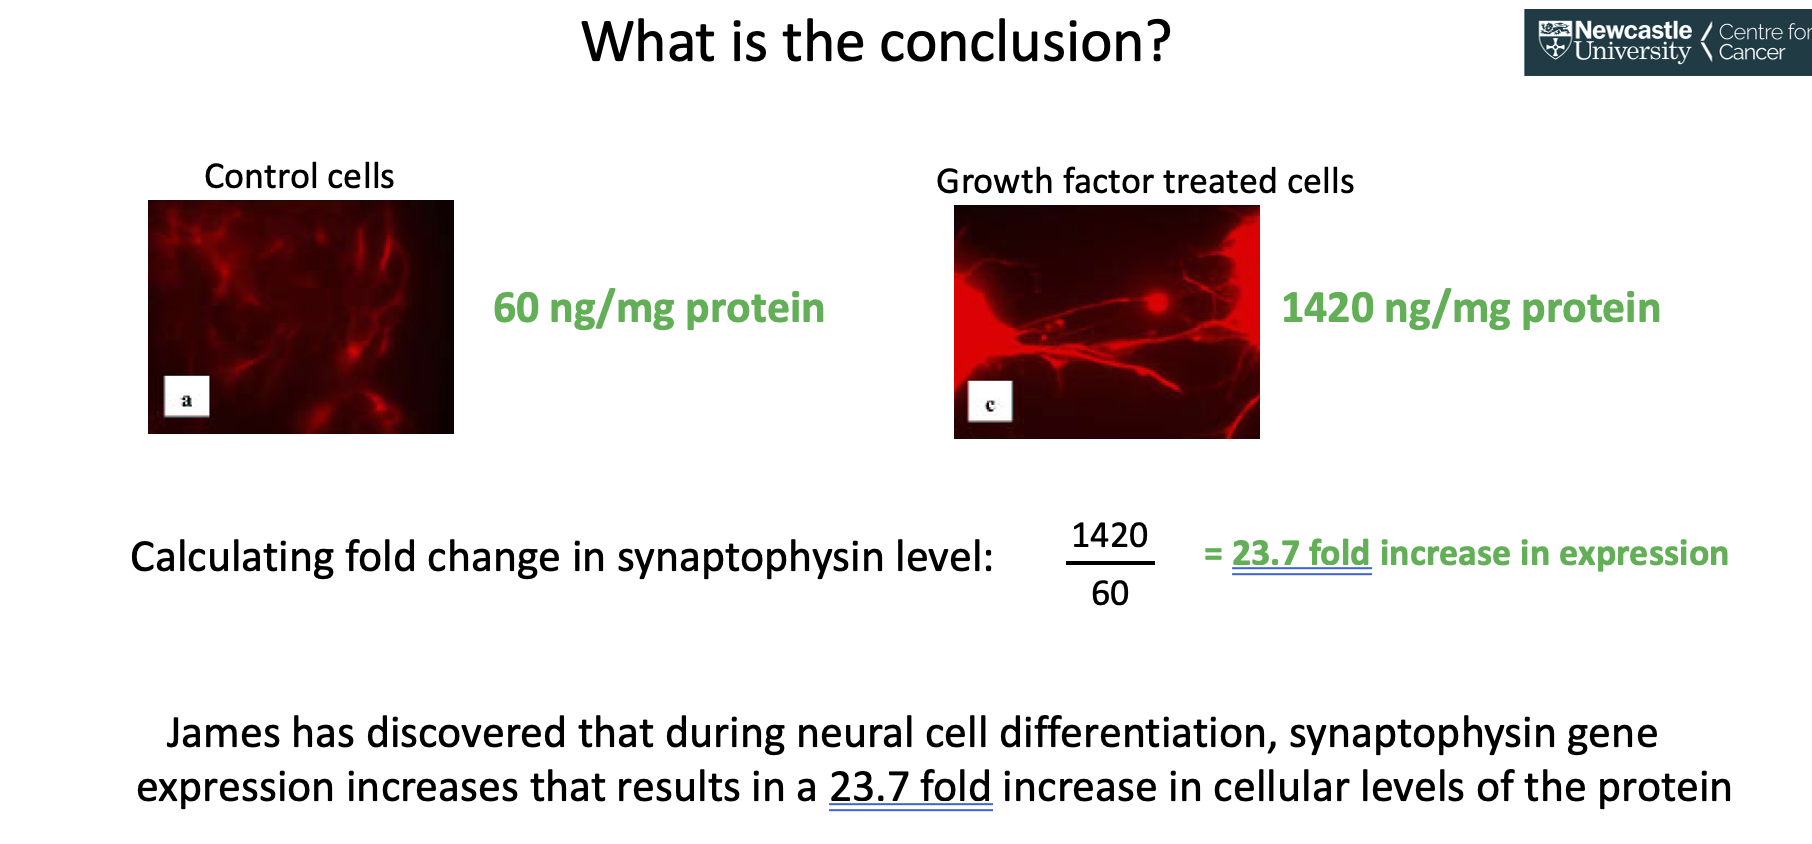
-fold increase = 1420/60= 23.7 fold increase
To study what is synaptophysin actually doing you can use siRNA
siRNA to Assess Synaptophysin Activity
siRNAs are short double-stranded RNA molecules (~21 base-pairs).
design siRNA to be complemetary to the mRNA sequence of target gene
transfect siRNA into cell
Inside the cell, the siRNA is incorporated into a complex called RISC (RNA-induced silencing complex), which uses the antisense strand of the siRNA to bind specifically to the complementary mRNA of the target gene.
Once bound, RISC cleaves the target mRNA, preventing it from being translated into protein. This leads to a reduction in the protein's levels
By silencing the gene and reducing protein levels, you can:
Observe phenotypic changes (e.g. cell death, growth inhibition, signaling defects).
Measure downstream effects using assays like qPCR, Western blot, or flow cytometry.
Compare to non-targeting siRNA controls to ensure specificity.
-use scrambled siRNA control, western blot to confirm the reduction in protein
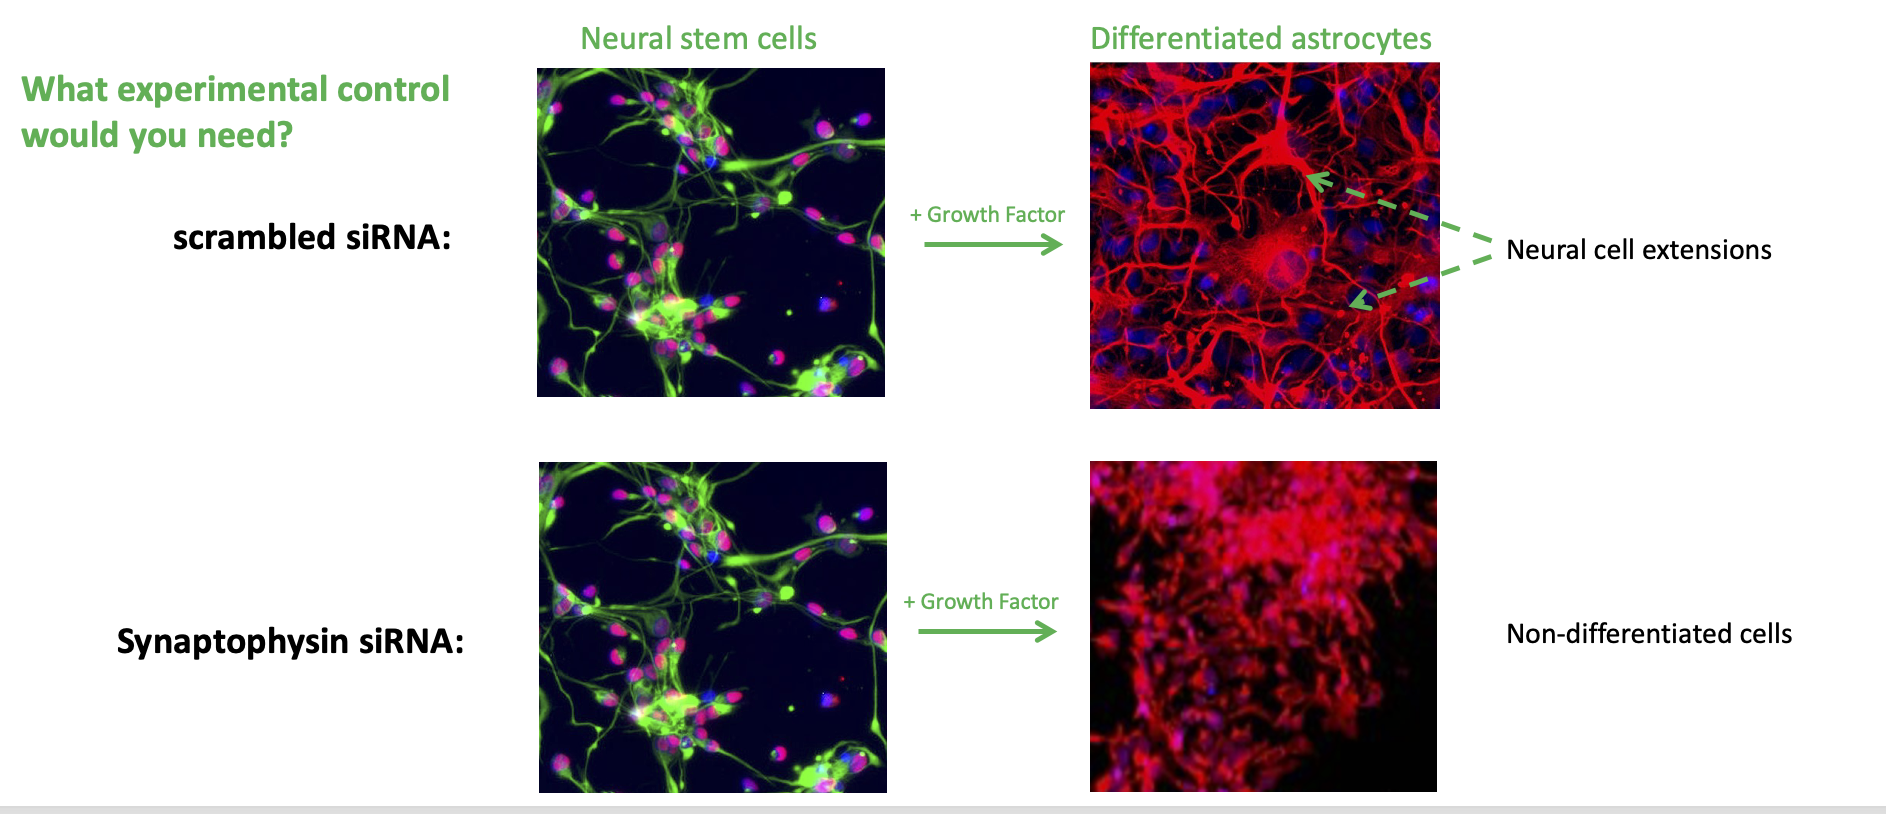
-observed that the cells don’t differentiate in absence of synpatophysin, this can be observed using immunoflouresence