Hypothesis Testing for One Mean and Two Means
Conditions for One Mean Hypothesis Testing 📊
Random Sampling or Assignment: Random sampling must occur, or random assignment is required if it’s an experiment.
Sample Size Relative to Population: The sample size should be less than 10% of the population (not applicable in experiments).
Approximate Normality:
The population should be stated to be approximately normal.
The sample size should be at least 30 (Central Limit Theorem applies).
Graph the data (histogram, boxplot, dotplot) to check for symmetry and outliers.
t-Distribution and Degrees of Freedom 📉
t-Distribution: Used when the population standard deviation is unknown, resembling a z-distribution but adjusted for sample size.
Degrees of Freedom (df):
Calculated as df = n - 1, where n is the sample size.
Indicates the number of values that can vary.
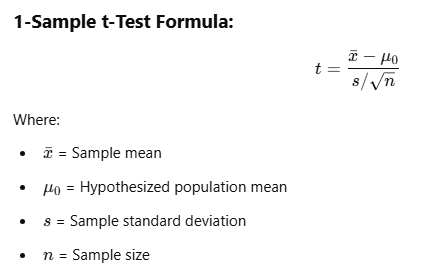
Hypothesis Testing for One Mean 🔍
1-Sample t-Test:
Null Hypothesis (H₀): μ = μ₀
Test Statistic:
Example: Fuel Economy 🚗
Context: Fuel economy goal of 30.2 mpg.
Sample Info: 50 trips sampled, mean mpg = 32.12, standard deviation = 4.83.
Hypotheses:
Null: ( μ = 30.2 )
Alternative: ( μ > 30.2 )
Conditions: Satisfied due to random sampling, sample size < 10% of total, and size > 30.
Test Results: p-value = 0.004 < 0.025, reject null = strong evidence the goal was met.
Follow-Up Questions ❓
Percent Confidence Interval: Corresponds to test level.
Type II Error Consequence: Company may over-invest assuming they haven’t met their goal when they actually did.
Confidence Intervals for One Mean 📈
Formulation:
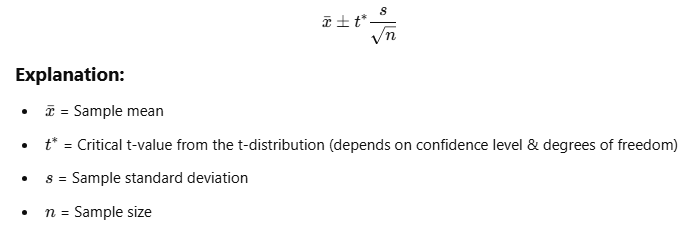
Finding Critical Value: Critical t* varies with sample size and degrees of freedom.
Example: For coffee dispensed, mean = 9.91 ounces, using data to construct a confidence interval for the population mean dispensed.
Matched Pairs vs Two-Sample Tests ⚖
Matched Pairs: Single sample with paired observations (e.g., same individuals measured at two times).
Two-sample Tests: Independent samples with no inherent pairing.
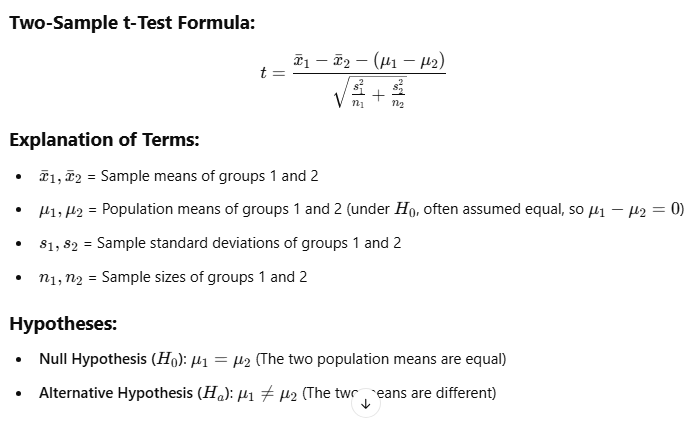
Inference for Two Means 🔗
Conditions: Random sampling or assignment, each sample < 10% of the population, and approximate normality.
Hypothesis Test for Two Means:
H₀: μ₁ = μ₂
Test statistic:
Example: ACL Surgery Recovery Times 🏥
Summary: New procedure claims to reduce recovery time.
Hypotheses:
H₀: μnew ≥ μstandard
H₁: μnew < μstandard
Test Results: Very small p-value suggests the new procedure significantly reduces recovery time.
Conclusion and Confidence Intervals for Two Means 📐
CI Equation:
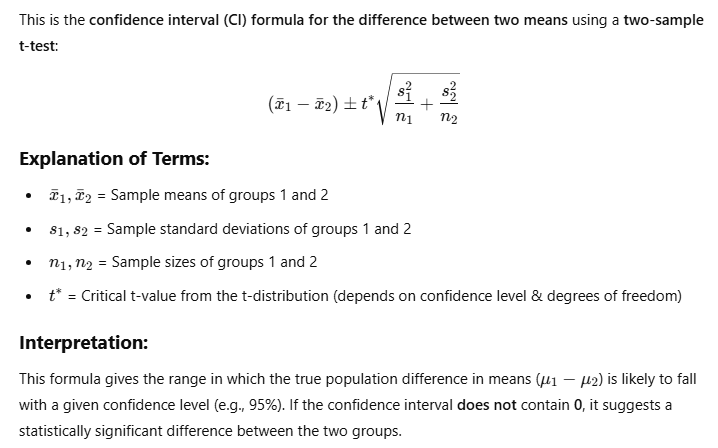
Interpretation: If CI contains 0, fail to reject the null hypothesis; if not, reject.
Notes on Techniques and Practices 💻
Using Technology: Utilize software for complex calculations and outputs, ensuring to interpret results correctly based on context.
Type I and II Errors: Understand implications of errors based on chosen significance levels and test statistics.
When deciding whether to use a one-sample t-test, two-sample t-test, or matched pairs test, consider the following guidelines:
One-Sample t-Test:
Used when you are testing the mean of a single sample against a known value (the population mean).
Example: Testing if the mean height of students in a class is equal to the national average (e.g., H₀: μ = 5.7 ft).
Two-Sample t-Test:
Used when comparing the means of two independent groups.
Example: Testing if the average test scores of students from two different schools are the same (e.g., H₀: μ₁ = μ₂).
Matched Pairs Test (Paired t-Test):
Typically used when you have two related samples or measurements.
The same subjects are measured twice, or pairs of subjects are matched based on certain characteristics.
Example: Testing the impact of a training program by comparing performance scores before and after the program on the same subjects (e.g., H₀: μdiff = 0 where μdiff is the mean difference of the paired samples).
By identifying the nature of your data and the relationship between your samples, you can choose the appropriate test for hypothesis testing.
so is it called a t test or a t mean test or a mean test
The correct terminology for the statistical test is the t-Test. The t-Test is used for testing the means of one or two samples. Specifically, it includes the following variations:
One-Sample t-Test: Used to determine if the mean of a single sample differs from a known population mean.
Two-Sample t-Test: Used to compare the means of two independent groups.
Paired t-Test (Matched Pairs): Used when comparing two related or matched samples to assess whether their means are different.