Analyzing Business Financial Statements
Module Objectives
Calculate and evaluate gross profit margin
Calculate and evaluate operating expense margin
Calculate and evaluate operating profit margin and net profit margin
Calculate and evaluate the current ratio, quick ratio, and working capital
Calculate and evaluate debt to equity and debt to assets
Calculate and evaluate debt to tangible net worth and adjusted debt to adjusted tangible net worth
Calculate and evaluate return on assets and return on equity
Calculate and evaluate sales to assets and sales to net fixed assets
Calculate and asses the strength of EBITDA to total debt service
Module Summary
When performing a financial risk assessment, lenders often focus on four areas
Profitability
Liquidity
Leverage + Capital Structure
Efficiency and Productivity
When you are assessing a business’s profitability, you will want to know its profit margins, gross profit margin, and then subtracting its expenses to arrive at operating profit margin, pretax profit margin, and net profit margin
You can expect to see higher profit margins among businesses that add significant value to raw materials during their asset conversion cycle, having a long asset conversion cycle, or assume high risks in production
Key liquidity measures the current ratio, the quick ratio, and working capital
The Decision Strategy

Analyzing Profitability
Evaluating a business’s ability to repay loans includes assessing both the financial strength and profitability of the business, as well as the quality of the business owner(s) management skills
Key Factors of Financial Statement Analysis-Key Factors
Financial Condition (by looking at ratios and indicators)
Performance (Evaluate trends)
Owner/Business Financial Relationship (Compare expectations)

Measuring Profitability
As a lender, we want to evaluate whether the revenues of the business can be converted to cash and how much remains after accounting for expenses
It’s a measure of how successful management has been in executing its strategies
Want to understand how certain factors or events might change the profitability and whether we can affect future profitability to be similar or different than historical
Lastly we want to determine what caused the change
Analyzing Liquidity
You can use ratios that display the relationship between profits and sales and you can evaluate how these ratios may be changing over time
Need to look at common size financial statements to do this type of analysis
A common size financial statement is a type of financial report where all line items are expressed as a percentage of a chosen base figure, making it easier to compare companies of different sizes or track changes over time
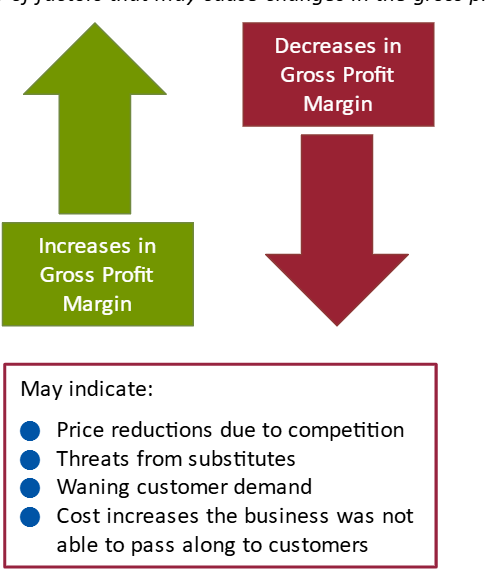
Gross Profit Margin
The higher the value a business adds to its raw materials, the greater the risks it assumes in it production processes, the higher its gross profit margin should be
The actual gross profit margin depends on management’s effectiveness in controlling costs and promoting sales

Operating Expenses and Profit Interpreting Capital Structure
To interpret capital structure, you must look at
Asset quality
Asset distribution
Liquidity
Profitability
Leverage
Campisi Brother’s Capital Structure
The trend is positive
Total liabilities have decreased as a percentage of total assets
Business is supporting its assets with a higher proportion of equity
Campisi has been repaying its long-term debt
Net profit margins declined, but there is a strong equity cushion in case profit margins continue to be low
Measuring Efficiency
How quickly the business is able to convert its assets into sales, and sales to cash
Efficiency related to the operating cycle and the capital investment cycle
How much profit the business is able to generate from its assets
The measure of profits compared with debt and other obligations
In general, asset efficiency is measured by the relationship between sales and assets
If there is a constant level of sales, a decrease in inventory, accounts receivable, or net fixed assets means greater operating efficiency and a higher ratio of sales to assets
Measuring Efficiency
Sales to Assets
Inventory Turnover
Accounts Receivable Turnover
Sales to Net Fixed Assets
Asset Turnover
If sales are constant and inventory or accounts receivable levels are decreasing from year to year, efficiency is increasing
A decrease in inventory days on hand means inventory is being sold more quickly
A decrease in accounts receivable days on had means receivables are being collected faster
Campisi Brothers Efficiency and Productivity
The overall trend is positive
The ratios of sales to assets and sales to net fixed asset shave increased in Year 3
The company needs to do some work to collect receivables more quickly
Return on Assets
ROA is a key ratio of operating efficiency and productivity and is a percentage
To interpret ROA look at sales to assets ratio and profit as a percentage of sales

Return on Equity
Owners and investor have different views on leverage than lenders. Owners typically want the largest possible rate of return on their investment int eh business
A high or rising return on equity is usually a good sign for owners but isn’t always a good sign for lenders
It’s important to understand the underlying factors

A high ROE can occur even when there is an increase in leverage or when profitability is stagnant or falling
EBITDA
Earnings Before Interest Taxes Depreciation and Amortization (EBITDA)
EBITDA is a calculation of potential cash flow based on profitability
EBITDA represents the amount of profit generated by the business:
To pay interest, taxes, and current maturities of long-term debt
To fund other expenditures such as an investments in additional current or fixed assets or payments of dividends
Sales to Assets
Inventory Turnover
Accounts recievable turnover
Sales to net fixed assets
Analyzing Efficiency and Productive