Advanced Data Analytics (1)
Advanced Data Analytics
Overview
The course covers advanced data analytics, emphasizing methods, tools, and applications for data processing, visualization, and decision-making.
The content includes various modules covering statistics, SQL, machine learning, visualizations, and data governance.
About Us
The World's Largest Provider of Classroom and Online Training Courses.
Subject Matter Experts provide the highest quality training material using accelerated learning techniques.
Covers areas including Project, Programme, and Change Management, ITIL® Consultancy, PRINCE2®, MSP®, ITIL®, Soft Skills, and more.
Course Objectives
Apply advanced statistics including hypothesis testing, multivariate analysis, and dimensionality reduction.
Optimize data processing and SQL operations, execute complex queries, and enhance database performance.
Develop predictive models for data-driven insights.
Create interactive data visualizations using tools like Tableau and Power BI.
Enhance decision-making based on data through techniques like A/B testing and forecasting.
Course Syllabus
Modules
**Advanced Data Analytics Foundations
— Data analytics has evolved significantly from simple record-keeping to complex predictive modelling.
➢ In early history, businesses relied on manual data logs and spreadsheets to track sales and performance.
➢ With the advent of databases in the 1960s, structured storage systems allowed for better organisation of data.
➢ The 1990s saw the rise of data warehouses, enabling businesses to store vast amounts of structured data for
better decision-making.
➢ Today, analytics has moved towards AI-driven insights, allowing companies to leverage automation and predictive
analytics for more efficient and accurate decision-making.
Evolution of Data Analytics – The Digital Transformation
➢ With digital transformation, data analytics has shifted from traditional on-premise solutions to cloud-based
systems.
➢ The introduction of big data technologies such as Hadoop and Spark has revolutionised how companies handle
large datasets.
➢ Real-time analytics is now possible, enabling businesses to make instant data-driven decisions.
➢ Organisations are moving towards self-service analytics, where employees can access and analyse data without
relying solely on IT teams.
➢ Additionally, automation and AI-powered analytics tools are streamlining data processing, allowing businesses to
gain deeper insights with minimal manual effort.
Key Trends in Data Analytics – Automation & AI

Key Trends in Data Analytics – Real-Time Decision Making
➢ Real-time analytics is becoming essential in industries that require immediate decision-making, such as finance,
healthcare, and e-commerce.
➢ With advancements in streaming data processing technologies, businesses can monitor transactions, detect fraud,
and optimise inventory in real time.
➢ Companies are also leveraging real-time customer insights to personalise user experiences.
➢ The adoption of edge computing further enhances this trend, allowing data to be processed closer to its source,
reducing latency and improving efficiency.
➢ These advancements make real-time analytics a crucial aspect of modern business intelligence strategies.
Key Trends in Data Analytics – Data Privacy & Ethics

Data Science vs. Data Analytics – Understanding the Difference
➢ Data science and data analytics are often used interchangeably, but they serve different purposes.
• Data analytics focuses on interpreting historical data to identify trends and patterns, aiding in decision-
making.
• In contrast, data science involves using advanced statistical models, AI, and machine learning to predict future
outcomes.
• Data analysts typically work with structured datasets, using SQL and BI tools, while data scientists build
predictive models, often using Python and R.
➢ Both fields are essential in leveraging data for business value, but data science is more focused on predictive and
prescriptive analytics.
Business Intelligence vs. Data Analytics
➢ Business intelligence (BI) and data analytics have overlapping functionalities but distinct objectives.
➢ BI focuses on reporting historical data using dashboards and visualisation tools like Tableau and Power BI.
• It provides descriptive analytics to help businesses understand past performance.
➢ Data analytics, however, extends beyond BI by incorporating diagnostic, predictive, and prescriptive analytics.
• It applies statistical methods and machine learning to extract deeper insights.
➢ While BI is primarily used for operational reporting, data analytics is more exploratory and strategic, helping
businesses make data-driven decisions.
The Role of Data Analytics in Decision-Making

Types of Decision-Making Frameworks
➢ Several frameworks guide data-driven decision-making in businesses.
• The OODA loop (Observe, Orient, Decide, Act) is widely used in
dynamic industries requiring quick responses.
• The PDCA cycle (Plan, Do, Check, Act) is essential for continuous
improvement and problem-solving.
• Data-driven organisations also use the CRISP-DM framework
(Cross-Industry Standard Process for Data Mining) for structured
analytics projects.
➢ These frameworks provide structured methodologies to ensure data-
driven insights lead to meaningful business outcomes.
Introduction to Data Pipelines
➢ A data pipeline is a series of processes that collect, transform,
and deliver data for analysis.
➢ It automates data flow from various sources, such as
databases, APIs, and real-time streams, into data warehouses
or analytics platforms.
➢ Pipelines are essential in ensuring data is clean, organised, and
ready for analysis.
➢ They typically involve ETL (Extract, Transform, Load) or ELT
(Extract, Load, Transform) processes, where raw data is
structured and prepared for business intelligence applications.
Components of a Data Pipeline
➢ A data pipeline consists of multiple components,
including data ingestion, processing, and storage.
➢ Ingestion collects data from different sources, such as
IoT devices, databases, and APIs.
➢ Processing involves cleaning, filtering, and
transforming data using tools like SQL and Python.
➢ Storage solutions, such as data lakes and
warehouses, ensure efficient access and retrieval.
➢ Pipelines also include monitoring and automation to
maintain data consistency and integrity, making them
essential for scalable analytics solutions.

ETL vs. ELT – Data Transformation Strategies
➢ ETL (Extract, Transform, Load) and ELT (Extract, Load, Transform) are two approaches to data processing.
• ETL transforms data before loading it into a storage system, ensuring structured and clean data entry.
• ELT, on the other hand, loads raw data first and transforms it later using cloud-based processing power.
• ETL is suitable for traditional data warehouses, while ELT is commonly used in big data and cloud
analytics environments.
➢ Both approaches enable efficient data integration for analysis.
Importance of Data Governance in Analytics
➢ Data governance ensures data quality, security, and compliance in analytics.
➢ Organisations must establish policies for data access, accuracy, and ethical usage.
➢ Data lineage tracking helps maintain transparency on how data is processed and transformed.
➢ Governance frameworks align analytics practices with legal requirements, reducing risks associated with data
breaches and misinterpretations.
➢ A well-structured governance strategy enhances trust in analytics insights and enables reliable decision-
making.
Challenges in Managing Data Pipelines
➢ Managing data pipelines comes with challenges such as data inconsistency, latency, and security risks.
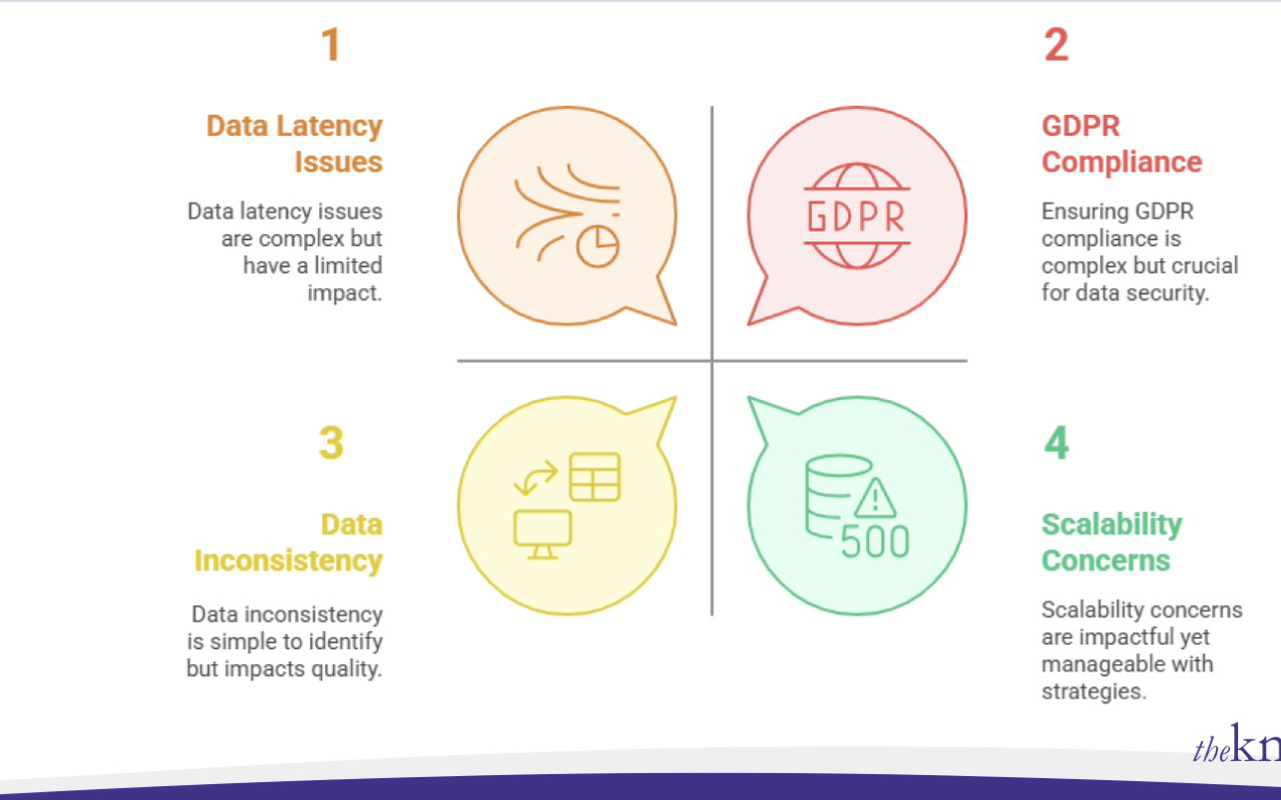
Scalability in Data Analytics Systems
➢ As data volumes grow, ensuring scalable data analytics systems becomes crucial.
➢ Traditional databases struggle with large-scale processing, leading to the adoption of distributed computing
frameworks like Apache Spark and Presto.
➢ Scalability challenges include data storage, processing speed, and system performance.
➢ Horizontal scaling, where additional servers are added, is a common solution.
➢ Optimising SQL queries, indexing, and caching techniques also enhance system efficiency.
➢ Scalable architectures allow organisations to handle increasing data loads without compromising speed or
accuracy, ensuring smooth analytical workflows.
The Role of Automation in Data Analytics
➢ Automation is transforming data analytics by reducing manual effort and enhancing efficiency.

Future of Data Analytics – Emerging Technologies
➢ The future of data analytics includes AI-driven automation, real-
time processing, and enhanced data visualisation.
➢ Technologies like generative AI, augmented analytics, and
quantum computing are expected to transform analytics
capabilities.
➢ Automated data storytelling will enable faster insights, reducing
dependency on manual reporting.
➢ The growing role of AI in self-service analytics will empower users
across different departments to interact with data intuitively.
Let’s Recall
Which of the following best differentiates Data Analytics from Data
Science?
A) Data Science focuses on historical data, while Data Analytics predicts future
B) C) D) trends.
Data Analytics is mainly about data visualisation, while Data Science includes
decision-making.
Data Science involves machine learning and predictive modelling, while Data
Analytics focuses on analysing past trends.
Data Analytics is used only for business applications, while Data Science applies
only to scientific research.
Let’s Recall
Which component of a data pipeline is responsible for collecting
data from multiple sources before transformation?
A) Data Storage
B) Data Ingestion
C) Data Processing
D) Data Visualisation
Let’s Recall
What is the primary advantage of real-time analytics
in business decision-making?
A) B) C) D) It eliminates the need for historical data analysis.
It allows immediate responses based on current data
trends.
It reduces the need for machine learning models.
It is only useful in financial sectors.