12-03: Curve Sketching
Maxima & Minima
- ==Local Maximum==: if the y coordinate of all points are less than the y
- For a ==local== interval, it is the highest point, but it ==isn’t the highest point for the whole graph==
- ==Local minimum==: if the y coordinate for all points in the vicinity are greater than the y coordinate of the point
- For a ==local== interval, it is the lowest point, but it ==isn’t the lowest point for the whole graph==
- ==Local extrema==: local maximum and minimum values of a function, also called ==turning points==
- ==Absolute maximum==: the ==highest y coordinate== on the function
- As high as the function goes overall
- Absolute minimum: the ==lowest y coordinate== on the function
- As low as the function goes overall
Critical Numbers
Critical numbers: value a in the domain of the function for which either ^^f’(a) = 0 or f’(a) = DNE^^
- Critical numbers are ^^x values^^, to find a point, substitute the x values in and solve for y
- Critical points: ^^(a, f(a))^^
First Derivative Test
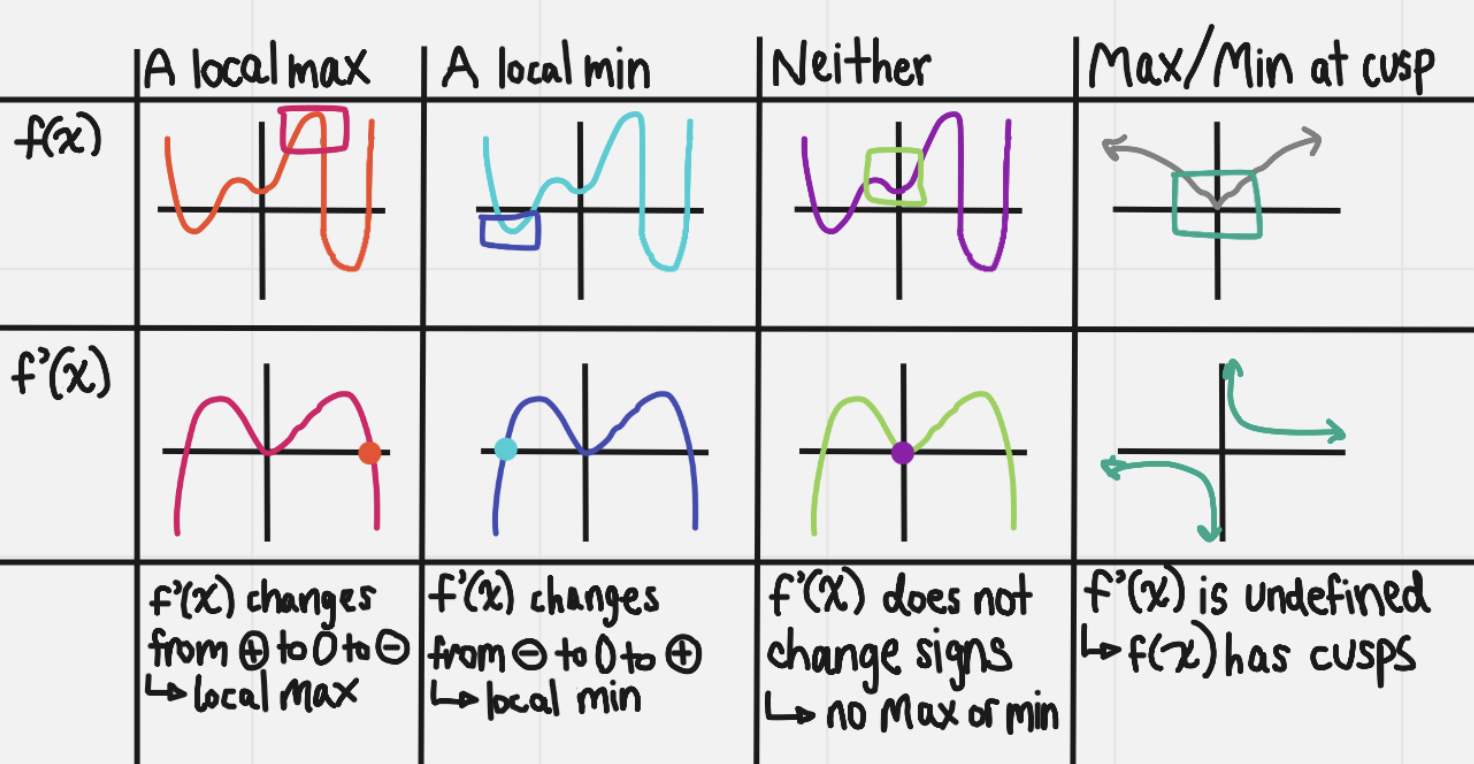
The first derivative test: %%indicates whether a critical number yields a local maximum, a local minimum, or neither%%
- If f’(x) changes from %%positive to negative%%: Local max
- If f’(x) changes from %%negative to positive%%: Local min
- If the sign of f’(x) does not change: Not a local max or min, we have a horizontal tangent
- Local extrema occur when the sign of the tangent changes
To determine critical numbers (x-values) of the critical points:
- Find an expression for f’(x)
- Solve for the roots of the derivative and find where the derivative equals 0
==Steps:==
- Find f’(x)
- Set to 0 and solve for x
- Use critical numbers as x values, sub in for y coordinate
- Use these to graph
- If there is a mention of endpoints, use these as x values and solve for a coordinate point (y value) as well
Increasing and Decreasing Functions
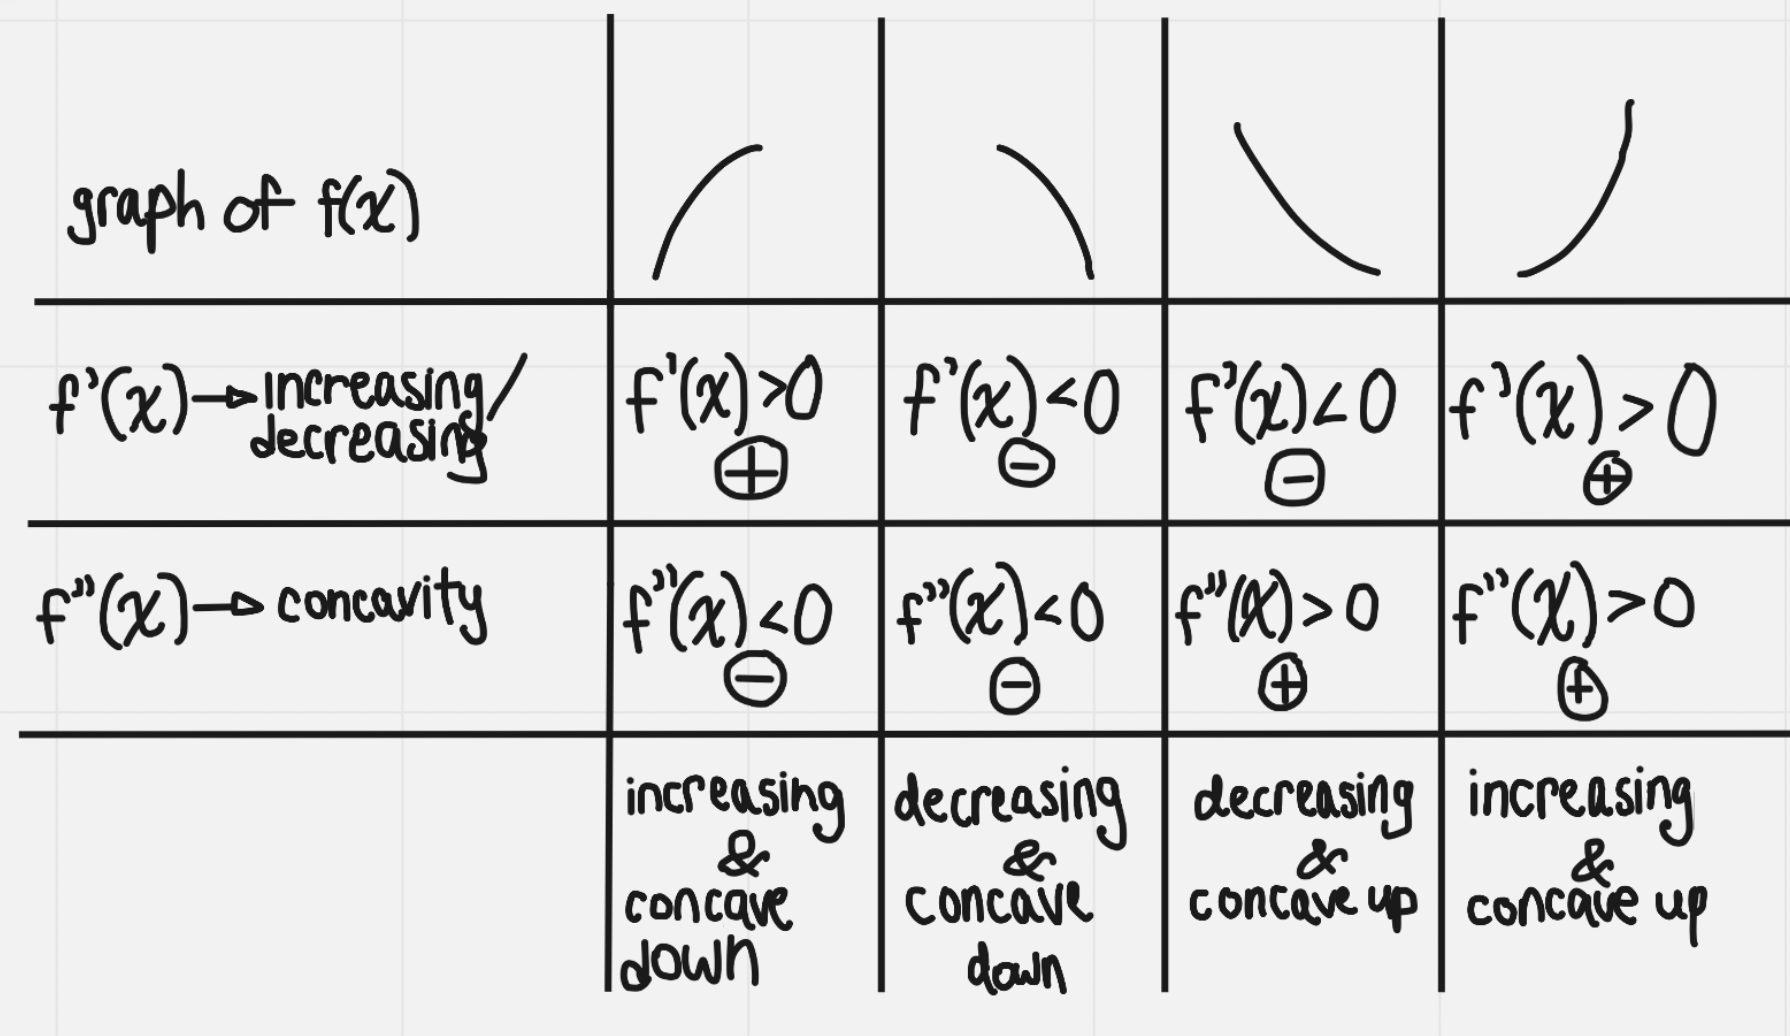
The first derivative of a continuous function, f(x), can be used to determine the intervals over which the function is increasing and decreasing
- ^^When f’(x) is greater than 0, positive and above the x axis: the function is increasing^^
- ^^When f’(x) is less than 0, negative and below the x axis: the function is decreasing^^
- Critical numbers occur when f’(x) = 0 and local extrema occur when the sign of the derivative changes
==Steps== - to solve for increasing and decreasing intervals:
- Determine the first derivative
- Solve for the roots of the derivative (factor if needed)
- Solve for where the derivative of x is greater than 0 (increasing), or where the derivative of x is less than 0 (decreasing)
- Use an interval table to do this
1. Set up (-∞, #) (#, ∞) with as many columns are needed to touch upon all x intercepts; zeros separate the columns 2. Set up all factors in the rows of the chart 3. Pick a number in the boundaries of the column headers (a number) - substitute this into the rows and record the sign overall
1. From here, multiply the signs (whether they be positive or negative) and see what you get as a final 4. The final verdict of sign (positive or negative) reflects whether the function is increasing (+) or decreasing (-) at a given time
Concavity and the Second Derivative Test
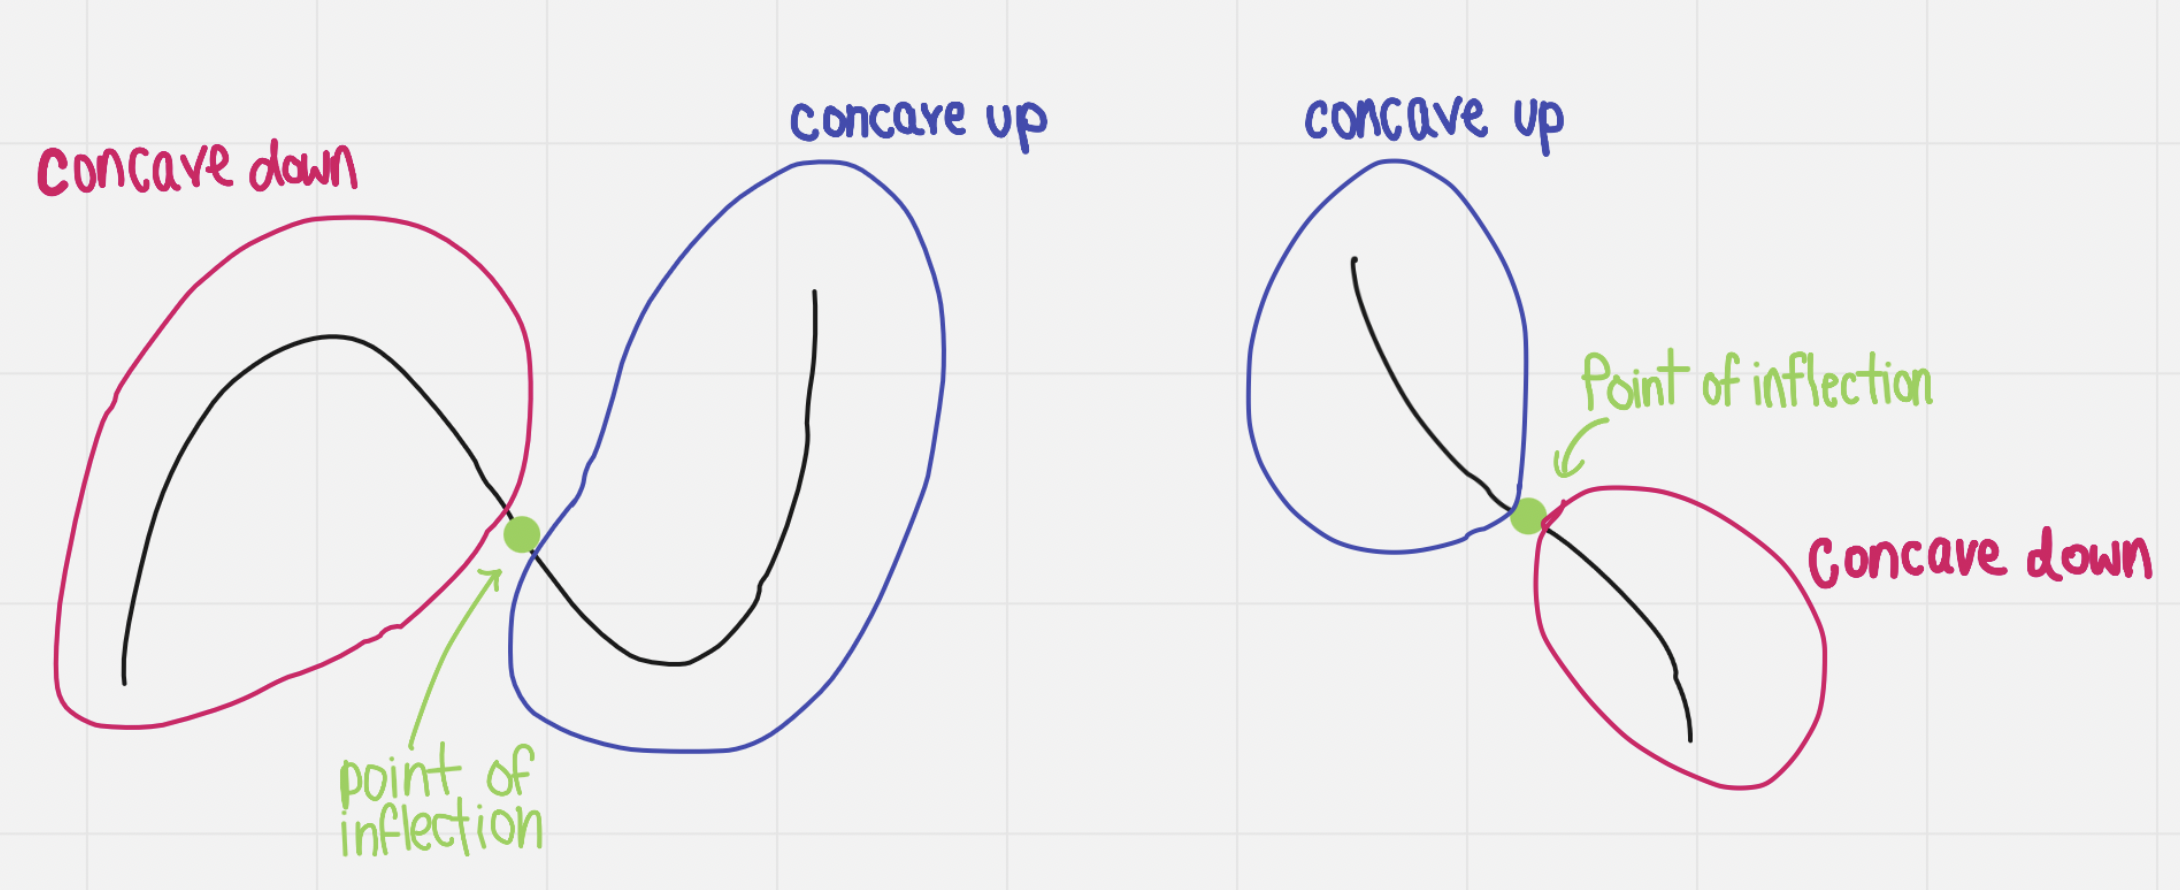
%%Concave up%%: all tangents on the interval are below the curve (slope increasing)
- Graph curves upwards (like a parabola opening up)
%%Concave down%%: all tangents on the interval are above the curve (slope decreasing)
- Graph curves downward (like a parabola opening down)
%%Point of inflection%%: the point at which the graph changes concavity
- Changes from concave up to concave down
The second derivative, f”(x), of a function can be used to determine its concavity
- If f”(x) is ^^greater than 0: Concave up^^
- If f”(x) is ^^less than 0: Concave down^^
- If ^^f”(x) = 0: Possible point of inflection (f”(x) must change signs over the zero)^^
The Second Derivative Test
Evaluate f”(x) at the critical numbers (where f’(x) = 0)
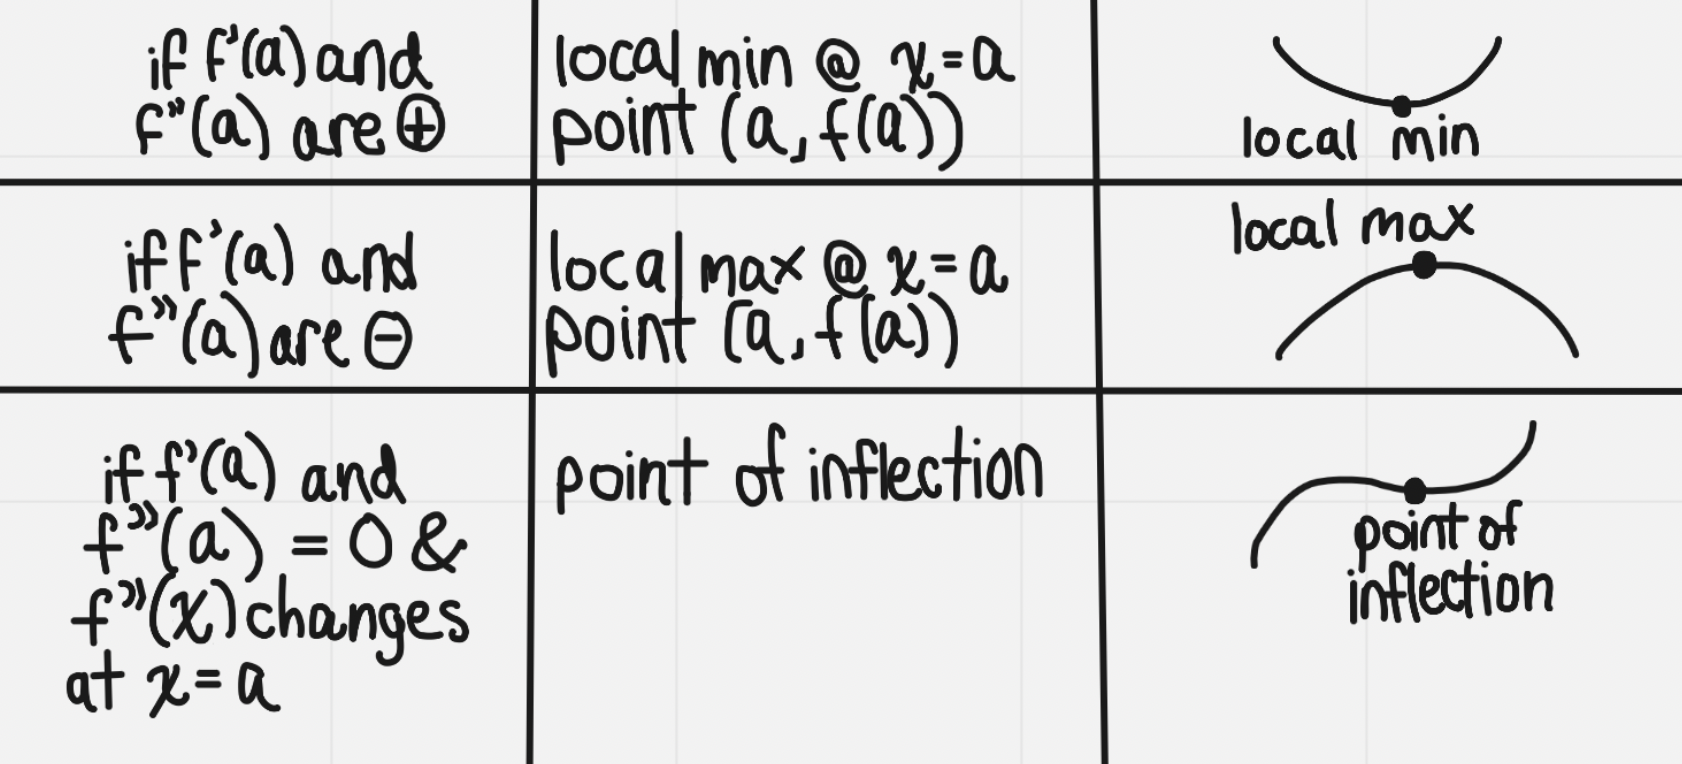
- First derivative test finds critical points and whether they’re local max/min/neither. Second derivative test helps classify critical points but also can identify points of inflection
Steps to solve second derivative test questions:
- Find first derivative
- Find second derivative
- Interval table
- Sub x values in for y values to get points for the points of inflection
Simple Rational Functions
Rational function: %%a function in the form y=(f(x))/(g(x))%%
- Restriction on the denominator where ^^g(x) ≠ 0^^ because then it would be undefined
Summary of properties & characteristics:
Asymptotes
- %%Vertical asymptote%%, VA: zeros of the denominator, solve the denominator
- %%Horizontal asymptote,%% HA:
- \
- If the degree of the numerator is less than the degree of the denominator → y=0
- \
- if the degree of the numerator is equal to the degree of the denominator → y = LC/LC
- Oblique asymptote, OA: when the degree of the numerator is greater than the degree of the denominator
- OA y = the quotient of the numerator and denominator
Intercepts
- %%x int%%: sub y=0, zeros of the numerator (solve the numerator)
- %%y int%%: sub x = 0
Holes
- Hole (open point): if a factor cancels out
◊ Rational functions can change from increasing to decreasing (or vice versa) across a VA, the concavity can also change as well. CA must be considered and included in intervals of increase/decrease or concavity on account of this.
Putting It All Together
Steps to sketching the graphs of polynomial and rational functions
- Determine the domain of the function
- Is it a rational function, are there asymptotes, limit behaviour
- VA: lim x→VA- ; lim x→VA+
- HA: lim x→±∞
- Determine intercepts of the function
- x int: sub y=0
- y int: sub x=0
- Determine and classify the critical numbers of the function
- Solve for where f’(x) = 0 or where f’(x)=DNE
- Determine possible points of inflection
- Solve for where f”(x) = 0
- Set up intervals of increase/decrease and intervals of concavity & the points of inflection
- Set up interval tables
- Identify local extrema and points of inflection
- Look for where f’(x) and f”(x) change signs
- Sketch the function