Demand
In the last lesson, we talked about supply, or the ability and willingness of producers to make goods and services. Now we're going to look at the other half of the price system: consumer demand. Demand is the ability and willingness to buy specific quantities of a good or service at different prices in a specific time period, all things remaining the same. In other words, it's the amount of a product that consumers are willing and able to buy at certain prices. If you could buy a large pizza from Domino's for just one dollar, how many would you buy over the course of a year? Your demand for Domino's pizza would likely be incredibly high. But what if they cost fifty dollars? Even if you love pizza, you probably wouldn't buy any at that price—your demand for Domino's pizza would be zero.

Law of Demand
Our Domino's example illustrates the law of demand—people will buy more of a good or service at lower prices and less at higher prices, all things remaining the same. When the price of a Domino's pizza was one dollar, we had a lot of demand for pizzas. But when it went up to fifty dollars, our demand fell to zero.
The quantity of a product that consumers are willing and able to buy at a particular price, all other things remaining the same, is called quantity demanded. When that particular price changes, the quantity demanded changes—this is called change in quantity demanded. Change in quantity demanded only reflects changes in the price of the good or service, not changes in other variables that may affect demand, such as a rise or fall in consumers' income.
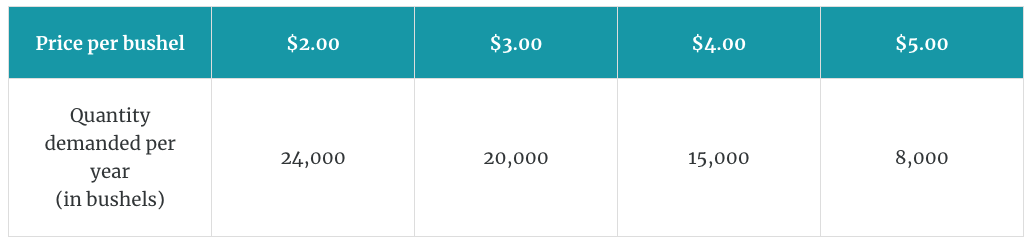
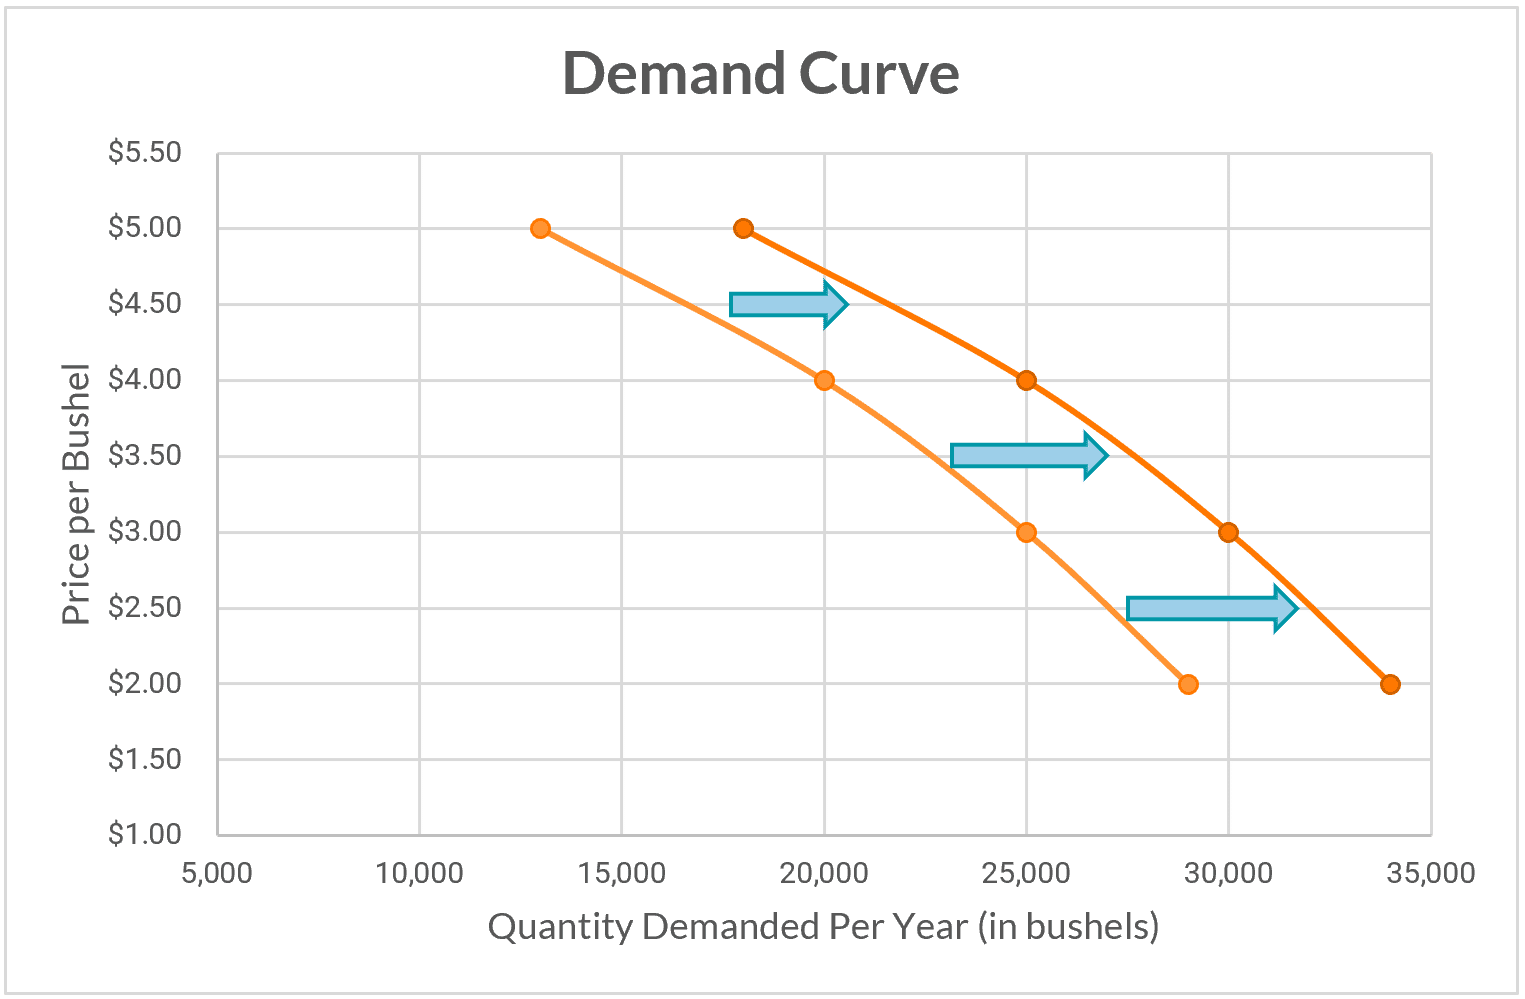
Let's return to Stalkland and see how much corn its citizens want by creating a demand schedule—a table that shows the quantity demanded at different prices, all things remaining the same. The demand schedule below shows us how many bushels of corn the entire nation of Stalkland would be willing and able to buy at particular prices.

Just as with a supply schedule, we can look at a demand schedule in graphical form, called a demand curve.
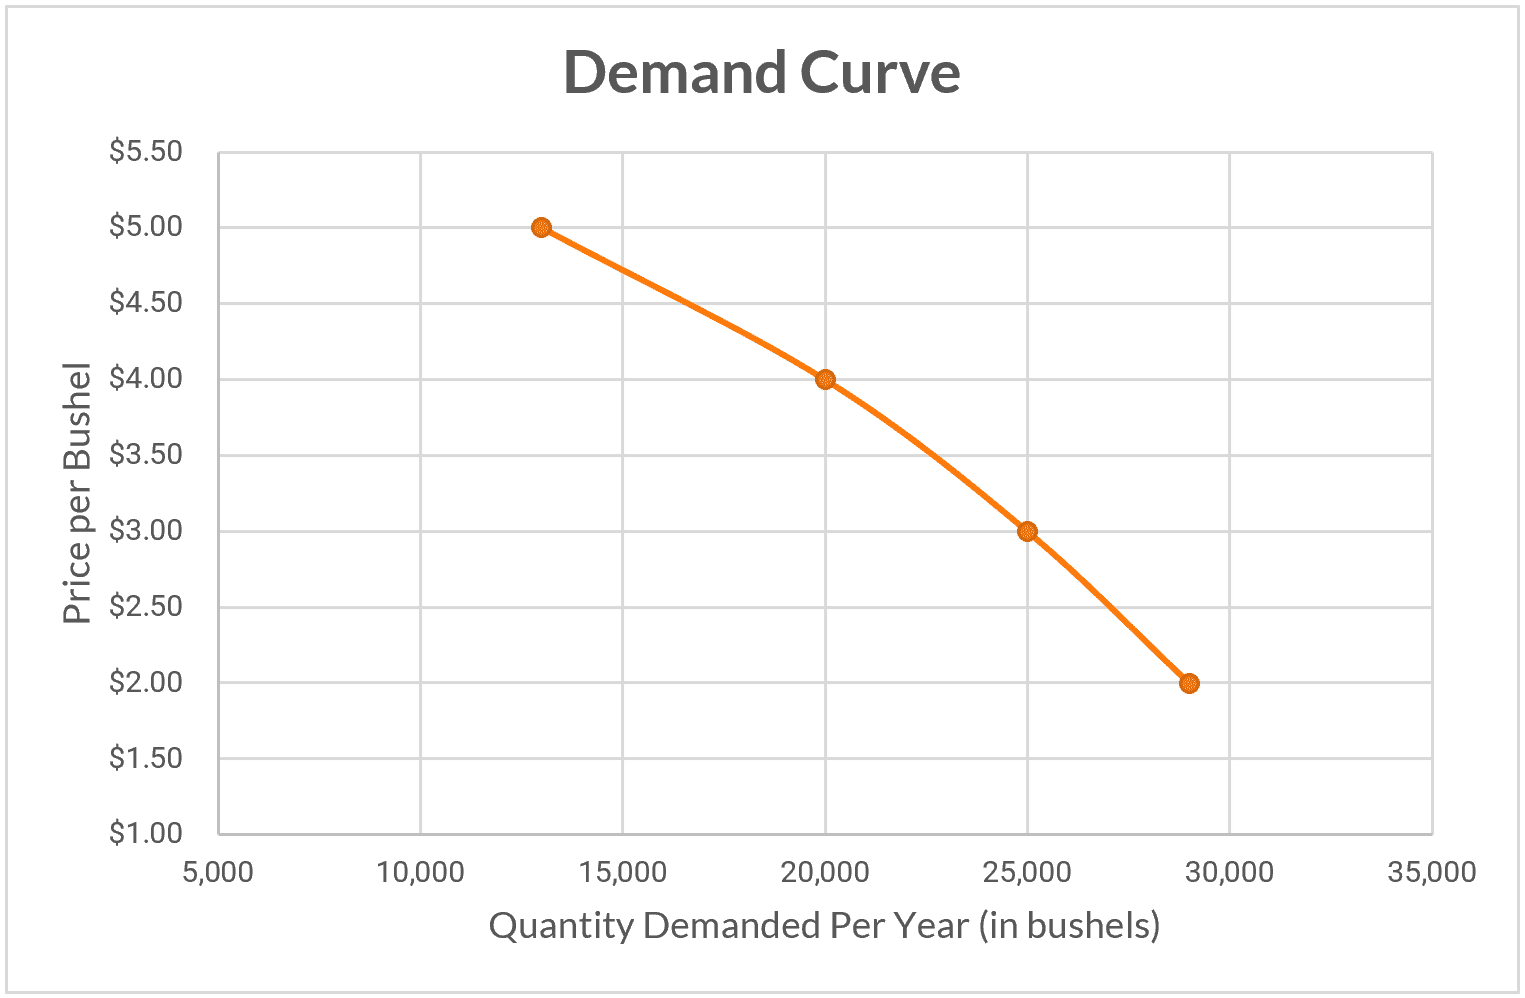
In contrast to supply curves, which slope upward, demand curves slope downward. This is because price has the opposite effect on demand as it does on supply. When price increases, supply increases, but demand decreases. And when price goes down, supply goes down, but demand goes up.
Change in Demand

A shift in the demand curve is called a change in demand. Remember that change in quantity demanded only reflects changes in the price of the good or service, not changes to other variables that are determinants of demand. When these variables change, it creates a positive or negative change in demand and shifts the demand curve right or left. The following changes create changes in demand:
bullet
A change in consumers' incomes. In general, demand increases as income increases, and it falls when income falls. When people are making lots of money, they are more likely to buy new cars and expensive food. This results in a higher demand for those goods. When income levels fall, fewer people will be able to afford new cars and expensive food—demand will be lower. Goods and services that follow this pattern are known as normal goods.
However, demand for some goods increases when income falls, and vice versa. These goods are known as inferior goods and include products like Spam or bus tickets. That's because these products are cheaper alternatives to buying deli-sliced turkey or owning a car. When incomes rise, people will switch back to the more expensive items, and demand for inferior goods will decrease.bullet
A change in consumer preferences. Consumer preferences can change for a variety of reasons. For instance, one reason demand for oil has gone down is that consumers prefer cleaner sources of energy. An opposite example is gluten-free products, which have seen an enormous increase in demand over the last couple of decades. Many grocery stores now have entire sections of gluten-free foods because many consumers believe they're healthier, preferring them over wheat-based products. Their food preferences have changed.
bullet
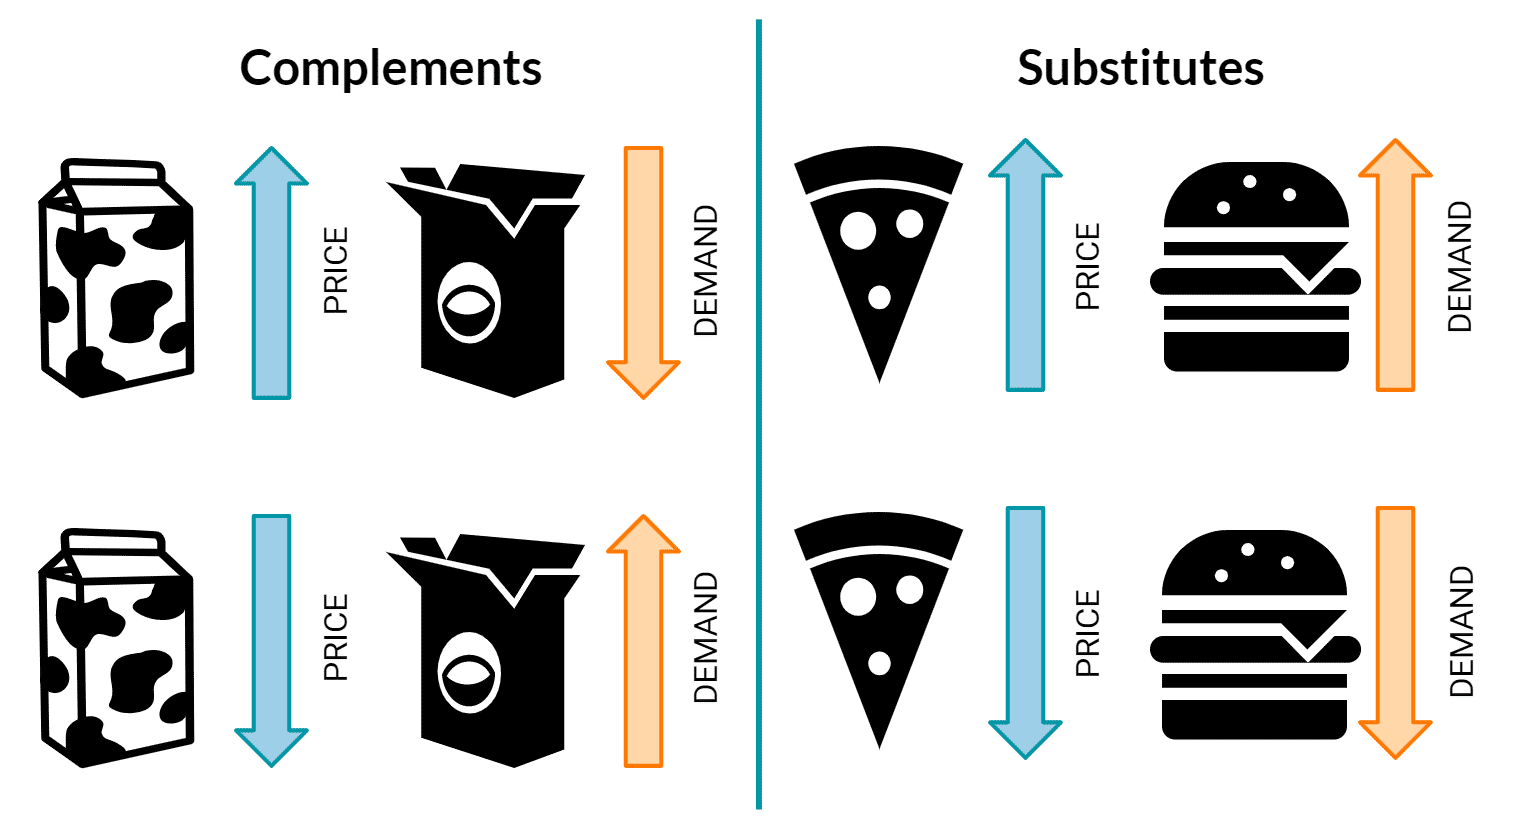
A change in the price of related goods or services. The price of related products can affect demand in two different ways, depending on whether the related product is a complement or a substitute. If a decrease in the price of one good increases demand for another, then the two goods are complements. Milk and cereal are two goods that are complements of each other. If the price of milk goes down, then demand for cereal will increase. If the price of milk goes up, however, people will have less demand for cereal since the two goods often go together. They don't want to pay the higher price for milk, so they won't get cereal either.
Conversely, if a decrease in the price of one good decreases demand for another, then the two goods are substitutes. Pizza and burgers are two goods that are substitutes for each other. If the price of pizza goes down, then demand for burgers will decrease. This happens because people can only eat so much fast food. If they're buying more pizzas due to the reduction in price, then they're going to buy fewer burgers. If the price of pizza increases, however, then demand for burgers will increase. If we suddenly had to pay $50 for a pizza, but burgers still only cost $2, there's going to be a lot more demand for burgers.
bullet
A change in the number of consumers in a market. This one is pretty intuitive. The more consumers there are, the greater demand there will be; with fewer consumers, there will be less demand.
bullet
A change in buyer expectations. Consumers rush to the grocery store if there's an incoming hurricane because they expect that they won't be able to get food for a while after the storm hits. Demand for goods like bottled water and bread goes through the roof. Conversely, demand for frozen and refrigerated foods will fall, as people expect their power may go out and spoil those goods.
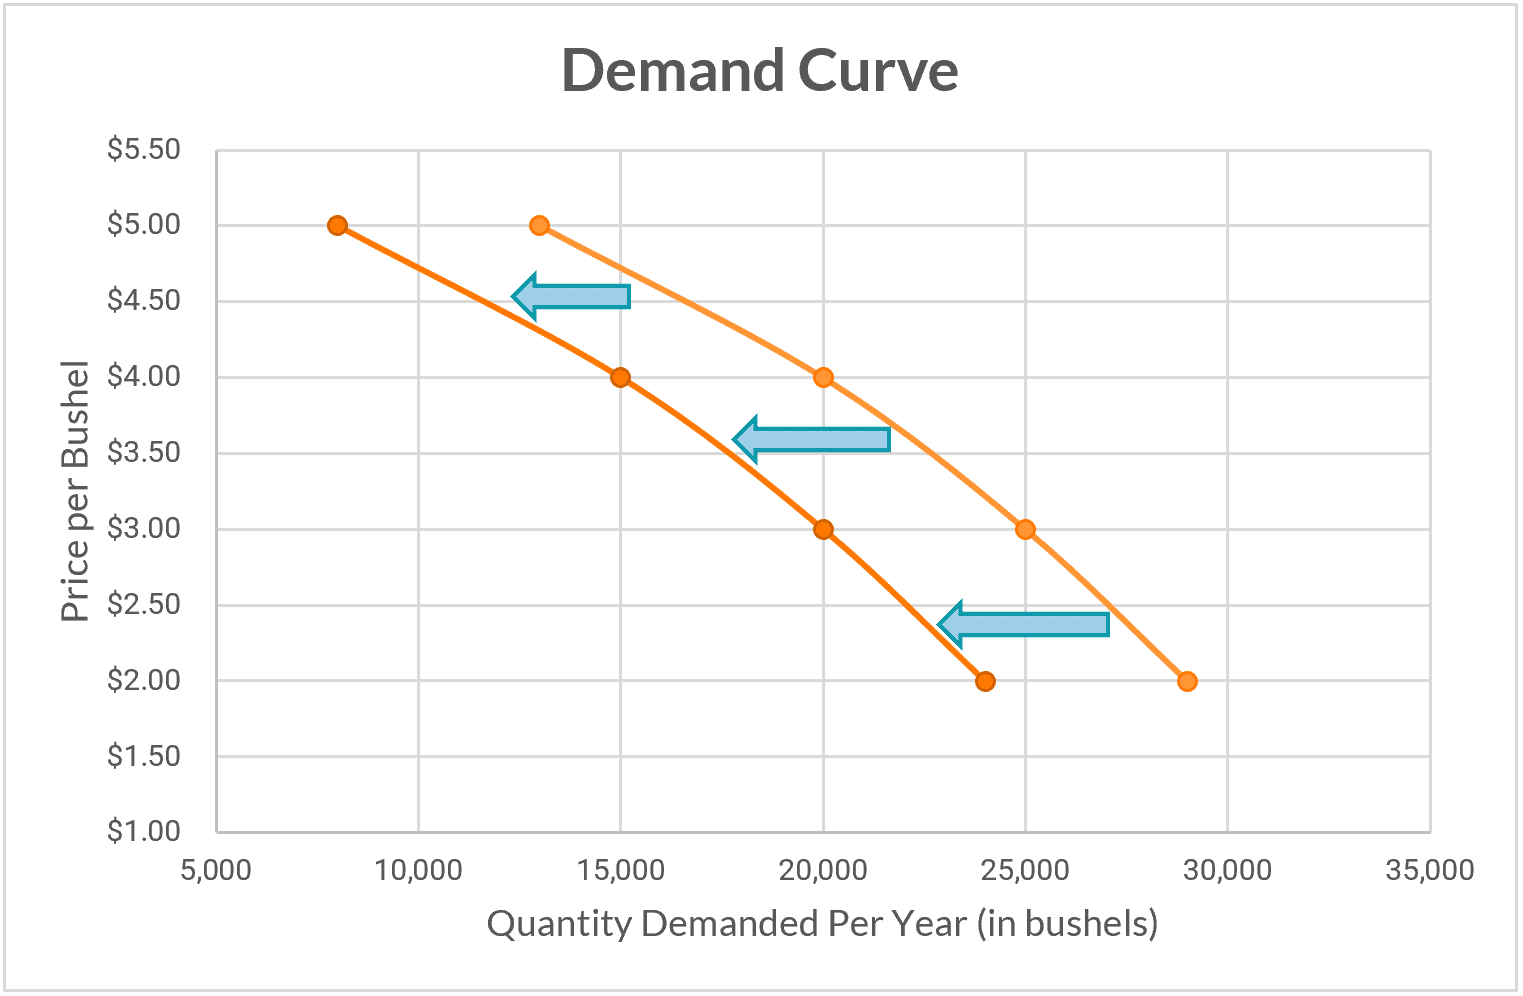
Let's take a closer look at two scenarios that would impact demand for corn in Stalkland. First, what would happen if the price of wheat suddenly went down by half? Wheat is a substitute good for corn—the more wheat people eat, the less corn they will eat. Therefore, the reduction in the price of wheat will reduce demand for corn. Our updated demand schedule and demand curve would look something like this:
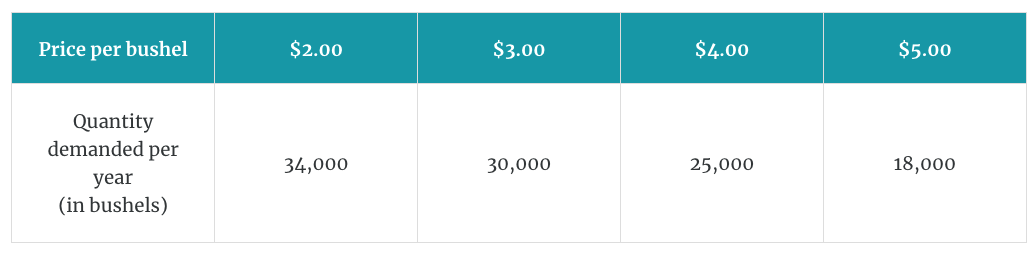
Now, what would happen if there was a mass immigration of refugees into Stalkland from a neighboring country? There would be many more consumers, which would result in a positive change in demand.
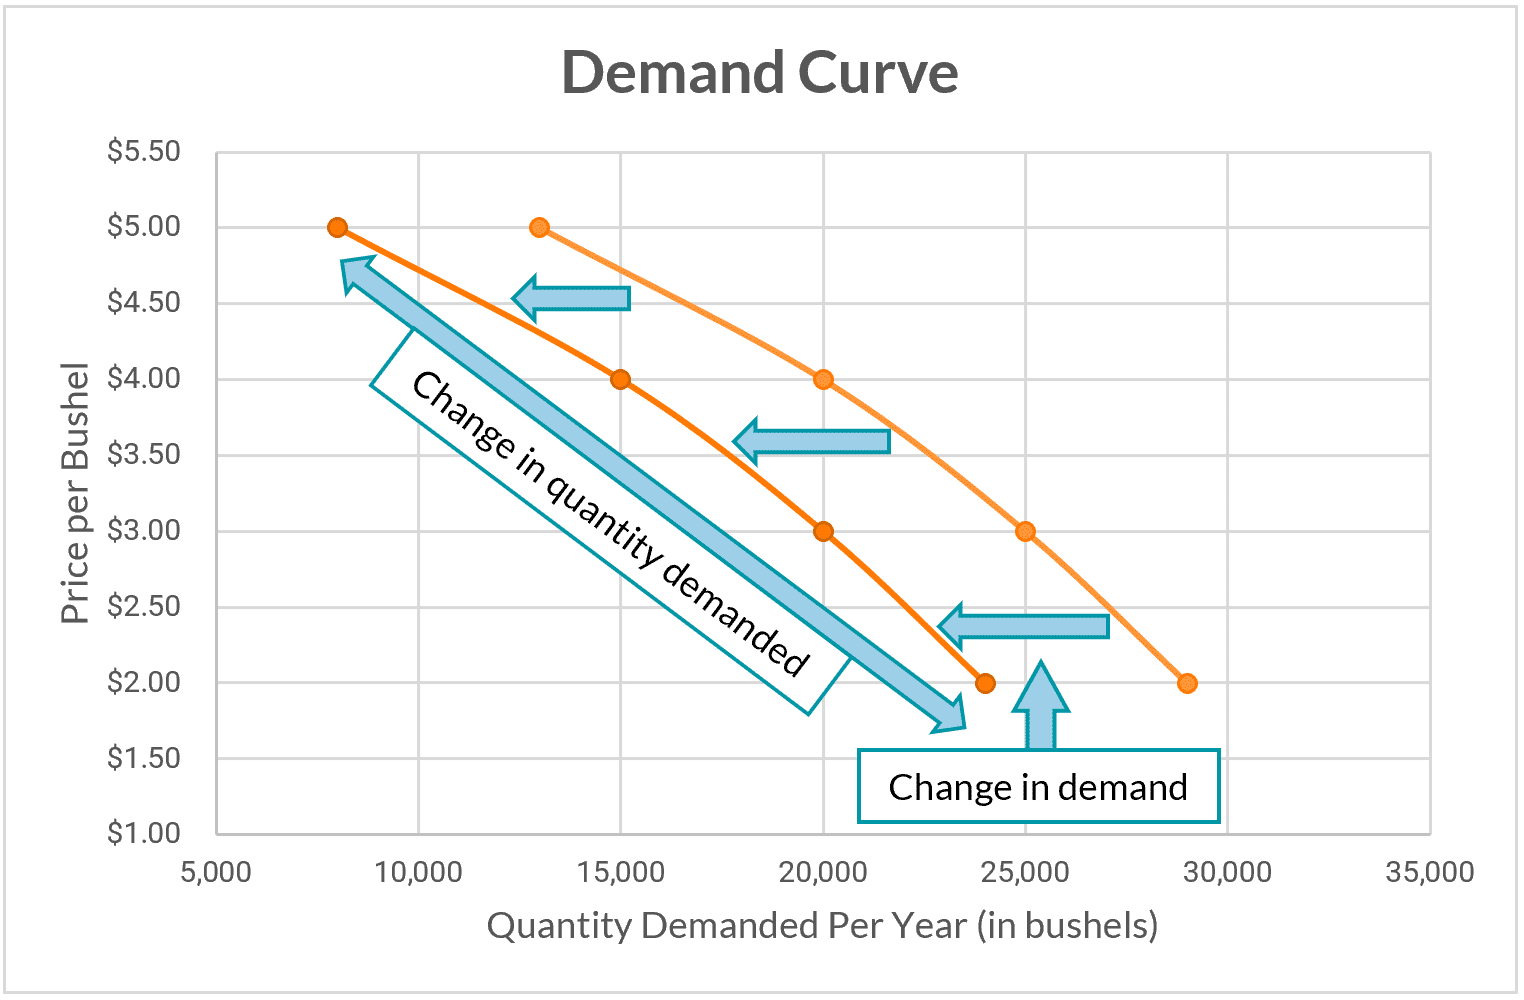
Change in Quantity Demanded vs. Change in Demand
Just as with change in quantity supplied versus change in supply, it's important to understand the difference between change in quantity demanded and change in demand. Change in quantity demanded involves moving up and down along the same demand curve, and price is the only variable that causes the change. Change in demand can happen due to many different factors and involves a shift of the entire curve itself.
Price Signals
Prices provide signals to both buyers and sellers. For example, rising oil prices create an incentive for consumers to drive less or buy cars with better gas mileage; for producers, rising oil prices create an incentive to find more oil. Rising labor prices (i.e., increased wages) create an incentive for employers to implement new technology that reduces the amount of labor required. For example, a fast-food restaurant could replace some of its workers with automated ordering kiosks. The behavior of producers and consumers are both heavily influenced by the prices of goods and services.
Review of Key Terms
demand: the ability and willingness to buy specific quantities of a good or service at different prices in a specific time period, all things remaining the same
law of demand: people will buy more of a good or service at lower prices and less at higher prices, all things remaining the same
quantity demanded: quantity of a product that consumers are willing and able to buy at a particular price, all other things remaining the same
change in quantity demanded: change in the number of products consumers are willing and able to buy due to changes in price
demand schedule: a table that shows the quantity demanded at different prices, all things remaining the same
demand curve: demand schedule represented as a graph
change in demand: a positive or negative shift in the demand curve due to a change in the determinants of demand
normal goods: goods that increase in demand when consumers' incomes increase
inferior goods: goods that increase in demand when consumers' incomes decrease
complements: a relationship between two goods; when the price of one good decreases, demand for the other increases
substitutes: a relationship between two goods; when the price of one good decreases, demand for the other decreases
In the last two lessons, we've learned about how price changes and other variables affect how much of a product producers supply and how much consumers demand. But how is the actual price of the product decided? In the next lesson, we'll use our knowledge of supply and demand to help us figure out how market prices—the price buyers actually pay for products—are determined.