Wk6 - Inference in Linear Predictive Regression
Inference in Linear Predictive Regression
Standard Error
Definition: A measure of the accuracy of predictions made by a regression model. The standard errors of the estimated coefficients (α̂ and β̂) indicate the reliability of these estimates.
Key Concepts:
[α̂ and β̂] are random estimates, derived from sample data, leading to uncertainty regarding their true values.
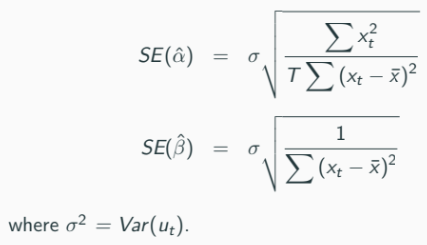
The reliability or precision of these estimators is assessed using their variance or standard errors, expressed as SE(α̂) and SE(β̂).
Precision and Variance
Estimators:
β̂ = (1/T) Σ (xₜ - x̄)(yₜ - ȳ) / (1/T) Σ (xₜ - x̄)²
α̂ = ȳ - β̂x̄
Variance of Estimators:
The variance of β̂ is expressed as Var(β̂) = σ² / Σ(xₜ - x̄)².
For α̂, the variance formula considers both ᾱ and β̂x̄:
Var(α̂) = Var(ȳ) + x̄²Var(β̂)
Estimation of Standard Errors
Formulas:
SE(α̂) = σ * √(Σ(xₜ - x̄)² / T)
SE(β̂) = σ / √(Σ(xₜ - x̄)²)

Unknown Variances: Direct calculation requires knowledge of the disturbance term variance (σ²):
Since ut is unobserved, sample variance is often used as an unbiased estimator:
s² = 1/T Σ û²ₜ (bias introduced)
Statistical Inference
Purpose: Determine the reliability of estimated regression parameters, be it through confidence intervals or hypothesis testing. Example:
β̂ = 0.5 might need verification on whether this estimated value is reasonably close to an unknown population value.
Confidence Intervals
Construction: Based on the properties of OLS estimators:
For β̂:
P(−1.96 < (β̂ − β) / SÊ(β̂) < 1.96) ≈ 0.95 defines the 95% confidence interval as:
[β̂ - 1.96 * SÊ(β̂), β̂ + 1.96 * SÊ(β̂)]
If the calculated interval does not include a certain value (e.g., 1), it implies significance or risk value divergence.
Hypothesis Testing
Null Hypotheses: e.g., H₀: β = β₀ vs. H₁: β ≠ β₀, to assess if the regression parameter significantly deviates from a hypothesized value.
Test Statistic: t = (β̂ - β₀) / SÊ(β̂)
Significance Levels: Typically at 5% (critical values -1.96 and 1.96 from the normal distribution).
One-Sided Tests: For hypotheses of direction, e.g., H₀: β ≤ β₀ or H₀: β ≥ β₀ with respective tailored rejection regions.
Numerical Illustration
Example: Regression between a fund manager's returns and market returns,
Showing calculations of OLS estimator for β, variance estimates, standard errors, and t-statistic application to reject or accept hypotheses.
Found CI for β as [1.394, 1.680], indicating significant positive returns with an avoided null hypothesis of 0 beta.
Conclusion
The notes cover critical points on inference in linear regression beginning from understanding standard errors through to hypothesis testing and confidence intervals, providing insight into practical statistical analysis and parameter estimation.