Unit 2 (Population & Migration)
Population Density
Lesson Vocab
Population: Groups of people
Population Distribution: the pattern of human habitation on the earth’s surface
Distribution asks “where to people live?”
Population Distribution Factors
Physical Factors:
Climate
Landforms
Bodies of Water
Human Factors:
Culture
Economics
Economics can often be a major reason for migration
History
How populations were distributed int he past can have a strong influence on how they are distributed in the present
Politics
Calculating Population Density
Lesson Vocab
Population Density: A measure of how many people occupy a given unit of land
Asks “how many people live here”
Arable Land: Land that can be used for agriculture
Calculating Population Density
Arithmetic Density= Total Population/TotalLand Area
Does not account for distribution of most of the population
Assumes that the population is distributed evenly across a given area of land
Physiological Density= Total Population/ Total Arable Land
The higher the physiological density, the more pressure there is to produce enough food
Agricultural Density= Total Farmers/Total Arable Land
A lower agricultural density means that farming has become mechanized in more developed countries
Why Density and Distribution Matter
Lesson Vocab
Carrying Capacity: The maximum population an environment can support
Not all people use the same amount of resources, therefore it is difficult to determine
Effects of Distribution and Density
Political Process
Economic Processes
Governments also allocate money for infrastructure projects like roads and bridges
Social Processes
Environment and Natural Resources
Population and Composition
Lesson Vocab
Population Composition: The measure of certain characteristics of a population like age, race, gender, etc.
Dependents: People who depend on others to survive, usually children under age 15 and elderly people over age 65
Higher dependency ration, more pressure on the working population
Higher dependency ration entails that there are less people working
A lower dependency ratio entails that more people int he population are working
# Dependents/# Working Age * 100
Population Composition
Age Structure
An organization of a population based on age groups
Knowing how many people fit into different age groups helps enable geographers to draw conclusions about whether a population is growing or stable or declining
Sex Ratio
Represents a comparison of males to females in a population
Population Dynamics
Lesson Vocab
Population Dynamics: How geographers study the trends in population growth or decline
Life Expectancy: How long an average person is expected to live
RNI: Rate of natural increase
Positive RNI means the population is growing and a negative RNI means the population is declining
Doubling Time: How long it will take for a given population to double given the current population growth trends
Population Dynamics
Fertility Rate
A measure of a population’s ability to have children
Knowing the fertility rate is useful for governments who want to know if their populations are going, remaining stable, or declining
Mortality Rate
Indicate a populations rate fo death
Measuring the Fertility Rate
Crude Birth Rate
The number of births per 1000 people in a given year
Total Fertility Rate
The average number of children one woman will have during her child bearing years (age 15-49)
A country’s total fertility rate is often a signal of that country’s access to healthcare and medical services
Lower total fertility rate usually entails that a nation has more access to fertility rate
Measuring the Mortality Rate
Crude Death Rate
Measures the number of deaths per 1000 people
Infant Mortality Rate
The number of children who die before they reach the age of 1 per 1000 live births
The infant mortality rate is often a better indicator of a country’s access to healthcare than CDR
Geographers use both the crude birth rate and crude death rate together when they want to study changes in population
Migration
The RNI says nothing about population increase or decline due to migration
Growth/Decline Factors
Lesson Vocab
Factors influencing Growth & Decline
Social and Cultural
E.g. different country’s have different expectations for different genders
Political Factors
E.g. China’s one child policy for population decrease
Economic Factors
Fertility rates often decline during economic downturns as people may be worried that they will not be able to afford taking care of children
Demographic Transition Model
Lesson Vocab
Demographic Transition Model: Theoretical model that traces how populations grow and decline
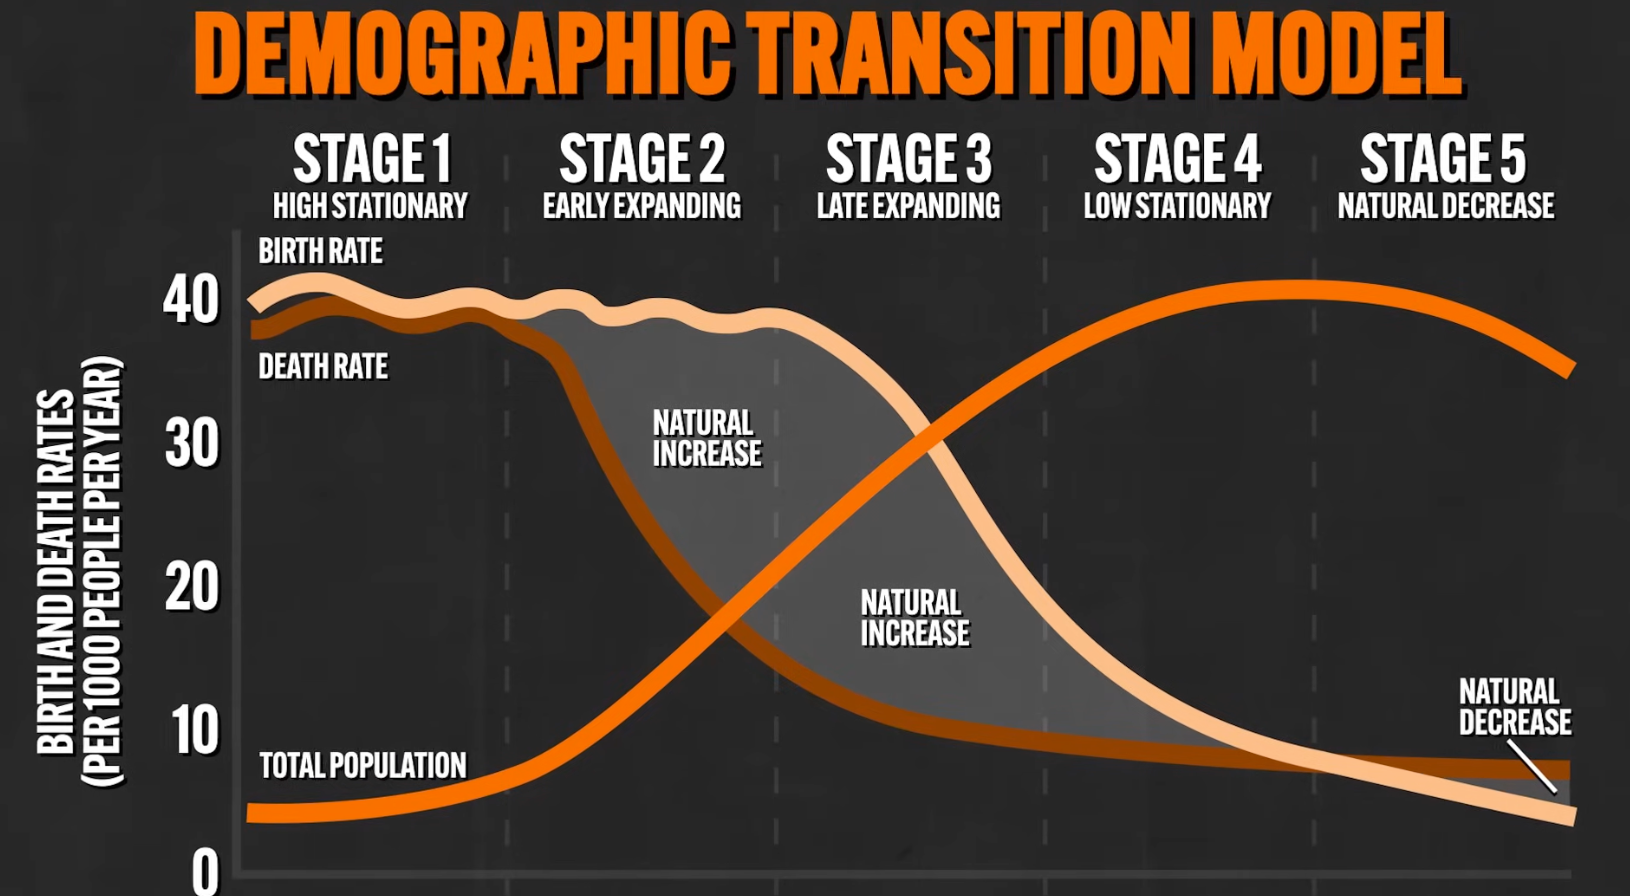
Agrarian: People are mainly farmers
Pre-Industrial: Everything people needed to love like clothes and tools were made by hand and not machines
Industrialization: Marked a transition from agrarian society to modern, mechanized society
Epidemiological Transition Model: Looks at population growth though a scope of disease
Focuses on the death rate and tries to explain why the death rate changes over time
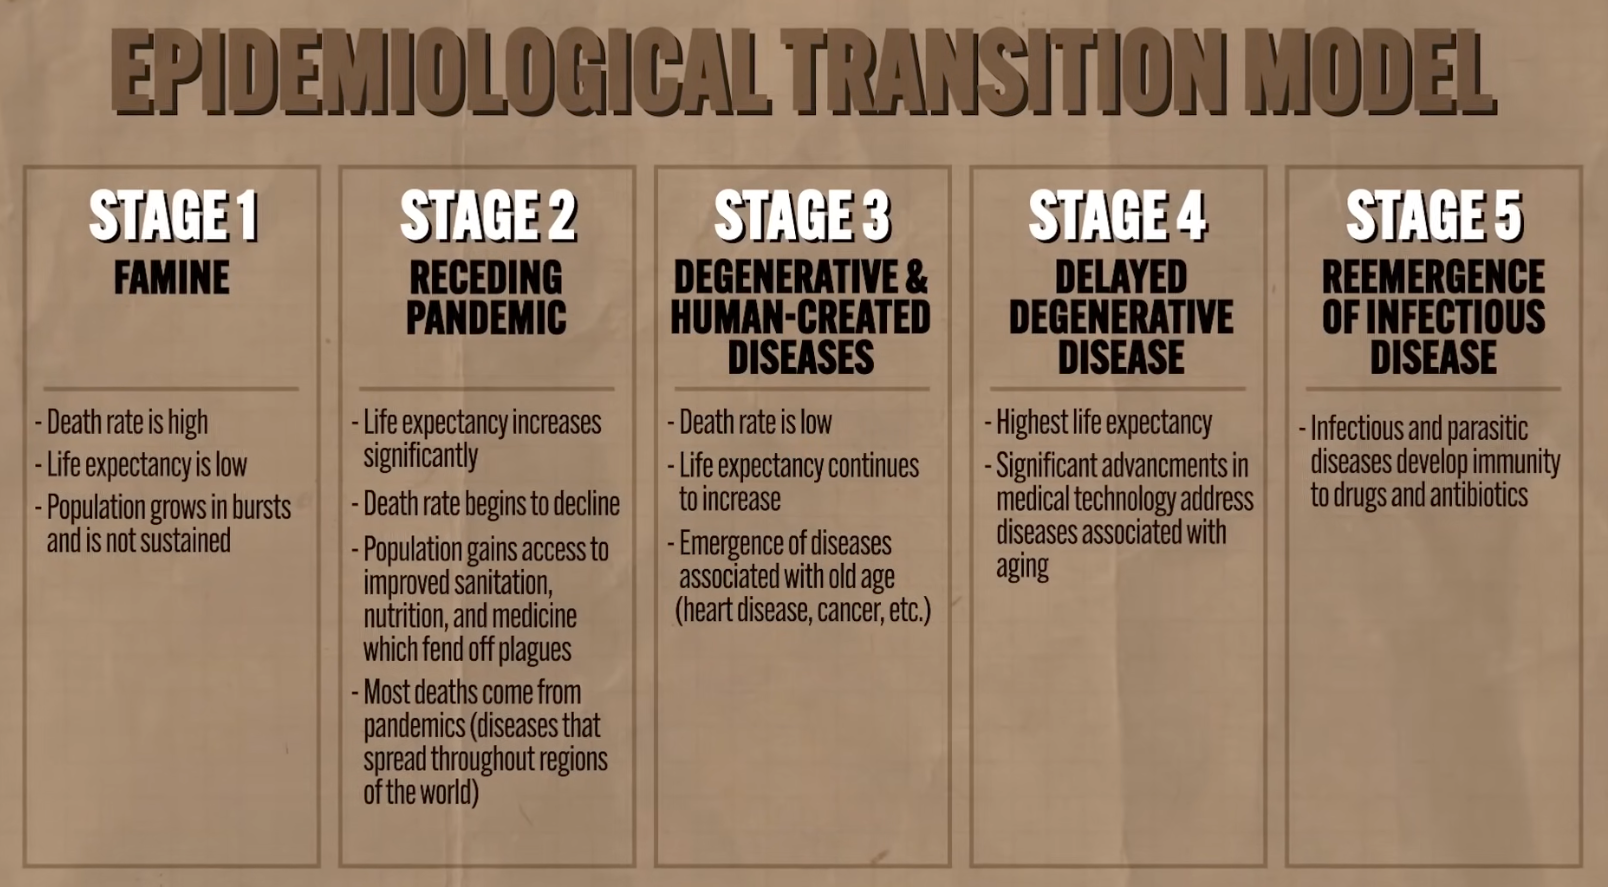
Oversimplifies the causes of population change due to diseases
Doesn’t account for poverty as a cause of the spread of disease
Malthusian Theory
Lesson Vocab
Malthusian Theory
While the population of Europe was growing exponentially, the food supply was growing arithmetically
Basically worried that as the population grew there wouldn’t be enough food to feed the population, ultimately resulting in famine
Population Policies
Population data matters to governments
Lesson Vocab
Antinatalist Policies: Policies intended to decrease the number of children born
E.g. One child policy
Pronatalist Policies: Policies intended to increase the number of babies born
How Data Influences Governments
Antinatalist Policies
Pronatalist Policies
Immigration Policies
Either allow more immigrants in or restrict the flow if immigrants
Women and Demographics
In places where women’s status is elevated and they have more access to healthcare, contraception, and education, fertility rates tend to decrease
In places that uphold more traditional gender roles, which is to say, women are mainly seen as the bearers of children, fertility rates tend to increase
Elevating Women’s Roles
Access to Education
When women have access to more education, they tend to have fewer children
Family Planning
Includes medical technologies that can help women have more control over when and if they get pregnant
Employment
Women’s Effect on Mortality and Migration
Mortality
As women have more access to education, health care, and family planning, they have fewer babies
The fewer babies that are born the more likely they are to live
As women are elevated, the infant mortality rate decreases
Migration
Ernst Georg Ravenstein (19th century geographer)
Developed 11 laws of migration to explain: how, why, and under what conditions people migrate
Law 6 states that women are more likely to migrate within their home country while men are more likely to migrate to other countries
Aging Population
Lesson Vocab
Aging Population: A population in which the dependency ratio is increasing
Tend to have a lower total fertility rate (<2.1)
Consequences of an Aging Population
Political
Social
Economic
Causes of Migration
Lesson Vocab
Immigration: People coming into a country
Emigration: Refers to people leaving a country
Why People Migrate
Push Factors
Negative experiences that push people out of their country
Pull Factors
Positive factors that attract migrants to new places
Categories of Push/Pull Factors
Cultural (e.g. persecution)
Demographic (e.g., lack of healthcare)
Economic (e.g., finding work)
Environmental (e.g., more desirable climates)
Political (e.g., war)
Forced Migration vs. Voluntary Migration
Lesson Vocab
Voluntary Migration: Migration that occurs when people leave their homes because they want to
Forced Migration: Migration that occurs when people leave their homes against their will
People often flee their country because of ar or persecution
Refugees: Cross international borders
Internally Displaces Persons: Migrate within their home country
Seven Categories of Voluntary Migration
Transnational
Migrants retain strong ties to their culture and famiy back home while they live in a place that is not their home
Transhumance
Migration by people who move not because of unforeseen push/pull factors but because movement is their way of life
Internal Migration
Migration within the borders of a country
According the Ravenstein’s Laws of Migration: Most migrations occur over shorter distances because there are less intervening obstacles encountered over shorter distances
Chain Migration
One group of migrants can often cause other migrants to follow them
Step Migration
A migrant’s journey often occurs in stages, or steps, not all at once
Guest Workers
A temporary form of migration in which migrants travel to a new country to work for a specified amount of time
Rural-to-Urban
The movement of people from sparsely populated countrysides to densely populated urban centers
Effects of Migration
Political
Can change the distribution of political powers
Economic Effects
Can be felt at destination and with the loss of people from the population
Cultural