Topic 7
Controlling for Individual Differences with More than one Repeated Measure in Factorial RM ANOVAs
Example Study: 2 (target presence: present, not present) x 3 (number of distractors: one, two, three) repeated measures design where DV = mean correct reaction time. Partitioning variance for RM designs with two RM factors
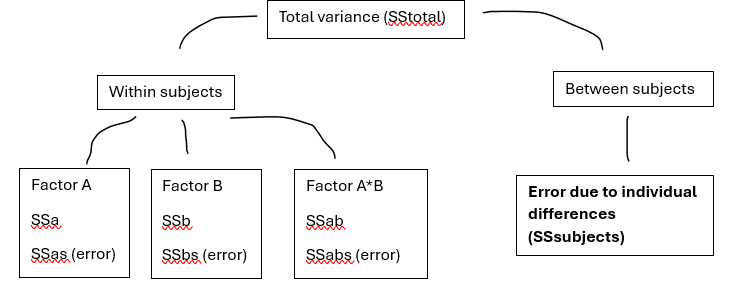
SSsubjects: error due to individual differences
To calculate SSsubjects for a repeated measures design, calculate the overall mean reaction time score for each participants (independent of condition) and examine how different this is from the grand mean of the DV.
This is the error due to individual differences that we can then exclude from each repeated main / interaction effect
We can do this because individual differences do not impact repeated measures designs because the same participant is participating in all conditions
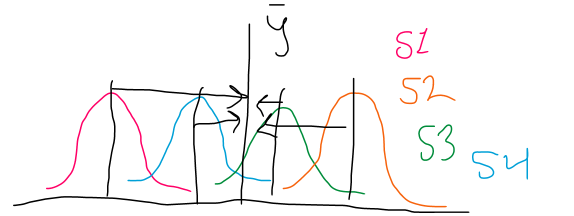
Taking away the grand mean from each individual’s overall mean score on the DV (independent of condition):
Where S(ab) = the subjects individual overall mean across all conditions and y = the grand mean
SSas: all variance for Factor A
Here, the main effect for factor A is whether the presence of a target influences mean reaction time. To calculate this, calculate the reaction time for each subject averaged over scores on Factor B
Means each participant will have 2 means: one for each level of Factor A (target present and target absent) that is averaged across all levels of Factor B
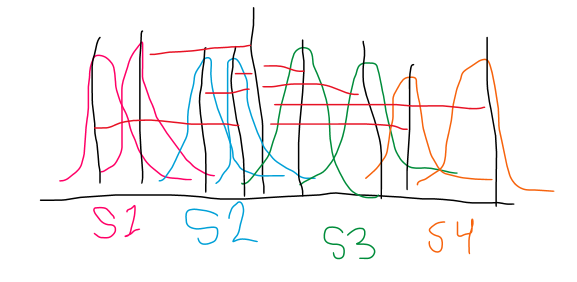
Taking away the grand mean from each individuals means on each level of Factor A across all levels of Factor B:
where A(a*s) = each mean for each subject for each level of the IV and y = the grand mean
SSa: all variance explained in Factor A
Tells us how different each mean for each level oof Factor A is from the grand mean. Means we will get 2 means in this example: one for target present and one for target absent (again across all levels of Factor B)
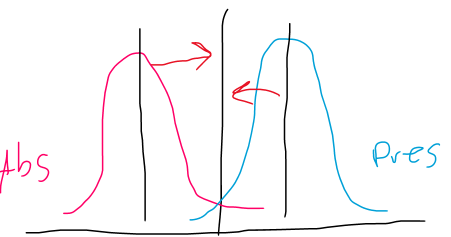
SSa =
where A(i) = the mean for each level of Factor A and y = the grand mean
the difference between the mean of each level of Factor A and the grand mean
We can also calculate the error for factor A by subtracting the variance explained for Factor A and error due to individual differences from the overall variance for Factor A
SSa*s – SSa – Sssubjects
This same process is undertaken for all factors
Factor AB/ the Interaction: look at how different each interaction mean is from the grand mean
Subtracting SSa and SSb from SStotal, so any variance that has already been accounted for.
SSa*b error: how different each participant score is from the overall mean of the interaction group
SSaberror = SSab interaction error – Ssaerror – Ssberrer – Sssubjects
Controlling for Individual Differences in Mixed ANOVA
Mixed ANOVAs are a powerful statistical analysis often used in psychological research that use a combination of repeated and independent measures
Error Terms in Mixed ANOVAs
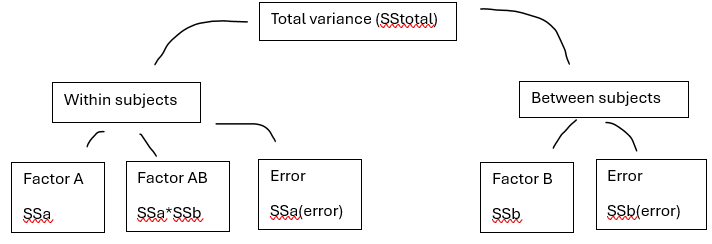
Where Factor A is the RM factor and Factor B is the BG factor.
Remember individual differences are controlled for in any RM factors, including the interaction
The BG factor includes all error components in its error term (like with any BG design)
Analysing and Interpreting Mixed ANOVAs
Example Analysis: a 2 (task: easy, hard) x 2 (reader group: control, dyslexia) mixed factorial design where task difficulty is the repeated measure. DV = percentage of errors on the test
Hypotheses:
Dyslexia group will make significantly more errors than the control
Significantly more errors will be made in hard tests than easy tests
Can see the interaction is not expected to be sig, but still need to examine this first – because if this is sig, it will influence how we can examine the significance of each main effect.
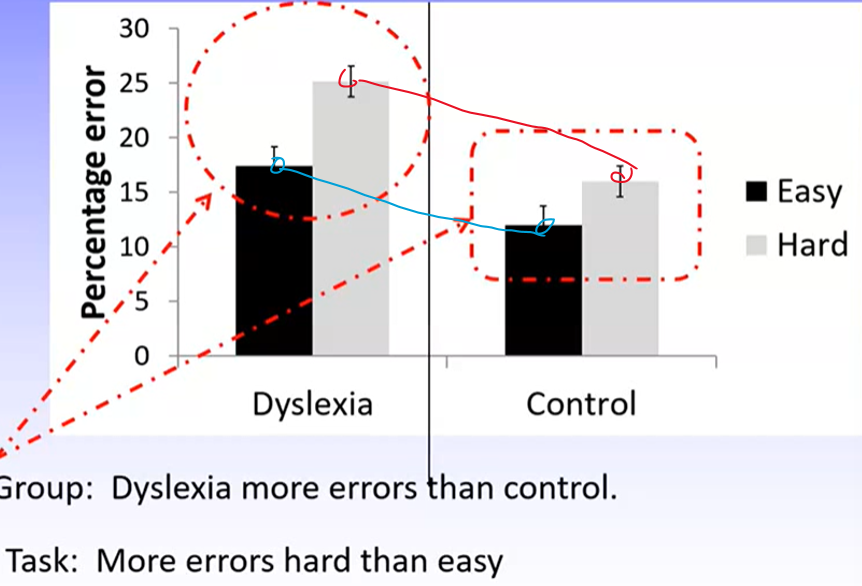
Based on the graph, it doesn’t look like there is any interaction effect (as the lines are parallel), however, we still need to examine the SPSS outputs to confirm this.
Also looks like the dyslexia group makes more errors than control (supports H1)
Also looks like hard test results in more errors than easy test (supports H2)
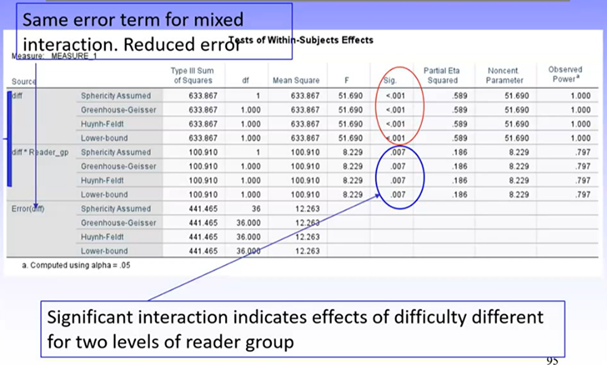
Interaction is statistically significant!! (this is why it Is important to also check the output). While the main effect for task difficulty is significant, because there is a significant interaction we cannot interpret this on its own, and will need to investigate simple effects analysis as well.
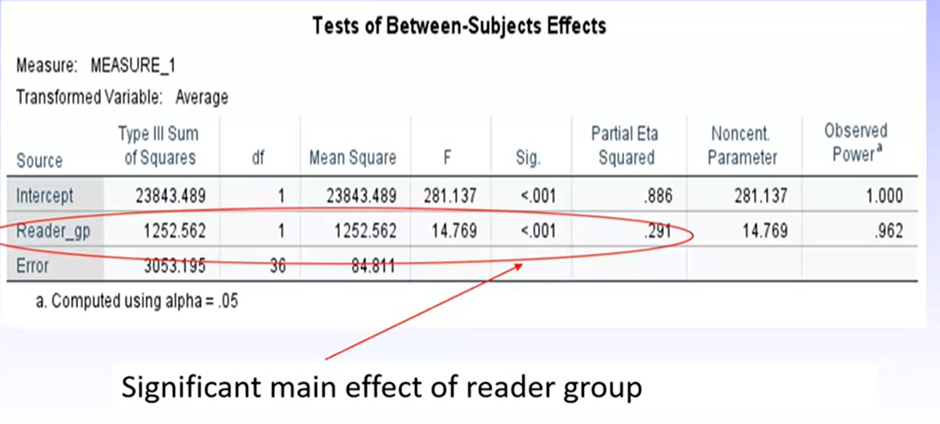
Again we have a sig main effect for reader group, but we cannot interpret this on its own because of the sig interaction.
We always investigate simple effects based on hypotheses because otherwise we would be looking at way too much data and would not be able to extract anything meaningful from it.
the multivariate tests table treats the repeated factor as a separate dependent variables for each level (e.g., hard and easy task), and is interpreted the same way as a standard analysis of variance table
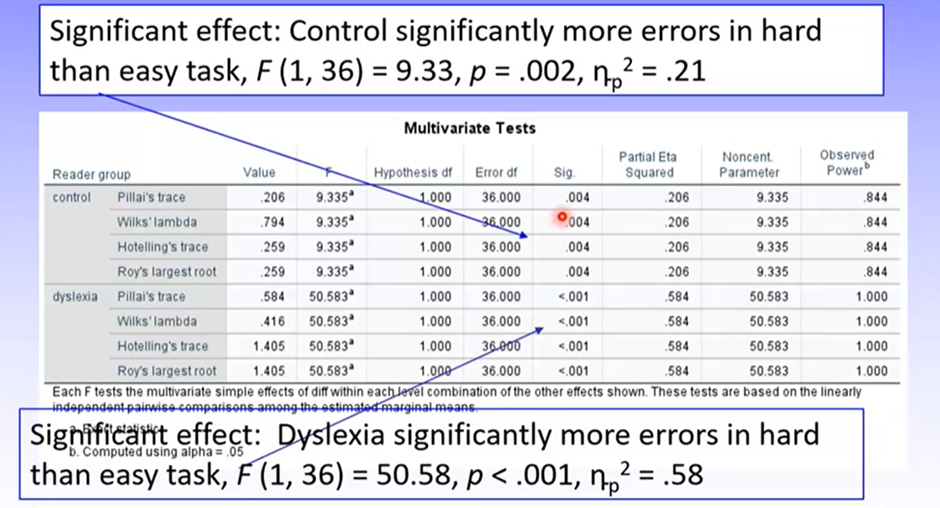
Can see there is a significant difference in performance between hard and difficult tasks for both the control and dyslexia groups (from descriptives and graph we know hard task = worse performance for both)
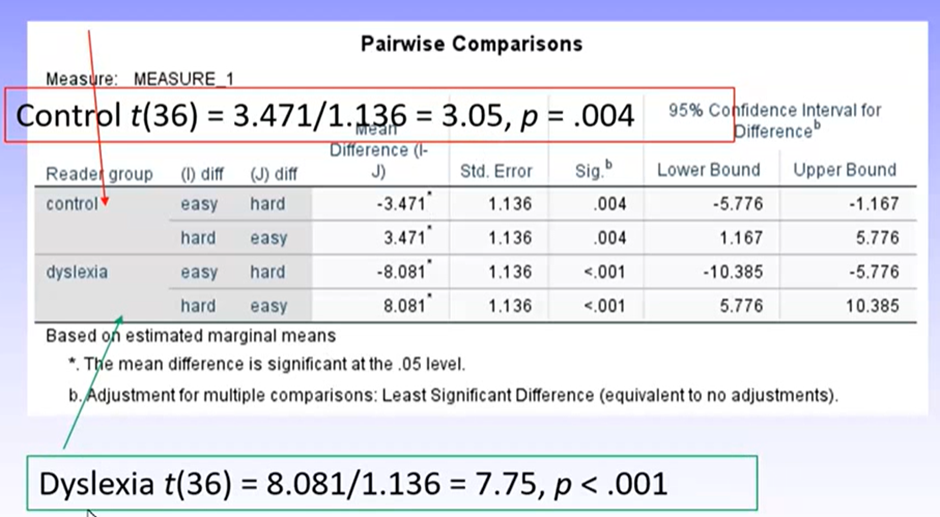
This tells us the same thing where there are 2 levels of an IV, so only need to report one or the other
recall that the t-value = mean difference / standard error
Considering the simple effects analysis indicated that the dyslexia group performed worse than the control group across both test difficulties and that participants in both the dyslexia and control groups performed worse in the hard test than easy test – why are we seeing a significant interaction?
Because the interaction is one of magnitude – the magnitude of the difference in performance between easy and hard tasks is larger for the dyslexia group than it is for the control group.
Thus suggests an ordinal interaction: both groups display a similar pattern of performance in that they find the harder tests more difficult, this is more impactful for the dyslexia group than control group
For good measure, we should also compare performance across reader groups for easy and hard tests separately. This will confirm that the interaction is ordinal.
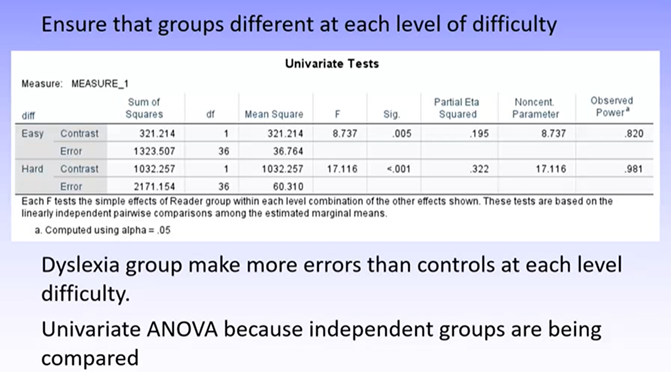
Can see there is a sig difference in performance across reader groups for both easy and hard tests
We know from descriptives and graph that dyslexia group performs worse
Therefore, we can conclude:
Performance is sig worse in hard than easy tasks for both reader groups
Dyslexia group performed sig worse than control group across all task difficulties
The difference in performance between easy and hard tasks is larger for the dyslexia than control group – this was a non-hypothesised effect but one we would still report
Reporting:
In the 2 (reader group) x 2 (task difficulty) mixed factorial ANOVA, significant main effects were found for task difficulty F(1, 36) =51.69, p < .001, np2 = .59 and reader group F(1, 36) = 14.77, p < .001, np2 = .29. There was also a significant interaction between task difficulty and reader group F(1, 36) = 8.23, p = .007, np2 = .19 (see Figure 1).
Report all sig main and interaction effects
Simple effects analysis on the significant interaction found that for both the dyslexia group F (1, 36) = 50.58, p < .001, np2 = .58, and the control group F (1, 36) = 9.33, p = .002, np2= .21, accuracy was poorer in the hard than easy conditions. The magnitude of this effect was greater for the dyslexia group, explaining the interaction. Overall, the group with dyslexia were less accurate than the control group. These findings supported the hypotheses.
Report what simple effects were run and what hypotheses they were for
Report findings of simple effects analyses and whether hypotheses were supported
Higher Order Effects (3 IVs)
A three-way interaction occurs when the presence of a two-way interaction is itself conditional on another factor. Three-way interactions need to be carefully conceptualised in a figure based on the research question.
Example three-way interaction figure:
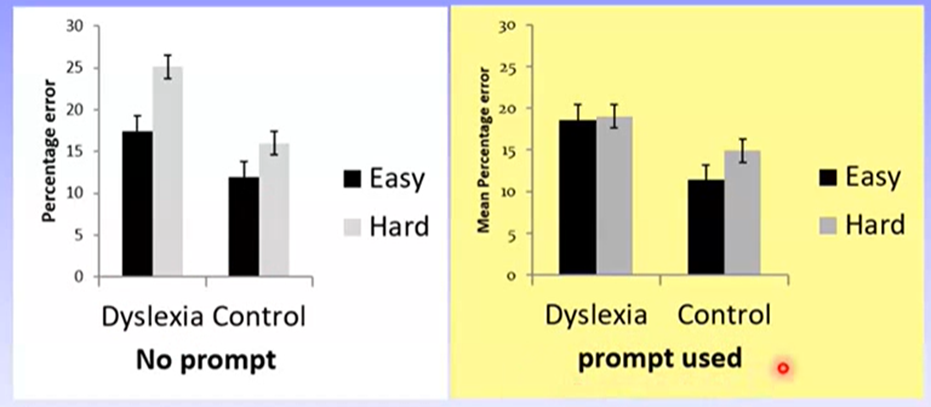
Here, the IVs are:
Task difficulty (easy, hard)
Reader group (dyslexia, control)
Prompt presence (no prompt, prompt used)
Therefore, this would be a 2 x 2 x 2 mixed factorial design, where DV = percentage of errors in task.
To examine whether there is a significant three-way interaction in this example, we could ask: does the effect of task difficulty on reader group differ depending on whether there is a prompt present?
If yes, there is likely a sig three way interaction
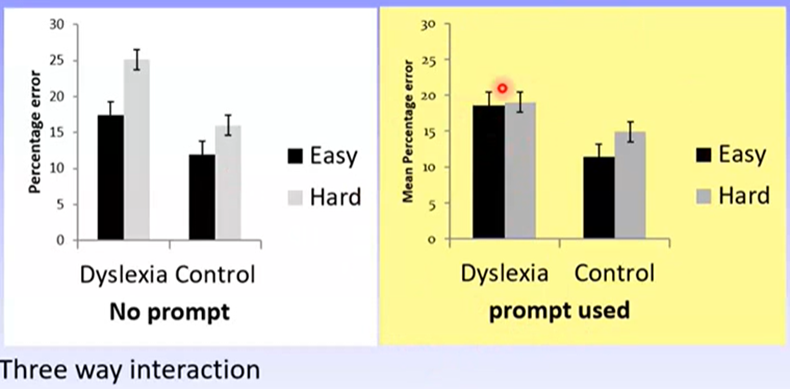
In this graph: looks like there is a sig three-way interaction because harder tasks predict poorer performance for the control, but not dyslexia group, in the prompt condition, while predicting poorer performance for both reader groups in the no prompt condition
Interpreting Complex ANOVA Results
Using same example as above, our hypotheses were:
In no attention condt: both groups would make more errors on hard than easy tasks
In attention condt: both groups would not differ in performance between easy and hard tasks
Because a different pattern of results is expected for the no attention and attention conditions, a three-way interaction is expected.
Independent of all other effects, the dyslexia group will make more errors than the control
This will have to be assessed using simple effects analyses
Remember the graph:
Mixed factorial ANOVA results:
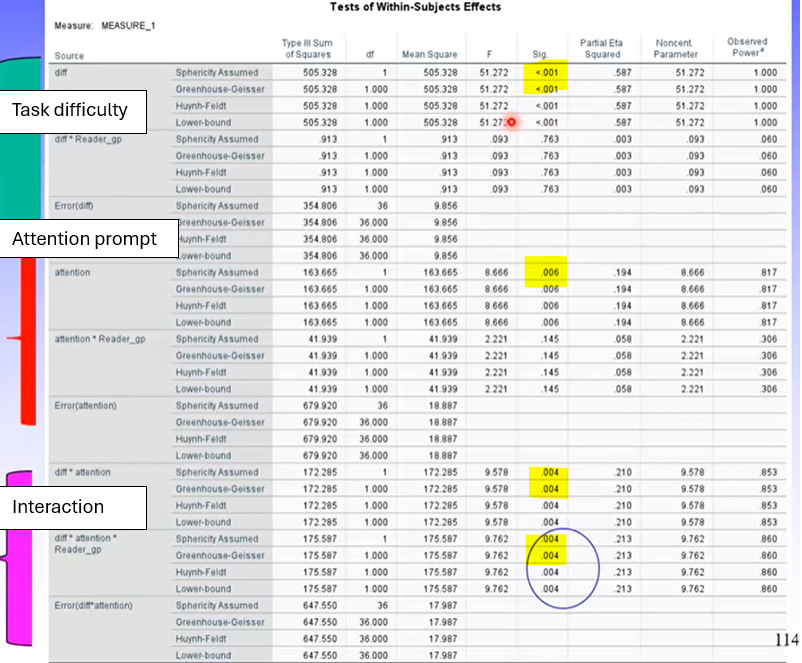
Can see we have a sig main effect for task difficulty and prompt condition, as well as a sig 2-way interaction for task difficulty * prompt condition, and finally there is a sig 3-way interaction.
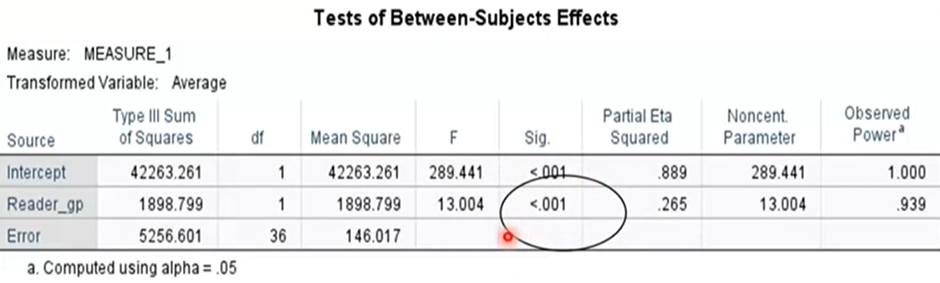
There is also a main effect for reader group.
So altogether what we have is:
3 main effects
1 2-way interaction (didn’t hypotheses about these so don’t need to examine)
1 3-way interaction
Analysis of Significant Three -Way Interactions Based on Research Questions
Analysis of a significant three-way interaction requires interaction contrasts: which evaluate the effects of two separate IVs for different levels of a third IV. These can be undertaken by:
Breaking up the analysis into smaller components
Using syntax to directly examine the analysis questions
For hypotheses 1 and 2, we want to examine the difference in performance across task difficulty for the different reader groups in each of the attention prompt conditions
/emmeans = tables (reader groupdifficultyattention prompt) compare (difficulty)
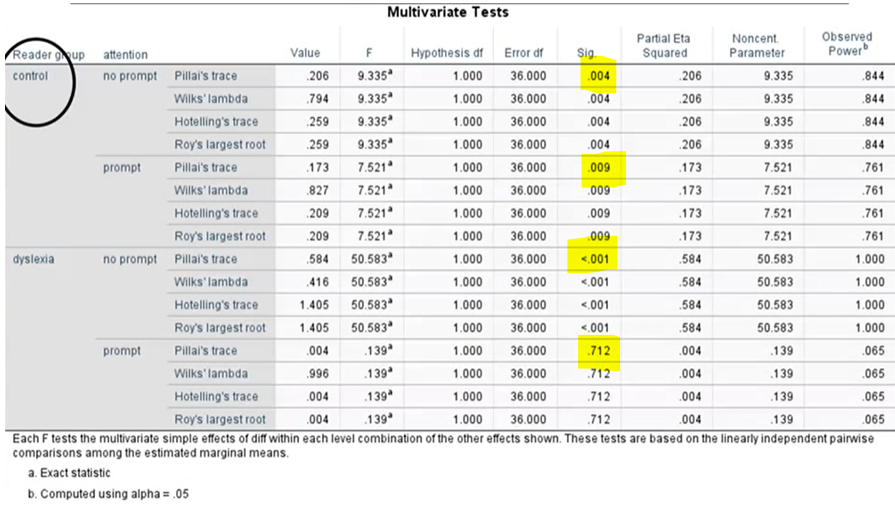
This tells us:
For no prompt condition: both control and dyslexia groups perform dig worse in hard than easy tasks
For attention prompt condition: only control group performs worse in hard than easy tasks, while dyslexia group performs similarly across both
Looking at the graph this looks to be the case as well:
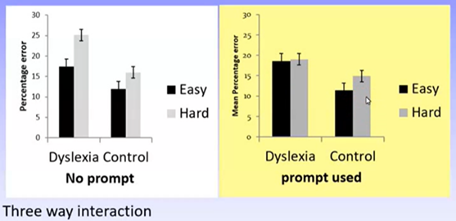
Therefore, H1 is supported, but H2 is only partially supported (as there was a sig difference in performance across task difficulties for control group in prompt condition)
Not that we have not yet examined the main effect for reader group.
How to Address Further Hypotheses in Complex Research Designs
Further hypotheses (for same example):
Control group: performance will not differ between prompt conditions for easy or hard tasks
Dyslexia group: performance will not differ between prompt conditions for easy or hard tasks
Can see that these hypotheses contrast the effect of the prompt condition for each reader group across easy and hard tasks.
These hypotheses would be better represented graphically like so:
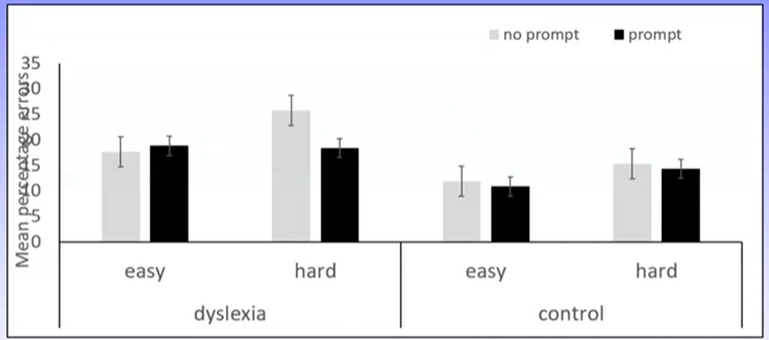
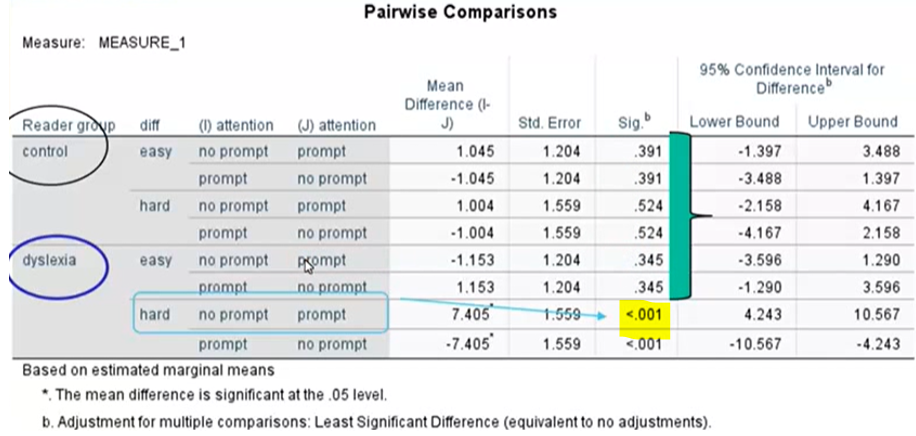
Can see there is no difference in performance across prompt conditions for easy or hard tasks for the control group (H4 supported), and there is no difference in performance across prompt conditions for easy tasks for the dyslexia group – however, performance in the no prompt condition was sig worse than the prompt condition for the hard task for the dyslexia group (H5 only partially supported)
Recall H3 proposed that independent of task difficulty or attention prompt, the dyslexia group would perform worse than the control group.
Examine this using the emmeans line for the three way interaction
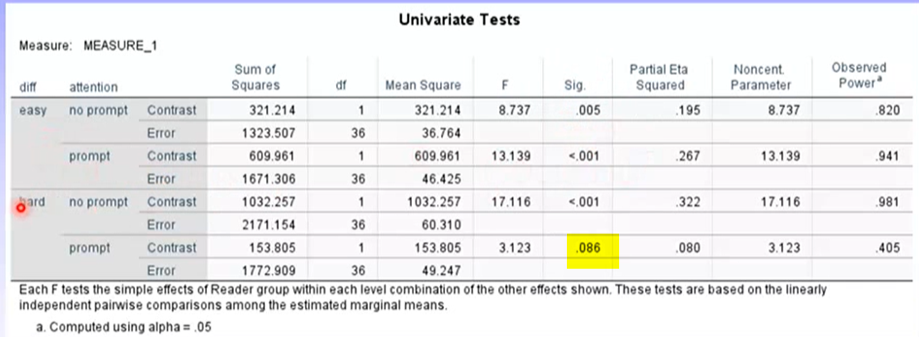
This hypothesis (H3) was ultimately not supported as there was no sig difference between reader groups for hard tasks in the prompt condition.