ECONOMICS non cad
MICROECONOMICS TOPICS
1.Basic Economic Problem Key Terms
Scarcity – Limited resources but unlimited wants/ Limited supply but unlimited demand
Choice – People must choose how to use limited resources.
Opportunity Cost – The next best alternative that is given up.
Concept
The basic economic problem exists because:
Human wants are unlimited
Resources are limited
Because of scarcity, individuals, firms, and governments must make choices, leading to opportunity cost.
2. Factors of Production Key Terms
Land – Natural resources (oil, forests, minerals).
Labour – Human effort used in production.
Capital – Man-made goods used to produce other goods (machines, tools).
Enterprise – Risk-taking and organizing production.
3. Opportunity Cost Key Terms
Opportunity Cost – The value of the next best alternative forgone.
Concept
Occurs whenever a choice is made.
Example:
Spending two hours doomscrolling means the opportunity cost is the study time you could have accomplished instead.
Supply and demand
When price rises → demand falls
When price falls → demand rises
Demand curve:
Downward sloping
Supply
Supply = willingness and ability to produce goods.
Law of Supply:
When price rises → supply rises
When price falls → supply falls
Supply curve:
Upward sloping
Equilibrium
Occurs when:
Supply = Demand
At equilibrium:
Market price is stable.
3.Government roles
Government- A group that overseas as community,esteblishing rules, and administering public policy.
Government are both producers and employer
P- produces goods(merit/public)
E-workers and managers to opperate state owned enterprises
Gov | Main Roles / Policies |
|---|---|
Local | - Collects local business taxes |
National | - Sets national business taxes |
International | - Manages trade with other countries |
AIMS OF THE GOVERNMENT
-FULL EMPLOYMENT/LOW UNEMPLOYMENT
-ECONOMIC GROWTH
-PRICE STABILITY
-REDISTRIBUTION OF INCOME
-BALANCE OF PAYMENT
LOW UNEMPLOYMENT
People who are willing and able to work can find employment
Economically active( looking for j*b)
Economically inactive (those who are dependent on labor force)
Labor force
-the total number of people who are either employed or actively seeking employment
Unemployment rate
Unemployment rate/Labor force x100
Working-age population = 1,000
Employed = 600
Unemployed (looking for work) = 100
Labor Force = Employed + Unemployed = 600 + 100 = 700
Unemployment Rate=100/700×100=14.3%
High unemployment is costly → fewer taxes collected, more government spending on welfare, lower production, reduced purchasing power.
Trade-off: Full employment may cause inflation if demand rises too much.
PRICE STABILITY
Avoiding prolonged inflation and deflation
Inflation = Sustained rise in the general price level of goods/services.
Deflation = Sustained fall in general prices.
High inflation reduces the value of money and purchasing power.
Deflation can lead to unemployment and lower output.
Government aim: keep inflation low and stable to ensure confidence, planning, and stable wages.
PRICE STABILITY VS LOW UNEMPLOYMENT
When unemployment falls, more people have jobs and income.
This increases aggregate demand (AD) → firms produce more.
if AD grows too quickly, it causes demand-pull inflation (prices rise because too much money is chasing too few goods).
Conflict: Achieving very low unemployment often leads to higher inflation, making price stability difficult.
ECONOMIC GROWTH
Increase in the output of goods/services (measured by GDP).
Encouraged by: low taxes, support for private businesses, development of high-tech industries.
Actual growth: short-term, demand-side (shifting AD).
Potential growth: long-term, supply-side (shifting AS).
Economic Growth vs Price Stability
Strong growth often increases demand for resources (labour, raw materials).
This can lead to cost-push inflation (higher wages, higher production costs).
Also, more consumer spending may increase demand-pull inflation.
Conflict: Sustained high growth makes it difficult to keep prices stable.
REDISTRIBUTION OF INCOME
Government reduces inequality through taxation and spending.
Rich taxed more → poor supported via housing, healthcare, and education.
Risks: discourages enterprise, may slow growth, may cause unemployment if firms relocate.
Redistribution of Income vs Economic Growth
Redistribution requires higher taxes on the rich and businesses to fund welfare (healthcare, housing, benefits).
But high taxes may:
Reduce incentives to work, save, or invest.
Discourage entrepreneurs from starting/expanding firms.
Push businesses abroad (to lower-tax countries).
Redistribution vs Price Stability
Welfare spending and income support increase aggregate demand.
Higher demand can push up prices → inflation.
Conflict: Reducing inequality may undermine price stability.
Balance of Payments Stability (BOP)
BOP = financial record of all transactions with the rest of the world.
Current account records exports and imports of goods/services.
Stability = value of exports ≈ value of imports (avoid deficit/surplus).
If imports > exports → deficit (living beyond means).
Links with other aims
Growth ↑ → imports ↑ → deficit.
Full employment ↑ → wages ↑ → inflation ↑ → exports less competitive.
Full Employment vs Balance of Payments Stability
When employment rises, incomes rise → higher domestic consumption.
More imports are purchased, creating a trade deficit.
At the same time, higher wages make exports more expensive → less competitive abroad.
Conflict: Full employment can worsen the balance of payments.. Economic
Economic Growth vs Balance of Payments Stability
Economic growth = higher output, higher incomes, more consumption.
As people’s income rises, imports increase (buying foreign goods).
This can create a current account deficit (imports > exports).
Additionally, higher growth may raise costs and wages, making exports less competitive.
Conflict: Rapid growth worsens the balance of payments position.
FISCAL POLICY
Government budget: plan for revenue (taxes) and expenditure (spending).
Tax revenue sources:
Income tax, corporation tax, sales tax, excise duties, import tax, capital gains tax, inheritance tax, carbon tax.
Budget outcomes:
Balanced budget → revenue = spending.
Surplus → revenue > spending.
Deficit → spending > revenue.
Tax systems:
Progressive tax → higher % from rich.
Proportional tax → same % from all.
Regressive tax → higher % from poor.
Expansionary Fiscal Policy
Definition: Rises in government expenditure and/or cuts in taxation designed to increase Aggregated demand.
Goal: Encourage growth, reduce unemployment, fight recession.
Effects:
More disposable income → higher consumer spending.
More demand → businesses hire more workers.
Economy grows faster.
Example: Cutting income tax and increasing infrastructure spending during a recession.
Expansionary Fiscal Policy → Macroeconomics
Economic Growth: ↑ Govt spending & ↓ taxes → ↑ Aggregate Demand (AD) → higher GDP.
Employment: Higher demand → firms hire more workers → ↓ unemployment.
Inflation: Risk of demand-pull inflation if economy nears full capacity.
Balance of Payments: More demand may ↑ imports → trade deficit worsens.
Income Distribution: If taxes are cut for lower incomes or welfare spending rises → more equal distribution.
Contractionary Fiscal Policy
Definition: Cuts in government expenditure and/or rises in taxation designed to reduce aggregated demand
Goal: Reduce inflation, prevent overheating.
Effects:
Less disposable income → lower consumer spending.
Businesses reduce output and hiring.
Prices stabilize.
Example: Raising taxes and reducing subsidies when inflation is too high.
Contractionary Fiscal Policy → Macroeconomics
Economic Growth: ↓ Govt spending & ↑ taxes → ↓ AD → slower GDP growth.
Employment: Lower demand → firms cut output → ↑ unemployment (short term).
Inflation: Helps reduce demand-pull inflation (stabilizes prices).
Balance of Payments: ↓ demand → ↓ imports → trade deficit may improve.
Income Distribution: If taxes rise (especially regressive ones like sales tax) → inequality may worsen.
Direct vs Indirect Taxes
Aspect | Direct Tax | Indirect Tax |
|---|---|---|
Definition | Taxes on income and wealth | Taxes on expenditure |
Examples | - Income tax | - Value Added Tax (VAT) |
Impact if High | If too high, reduces disposable income and can discourage working/investing | If too high, raises prices → burden on consumers → may cause inflation |
Who Pays More | The person or firm directly | Collected by firms but passed on to consumers (firms → government) |
Benefits | - Burden only on income/wealth | - Doesn’t directly reduce income |
Types of Taxes in Fiscal Policy
Tax Type | Definition | Direct / Indirect | Progressive / Regressive / Proportional |
|---|---|---|---|
Income Tax | Tax on wages, salaries, and investment income | Direct | Usually Progressive (higher earners pay a higher % of income) |
Sales Tax (VAT/GST) | Tax on goods/services at point of sale | Indirect | Regressive (poor spend larger share of income on taxed goods) |
Import Tax (Tariff) | Tax on imported goods | Indirect | Regressive (raises prices, affects all consumers equally regardless of income) |
Inheritance Tax | Tax on wealth passed on after death | Direct | Progressive (only wealth above a threshold is taxed more heavily) |
Corporation Tax | Tax on profits of firms | Direct | Often Proportional (flat % of profit), though can be Progressive in some countries |
Excise Duty | Tax on specific goods (alcohol, tobacco, fuel) | Indirect | Regressive (hits low-income groups harder since it’s per unit not based on income) |
Stamp Duty | Tax on legal documents (e.g., property purchase, shares) | Direct | Often Progressive (higher-value transactions taxed at higher rates) |
Customs Duty | Tax on goods when transported across borders | Indirect | Regressive (fixed % of goods, not income-based) |
Capital Gains Tax | Tax on profit from selling assets (e.g., property, shares) | Direct | Progressive (higher gains taxed at higher rates) |
Windfall Tax | Tax on unexpected or excess profits (e.g., oil companies during price surge) | Direct | Progressive (targets firms with abnormally high profits) |
Carbon Tax | Tax on emissions of carbon dioxide (pollution) | Indirect | Regressive (energy costs affect low-income households more) |
Tax Base
Definition: The total source of income, assets, or spending that can be taxed.
In simple words: who or what is taxed.
Examples:
Income of individuals
Profits of firms (corporation tax)
Goods and services (VAT, excise)
Property and wealth (inheritance tax, capital gains)
Wide tax base = many items/people taxed → allows lower tax rates.
Narrow tax base = few items/people taxed → government may need higher tax rates.
Tax Burden
Definition: The proportion of income, profits, or GDP taken in tax (who really pays).
In simple words: how heavy the tax feels on households or firms.
Examples:
If a person earns $1,000 and pays $200 in tax → 20% burden.
If government increases excise duty on petrol, the burden often falls more on consumers.
High tax burden = higher percentage of income/profits taken by government.
Low tax burden = smaller share taken.
MONETARY POLICY
Definition: Decisions on the money supply, the rate of interest and the exchange rate taken to influence aggregated demand
Money supply = total amount of money in the economy (coins, banknotes, deposits, central bank reserves).
Objectives of Monetary Policy
More stable price level (low inflation).
Adequate foreign exchange reserves (stable exchange rate).
Opportunity for full employment (reduce unemployment).
Sustainable economic growth.
Monetary Policy Measures
Open Market Operations (OMO)
Buying/selling government securities (bonds, treasury bills) to control liquidity.
Buy bonds → ↑ money supply.
Sell bonds → ↓ money supply.
Changes in Interest Rates
Main tool of monetary policy.
↑ Interest rate → borrowing more expensive, saving more attractive → ↓ spending/investment.
↓ Interest rate → borrowing cheaper, saving less attractive → ↑ spending/investment.
Changes in Foreign Exchange Rates
Exchange rate movements affect imports/exports.
Strong currency → imports cheaper, exports less competitive.
Weak currency → imports expensive, exports more competitive.
Reserve Requirement
% of deposits commercial banks must keep with the central bank.
Higher reserve requirement → ↓ lending → ↓ money supply.
Lower reserve requirement → ↑ lending → ↑ money supply.
Liquidity Requirement
Banks must keep some deposits as cash for withdrawals.
Higher requirement → ↓ lending capacity.
Lower requirement → ↑ lending capacity.
Types of Monetary PolicyExpansionary Monetary Policy
increase in the money supply and/or the rate of interest designed to increase aggregated demand
Aim: Boost economic activity.
Tools: Lower interest rates, lower reserve/liquidity requirements, buy bonds.
Effects:
Cheaper borrowing → more spending & investment.
Incomes rise → more demand → ↑ GDP.
Risk: inflation, trade deficit.
Contractionary Monetary Policy
cuts in the money supply or growth of the money supply and/or the rate of interest designed to reduce aggregated demand
Aim: Reduce inflation, control overspending.
Tools: Raise interest rates, increase reserve/liquidity requirements, sell bonds.
Effects:
Borrowing falls → ↓ spending & investment.
Slows inflation.
Risk: unemployment, slower growth.
Effects of Monetary Policy on Macroeconomic Aims
Macroeconomic Aim | Expansionary (Loose Policy) | Contractionary (Tight Policy) |
|---|---|---|
Economic Growth | - ↓ Interest rates → ↑ borrowing and investment | - ↑ Interest rates → ↓ borrowing and investment |
Employment | - ↑ Output → firms hire more workers | - ↓ Output → firms cut jobs |
Price Stability (Inflation) | - ↑ Spending → risk of demand-pull inflation | - ↓ Spending → reduces demand-pull inflation |
Balance of Payments (BOP) | - ↑ Imports due to higher demand | - ↓ Imports due to weaker demand |
Income Distribution | - More jobs → helps low-income groups | - Unemployment ↑ → poor affected most |
Limitations of Monetary Policy
Time lags: Policy takes months to affect the economy.
Confidence: If households/firms lack confidence, lower interest rates may not boost spending.
Foreign direct investment (FDI): Tight monetary policy can discourage investors.
Conflicts with other aims: e.g., reducing inflation may cause unemployment
2ND TERM MACROECONOMICS TOPICS
A. Supply-Side Policy
Definition:
Government measures aimed at increasing Aggregate Supply (AS) to improve efficiency, productivity, and potential output.
Supply-Side Measures:
Tax reductions (income/corporate tax) → incentives to work/invest
Education & training → higher labour productivity
Privatisation → efficiency from competition
Deregulation → reduced barriers for firms
Infrastructure spending → reduces costs for firms
Effects on Macro Aims:
Macro Aim | Supply-Side Policy Effect |
|---|---|
Economic growth | AS↑ → higher output |
Inflation | Lower production costs → inflation ↓ |
Unemployment | More jobs as economy expands |
Competitiveness | Exports become cheaper and more competitive |
B. Economic Growth and GDP
Definition of Economic Growth:
Increase in a country’s Real GDP (output adjusted for inflation).
an increase in the economy's potential to produce goods and services, shown by an outward shift of the Production possibility curve (ts igcse define)
Measurement:
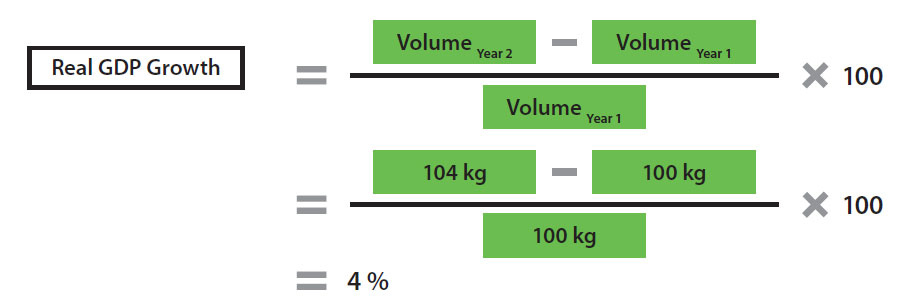
Growth Rate=Real GDP this year – last yearReal GDP last year×100Growth
Causes of Recession
Recession = two consecutive quarters of falling Real GDP.
Caused by a sustained fall in AD due to:
Reduced consumer spending
Lower investment
Higher interest rates
Fall in exports
Financial/banking crisis
Causes of Economic Growth
1. AD-side factors:
Higher consumer spending
Higher investment
Government spending ↑
Lower taxes / interest rates
2. AS-side factors:
Better education/training
Technological improvement
More capital investment
Increase in labour force
Improved infrastructure
Consequences of Economic Growth
Positive:
Higher living standards (GDP per capita ↑)
Lower unemployment
Higher government revenue
Better infrastructure and services
Negative:
Inflationary pressure (demand-pull)
Environmental damage
Resource depletion
Income inequality may widen
Policies to Promote Growth
Supply-side policies (long-term growth)
Expansionary fiscal policy (G↑, taxes↓)
Expansionary monetary policy (interest rates↓)
C. Employment and Unemployment
Key Definitions:
Employment: Using FoP (especially labour) to produce goods/services
Unemployment: Willing and able to work BUT cannot find a job
Full Employment: Only natural unemployment remains
(Frictional + Structural)
Measurement of Unemployment
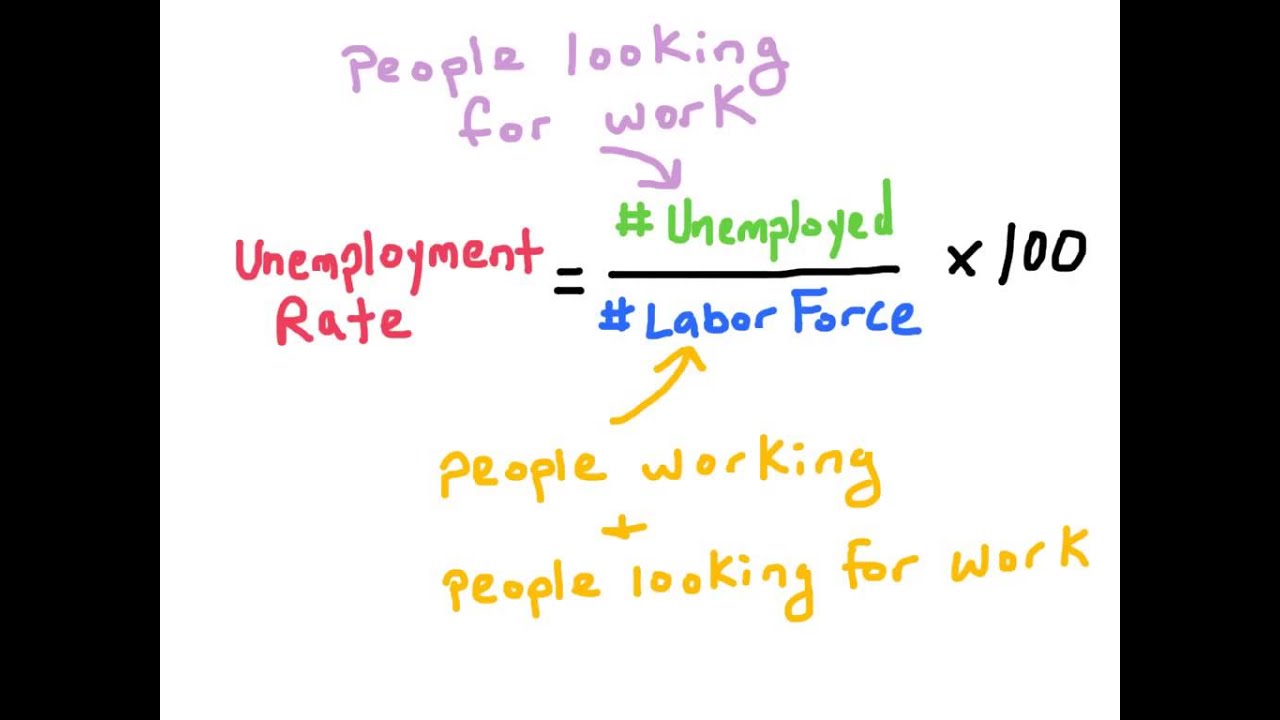
Unemployment Rate=Number of UnemployedLabour Force×100
Types & Causes of Unemployment
Type | Explanation |
|---|---|
Cyclical / Demand-Deficient | Caused by low AD during recession |
Structural | Skills mismatch or industry decline |
Frictional | Temporary (between jobs) |
Seasonal | Jobs available only certain seasons |
Technological | Automation replaces labour |
Consequences of Unemployment
Lost output (operating inside PPC)
Lower income & living standards
Reduced tax revenue
Higher government welfare spending
Social problems (crime, stress, poverty)
Policies to Reduce Unemployment:
For Cyclical Unemployment:
Expansionary fiscal policy
Expansionary monetary policy
For Structural/Frictional Unemployment:
Education & training
Job search programs
Subsidies for firms hiring workers
Mobility assistance
D. Inflation and Deflation
Inflation:
Definition: A sustained increase in the general price level of goods and services in an economy over a period of time.
Deflation:
Definition: A sustained decrease in the general price level of goods and services.
Measurement: CPI (Consumer Price Index)
Uses a basket of goods
Weighted according to importance
Calculates % change in price level
Causes of Inflation
1. Demand-Pull Inflation:
AD ↑ faster than AS.
2. Cost-Push Inflation:
Rising costs (wages, materials, taxes) shift AS left.
Causes of Deflation
Sharp fall in AD
Deep recession
Excess capacity/output
Consequences
Inflation:
Purchasing power of money falls
Rise in production costs
Uncertainty → lower investment
Exports become less competitive
Deflation:
Consumers delay spending
Profits fall → layoffs
Unemployment rises
Risk of prolonged recession
Policies to Control Inflation
Contractionary Monetary: ↑ interest rates
Contractionary Fiscal: ↓ government spending, ↑ taxes
Supply-side policies to reduce production costs
Policies to Control Deflation
Expansionary Monetary: ↓ interest rates
Expansionary Fiscal: ↑ gov spending / ↓ taxes
Incentives for firms and consumers to boost AD
CALCULATIONS:
1) Inflation rate (CPI-based)
What: % change in the Consumer Price Index (CPI).
Formula:
Inflation rate=CPI ts year - cpi last year/cpi last year x100
Example 1 (simple): CPI last year = 120, CPI this year = 126.
Step-by-step:
Subtract: 126 − 120 = 6.
Divide: 6 ÷ 120 = 0.05.
Multiply by 100: 0.05 × 100 = 5.0%.
Answer: Inflation = 5.0%.
Example 2 (percent points): CPI 2019 = 98.4, CPI 2020 = 102.6.
102.6 − 98.4 = 4.2.
4.2 ÷ 98.4 = 0.042682926... → round to 0.04268.
0.04268 × 100 = 4.268% → 4.27%

2) GDP growth rate (real)
Formula:
Gdp gr = real gdp ts year- real gdp last year/real gdp last year x100
Example: Real GDP last year = 1,250,000; this year = 1,312,500.
1,312,500 − 1,250,000 = 62,500.
62,500 ÷ 1,250,000 = 0.05.
0.05 × 100 = 5.0% growth.
3) Unemployment rate
Formula:
Unemployment rate=Number of unemployed/Labour force
Example: Employed = 1,080,000; Unemployed = 120,000.
Labour force = 1,080,000 + 120,000 = 1,200,000.
120,000 ÷ 1,200,000 = 0.1.
0.1 × 100 = 10.0%.
4) GDP per capita
Formula: GDP per capita= real gdp/population
Example: GDP = 500,000,000; population = 25,000,000.
500,000,000 ÷ 25,000,000 = 20.
Answer: GDP per capita = 20 (currency units per person).
1. Living Standards
What are Living Standards?
Living standards refer to the level of wealth, comfort, material goods, and necessities available to people in a country.
Higher living standards usually mean people have:
Higher incomes
Better healthcare
Better education
Better housing
Access to clean water and technology
Example
Germany has high living standards because people have good healthcare, education, and high incomes.
Niger has lower living standards due to poverty and limited services.
Indicators of Living Standards
Governments and economists use indicators to measure living standards.
The two most common indicators are:
Real GDP per head
Human Development Index (HDI)
Real GDP per Head
Definition
Real GDP per head is:
The average income per person in a country adjusted for inflation.
Formula:
GDP ÷ Population = GDP per head
“Real” means inflation has been removed.
Components of GDP
GDP measures the value of total output in a country. (lowk g ush)
GDP =
C + I + G + (X − M)
Where:
C = Consumption
I = Investment
G = Government spending
X = Exports
M = Imports
Advantages of Real GDP per Head
Easy to measure
Allows comparison between countries
Shows economic growth
Shows average income
Example
If GDP per head rises from $8,000 to $10,000, living standards may have improved.
Disadvantages of Real GDP per Head
Does not show income inequality
Does not include informal economy
Does not measure quality of life
Does not include environmental damage
Example
Two countries may have the same GDP per head, but one may have more poverty.
Human Development Index (HDI)
Definition
HDI measures quality of life and development, not just income.
HDI ranges from 0 to 1.
Higher number = higher development.
Components of HDI
Education
Average years of schooling
Expected years of schooling
Health
Life expectancy
Example
Country | Life Expectancy | Education | Income | HDI |
|---|---|---|---|---|
Norway | High | High | High | Very high |
Ethiopia | Low | Lower | Low | Low |
Advantages of HDI
Measures quality of life
Includes education and health
More accurate indicator of development
Better for comparing development
Disadvantages of HDI
Does not measure income inequality
Ignores environmental damage
Limited number of indicators
Can hide regional differences
Comparing Living Standards and Income Distribution
Income Distribution
Income distribution refers to:
How income is shared among people in a country.
Some countries have:
Equal distribution
Unequal distribution
2. Poverty
Absolute Poverty
Definition:
When people cannot afford basic necessities such as food, water, shelter, and clothing.
Example:
People living on less than about $2.15 per day.
Relative Poverty
Definition:
When people have significantly lower income compared to others in the same country.
Example:
Someone may have housing but still be poor compared to average citizens.
Causes of Poverty
Unemployment
Low education
Low wages
Poor health
Natural disasters
Economic decline
Rapid population growth
Example
If factories close, workers may lose jobs and fall into poverty.
Policies to Reduce Poverty
1. Progressive Taxation
Higher-income people pay higher tax rates.
Example
Rich people pay 30% tax, poor people pay 10%.
2. Welfare Benefits
Government provides:
unemployment benefits
housing benefits
pensions
3. Minimum Wage
Government sets a legal minimum wage.
Example
Workers must be paid at least $10 per hour.
4. Investment in Education
Better education increases skills and employment opportunities.
5. Job Creation
Governments create jobs through:
infrastructure projects
business support
1. Living Standards
Definition of Living Standards
Living standards refer to the quality and quantity of goods and services available to people and how these goods and services are distributed among the population.
Living standards depend on several factors including:
Income levels
Employment
Access to healthcare
Access to education
Housing quality
Availability of goods and services
Environmental conditions
A country with higher living standards usually has better healthcare systems, higher wages, better education, and more access to goods and services.
Example
People in highly developed economies usually have:
access to modern hospitals
advanced education systems
better infrastructure
higher disposable income
Measuring Living Standards
Economists use different indicators to measure living standards. The two most important indicators are:
Real GDP per head
Human Development Index (HDI)
Real GDP per Head
Definition
Real GDP per head measures the average income or output per person in a country after adjusting for inflation.
Formula:
GDP ÷ Population
GDP represents the total value of goods and services produced in a country in one year.
Real GDP removes the effect of inflation so it reflects actual changes in output and income.
Advantages of GDP per Head
Easy to measure and calculate
Allows comparison between countries
Shows whether an economy is growing
Indicates the average level of income
Example
If a country's GDP per head increases from $5,000 to $8,000, it suggests that the economy has grown and people may have higher incomes.
Limitations of GDP per Head
GDP per head has several weaknesses as a measure of living standards.
1. Income Inequality
GDP per head only shows average income, but income may be unevenly distributed.
Example:
A country may have high GDP per head but most income may be owned by a small group of wealthy individuals.
2. Informal Economy
GDP often excludes informal or underground economic activity such as small unregistered businesses.
This means real economic activity may be higher than recorded.
3. Working Conditions
GDP per head does not consider:
working hours
working conditions
job satisfaction
Some countries may produce high output but workers may work extremely long hours.
4. Environmental Impact
GDP ignores environmental damage such as:
pollution
deforestation
climate change
Economic growth could occur while environmental quality decreases.
5. Currency Differences
Comparing GDP per head across countries can be difficult because countries measure output in different currencies.
Human Development Index (HDI)
Definition
The Human Development Index is a composite indicator used to measure economic development and quality of life.
HDI ranges from 0 to 1, where:
0 = no development
1 = full development
Components of HDI
HDI measures three key dimensions of development.
1. Health
Measured using life expectancy at birth.
Higher life expectancy indicates:
better healthcare
better nutrition
better living conditions
2. Education
Measured using:
mean years of schooling
expected years of schooling
Education improves skills and productivity.
3. Income
Measured using Gross National Income (GNI) per capita.
Higher income allows people to purchase more goods and services.
HDI Categories
HDI Value | Development Level |
|---|---|
0.800 – 1.000 | Very high development |
0.700 – 0.799 | High development |
0.550 – 0.699 | Medium development |
Below 0.549 | Low development |
Comparing Living Standards Between Countries
Differences in living standards occur because of:
Income Distribution
Income is not evenly distributed in many countries.
Some individuals may earn very high incomes while others earn very little.
Informal Economy
Some developing countries have large informal sectors which are not included in official GDP statistics.
Quality of Goods and Services
Countries differ in the quality of:
healthcare
education
public services
infrastructure
Working Conditions
Some countries have:
longer working hours
poorer working conditions
Environmental Conditions
Pollution and environmental damage can reduce quality of life.
Reasons for Income Differences
Income differences between individuals occur because:
some inherit wealth
some own businesses
some have higher-paying jobs
some have better education and skills
some work harder or longer hours
2. Poverty and Inequality
Definition of Poverty
Poverty occurs when people lack sufficient income or wealth to maintain a basic standard of living.
Poverty creates many economic and social problems including:
malnutrition
poor health
higher crime rates
unemployment
lower productivity
lower national output
Governments aim to reduce poverty as a key macroeconomic objective.
Types of Poverty
Absolute Poverty
Absolute poverty occurs when a person’s income is too low to meet basic needs such as food, shelter, and clothing.
The World Bank defines the international poverty line at around $1.90 per day.
People living below this level struggle to survive.
Relative Poverty
Relative poverty occurs when individuals earn much less than the average income in their society.
Even if basic needs are met, individuals may still be considered poor relative to others.
Poverty Line
The poverty line is the minimum level of income required to maintain an adequate standard of living.
Different countries may have different poverty lines depending on their living costs.
Causes of Poverty
Several factors can cause poverty.
Unemployment
People without jobs have no regular income.
Low-Paid Work
Some workers earn wages that are too low to support basic living standards.
Illness
Poor health may prevent people from working and earning income.
you sick af so you cant work means you get no money
Old Age
Elderly individuals may not have sufficient pensions or savings.
Lack of Education
Low education levels limit employment opportunities.
Vicious Circle of Poverty
The vicious circle of poverty occurs when poverty continues from one generation to the next.
Example cycle:
Low income
→ Poor education
→ Low skills
→ Low productivity
→ Low wages
→ Low income again
This cycle makes it difficult for individuals to escape poverty.
Government Policies to Reduce Poverty
Governments can reduce poverty through several policies.
Improving Education
Better education improves skills and increases employment opportunities.
Promoting Economic Growth
Economic growth increases business activity and job creation.
Minimum Wage
Setting a legal minimum wage increases income for low-paid workers.
Encouraging Multinational Companies
Foreign investment creates jobs and raises incomes.
Welfare Benefits
Governments may provide financial support such as:
unemployment benefits
pensions
housing support
Redistribution of Income
Governments can redistribute income using:
progressive taxation
welfare payments
free healthcare
free education
labour market policies
macroeconomic policies
3. Population
Definition
Population refers to the total number of people living in a particular area during a specific time period.
Population size changes due to:
Birth rate
Death rate
Net migration
Factor | Definition | Causes / Reasons | Example | Effect on Poverty & Economy |
|---|---|---|---|---|
Birth Rate | The number of babies born per 1,000 people in a year. | Cultural traditions, lack of contraception, low education (especially for women), need for workers in agriculture, high infant mortality. | Niger has one of the highest birth rates in the world. | High birth rates can increase population quickly, putting pressure on jobs, schools, healthcare, and resources, which may increase poverty. |
Death Rate | The number of deaths per 1,000 people in a year. | Healthcare quality, nutrition, disease, sanitation, wars, natural disasters. | Countries with strong healthcare systems like Japan have lower death rates. | High death rates may indicate poor healthcare and living conditions. Lower death rates often improve living standards and reduce poverty. |
Migration | Movement of people from one place to another to live or work. Includes immigration (entering a country) and emigration (leaving a country). | Job opportunities, higher wages, better education, safety from conflict, better living standards. | Many workers move from developing countries to richer countries for jobs. | Migration can reduce poverty if workers send money home (remittances), but emigration may cause brain drain in poorer countries. |
Population Pyramid
A population pyramid shows:
age distribution
gender distribution
life expectancy
number of dependents
Young dependents: under 15
Elderly dependents: 65 and above
Population Problems
Developing Countries
Rapid population growth can cause:
unemployment
overcrowding
food shortages
disease spread
environmental pressure
Developed Countries
Low population growth may cause:
ageing population
labour shortages
higher pension costs
higher healthcare spending
Optimum Population
Optimum population refers to the population size that allows maximum output per person given the available resources.
If population is too large → overpopulation
If population is too small → underutilization of resources
4. Differences in Economic Development Between Countries
Nature of Economic Development
Definition
Economic development is:
The process of improving the quality of human lives and capabilities by increasing people’s living standards, self-esteem, and freedom.
Development is broader than economic growth.
Economic growth = increase in output (GDP)
Economic development = improvement in:
living standards
health
education
economic opportunities
Conditions Needed for Development
For development to occur, countries usually need:
1. Improved Resources
An increase in the quantity and quality of resources such as:
labour
capital
natural resources
Better resources increase production capacity.
2. Investment
Higher investment in:
infrastructure
technology
businesses
Investment increases production and economic growth.
3. Better Education, Training, and Healthcare
Improving human capital helps increase:
productivity
income
life expectancy
economic opportunities
Classification of Countries by Development
International organizations classify countries according to their level of development.
IMF and United Nations Classification
Countries are classified as:
Category | Description |
|---|---|
Least Developed Countries (LDCs) | Very low income and poor development |
Developing Countries | Middle level of development |
Developed Countries | High income and high living standards |
This classification considers:
poverty levels
human resource weakness
economic vulnerability
World Bank Classification (Based on GNI per Capita)
Countries are grouped by income levels.
Category | GNI per capita |
|---|---|
Low Income Countries (LICs) | $975 or less |
Lower Middle Income | $976 – $3,855 |
Upper Middle Income | $3,856 – $11,906 |
High Income Countries (HICs) | $11,907 or more |
GNI per capita measures average income per person in a country.
Classification Using HDI
Countries can also be classified using the Human Development Index.
HDI Level | Score |
|---|---|
Very High Development | 0.800 – 1.000 |
High Development | 0.700 – 0.799 |
Medium Development | 0.550 – 0.699 |
Low Development | Below 0.549 |
HDI measures:
life expectancy
education
income
Causes of Differences in Economic Development
Countries develop at different rates due to several factors.
1. Income Distribution
Some countries have greater equality in income distribution while others have high inequality.
Two perspectives exist:
Perspective 1
Income inequality encourages people to:
work harder
invest savings
This may stimulate economic growth.
Perspective 2
More equal income distribution can improve development because:
more people can afford education
consumption increases
poverty decreases
Research suggests countries with decreasing inequality grow faster.
2. Productivity Levels
Productivity measures:
The amount of output produced from a given amount of inputs.
Higher productivity means:
more goods and services produced
higher incomes
faster economic growth
Countries with advanced technology and skilled workers usually have higher productivity.
3. Population Growth
Population growth can have positive or negative effects on development.
Positive Effects
If a country has:
a growing working-age population
enough resources
It can increase economic growth.
Negative Effects
Rapid population growth can cause:
pressure on food supply
unemployment
overcrowding
pressure on healthcare and education
4. Structure of the Economy
The structure of economic sectors shows development levels.
Economies usually develop through stages:
Primary Sector
Agriculture and raw materials.
Example:
farming
fishing
mining
Developing countries rely heavily on this sector.
Secondary Sector
Manufacturing and industry.
Example:
factories
construction
Industrialization increases economic development.
Tertiary Sector
Services.
Example:
banking
tourism
insurance
education
Developed countries usually have large service sectors.
5. Savings and Investment
Savings provide funds for investment in businesses and infrastructure.
Higher savings → higher investment → economic growth.
If people have very low income, they cannot save much, which limits investment.
6. Education and Healthcare
Education improves:
skills
productivity
innovation
Healthcare improves:
life expectancy
labour productivity
Countries with strong education systems tend to develop faster.
Problems Faced by Developing Countries
Developing countries often face several economic challenges.
1. Rapid Population Growth
High birth rates can lead to:
pressure on food supply
higher education costs
fewer resources for investment
2. High International Debt
Many developing countries borrowed large amounts of money.
They must spend a large part of their income on repaying debt.
This reduces money available for development.
3. Reliance on Primary Products
Developing countries often export raw materials such as:
coffee
cocoa
minerals
Primary goods have low value added, meaning countries earn less from exports.
4. Lack of Investment in Human Capital
Human capital includes:
education
training
skills
Low investment slows technological progress and productivity.
5. Emigration of Skilled Workers (Brain Drain)
Skilled workers may leave developing countries to work in richer countries.
This reduces the skilled labour force in developing economies.
6. Trade Restrictions
Developing countries may face barriers such as:
tariffs
quotas
subsidies in rich countries
These make it harder for developing countries to sell their products internationally.
1. Import Substitution
Import substitution involves protecting domestic industries from foreign competition.
The government may use:
tariffs
quotas
subsidies
The aim is to encourage domestic production instead of imports.
Advantages
increases domestic production
creates jobs
improves trade balance
Risks
higher prices
reduced consumer choice
domestic industries may become inefficient
2. Attracting Multinational Companies (MNCs)
Multinational companies invest in developing countries.
Benefits include:
job creation
higher wages
worker training
technology transfer
improved infrastructure such as roads and ports
Goodluck gng