Week 7 Pre-work Digital Fundamentals: Introduction to Simulink Notes
Digital Fundamentals Introduction to Simulink
Overview
Simulink is a model-based programming environment within the MATLAB package.
The lecture covers using the Simulink environment and simulating simple systems.
Future lectures will cover interfacing with hardware and using Stateflow.
Simulink
MATLAB allows scripting and GUI development.
Simulink is a model-based programming environment.
Model-based programming is used in Electrical, Mechanical, Mechatronic, and Automotive Engineering for simulating and modeling complex feedback systems.
To launch Simulink, type
simulinkin the MATLAB Command Window or click the Simulink button.
Simulink Interface
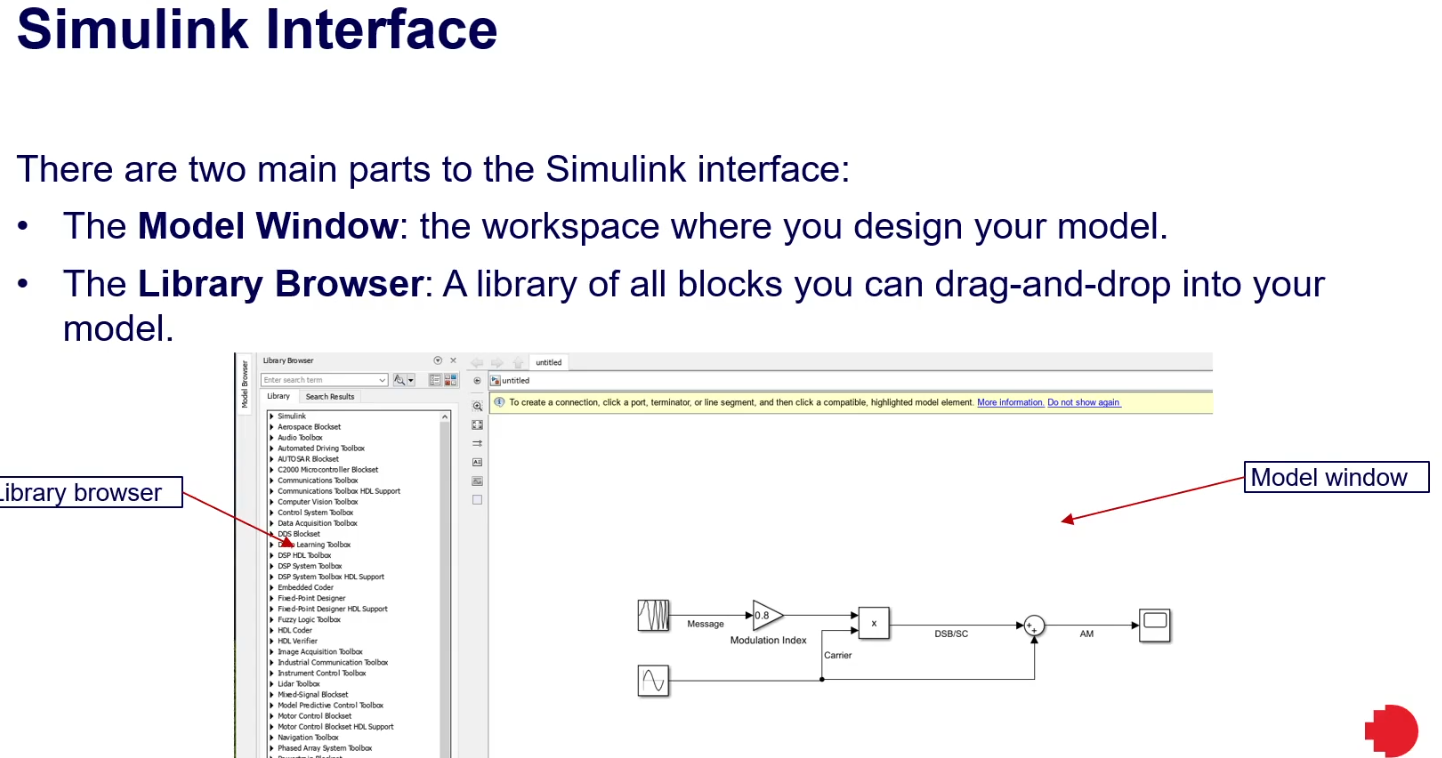
The Simulink interface consists of two main parts:
Model Window: the workspace for designing the model.
Library Browser: A library of blocks that can be dragged and dropped into the model.
The Library Browser
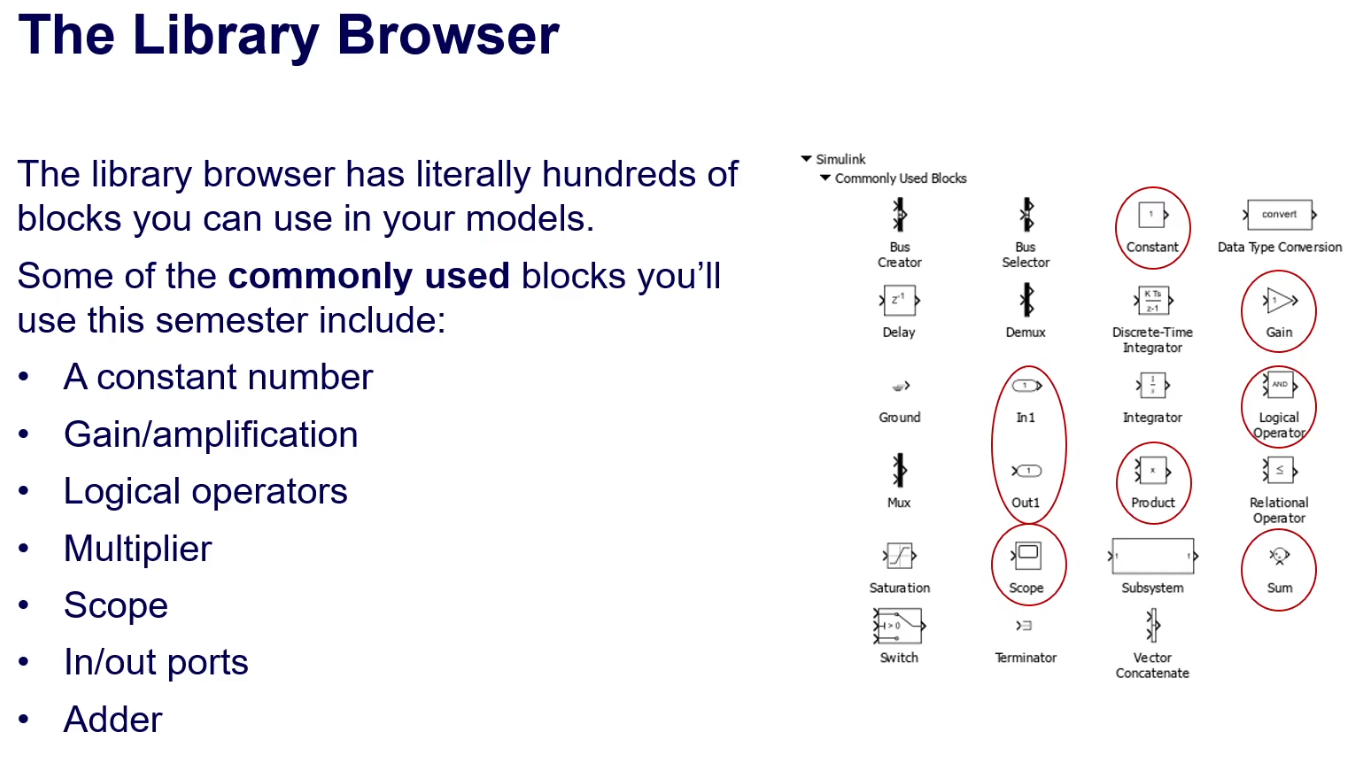
The library browser has hundreds of blocks.
Commonly used blocks:
Constant number
Gain/amplification
Logical operators
Multiplier
Scope
In/out ports
Adder
The Library Browser – Sinks and Sources
lines are called signal paths - try to alwasy label teh signal paths
Sinks (outputs):
Scopes/graphs
Displays
Sources (inputs):
Signals (sines, noise, ramps, pulses)
Connecting Blocks in Simulink
Blocks are dragged and dropped into the model.
Connect blocks by clicking the output port of one block and dragging a line to the input port of another.
This creates a signal path.
Signal paths can be branched by right-clicking a signal path and dragging to the input of another block.
Labelling Signal Paths
Labeling signal paths helps trace signals and troubleshoot models, like commenting code in MATLAB.
Block Parameters
Double-click a block to bring up its block parameters.
Sine wave block parameters:
Amplitude
Bias (DC offset)
Frequency (rad/sec)
Phase offset (radians)
Sample time (discrete/continuous)
Model Configuration Parameters
Accessed via
Prepare -> Model Settings.Allows changing simulation start time, stop time, and time-increment configuration.
Contains configuration properties for the hardware board (e.g., board selection and communication).
Simulating a Model
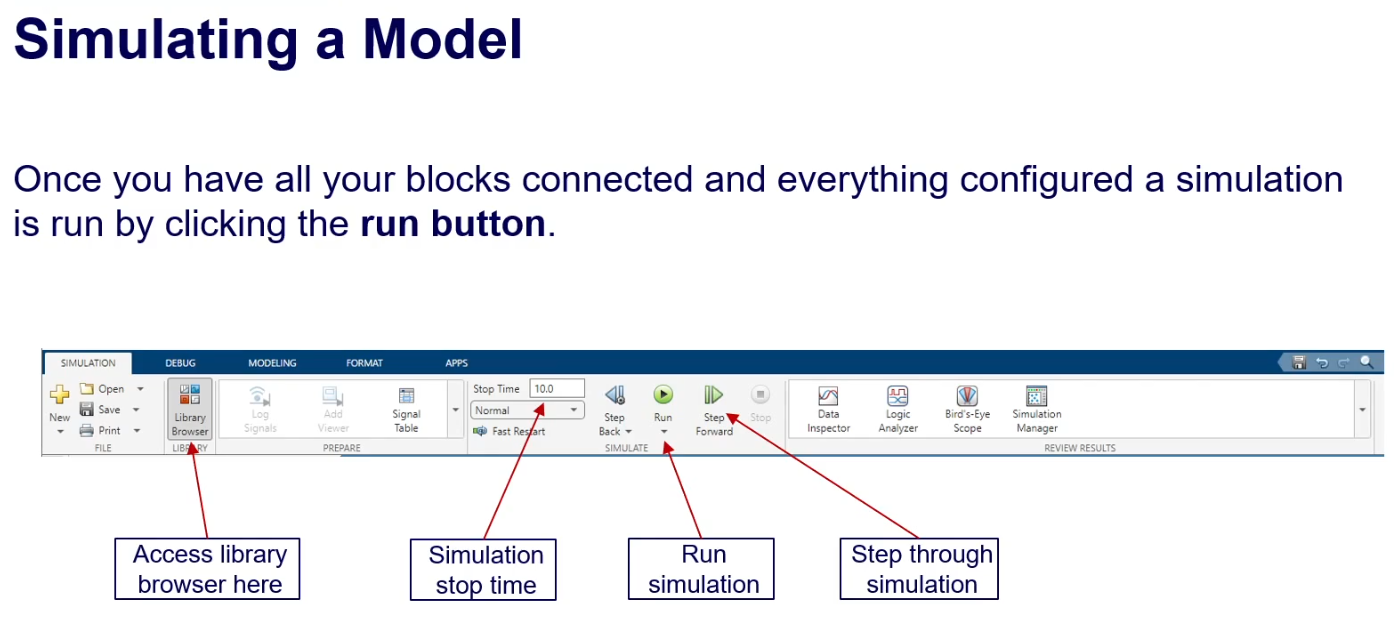
Click the run button to start the simulation.
Simulink uses a time-series approach, considering system behavior with respect to time.
Simulink is not suitable for processing data unrelated to time.
Data Visualisation in Simulink
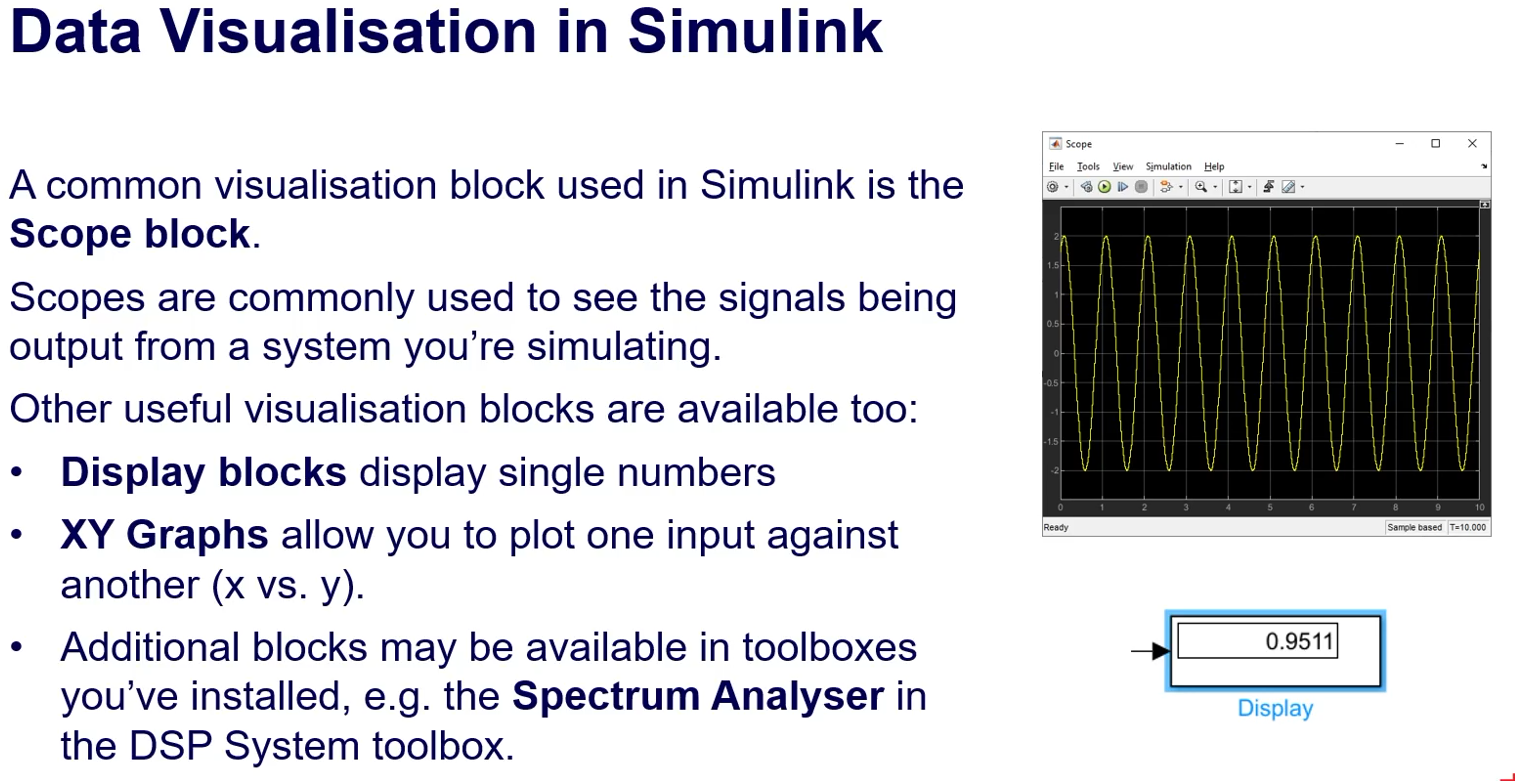
Scope block: used to visualize signals.
Other visualization blocks:
Display blocks: display single numbers.
XY Graphs: plot one input against another (x vs. y).
Spectrum Analyzer (in DSP System toolbox).
Example 1: Generating Basic Signals in Simulink
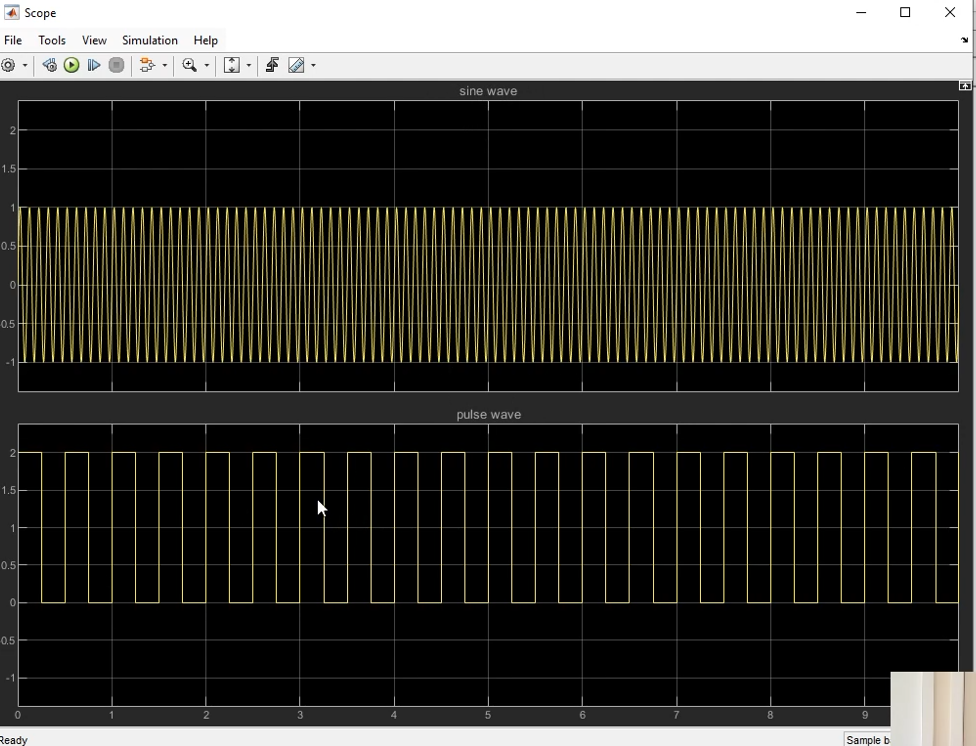
Use a Sine Wave block to generate the signal:
Use a Scope block to display the sine wave on port 1.
Use a Pulse Generator block to generate the signal:
Where 50% is the Pulse Width in the block parameters.
Display the output of this pulse generator on port 2 of the scope.
Logical and Bitwise Operations in Simulink
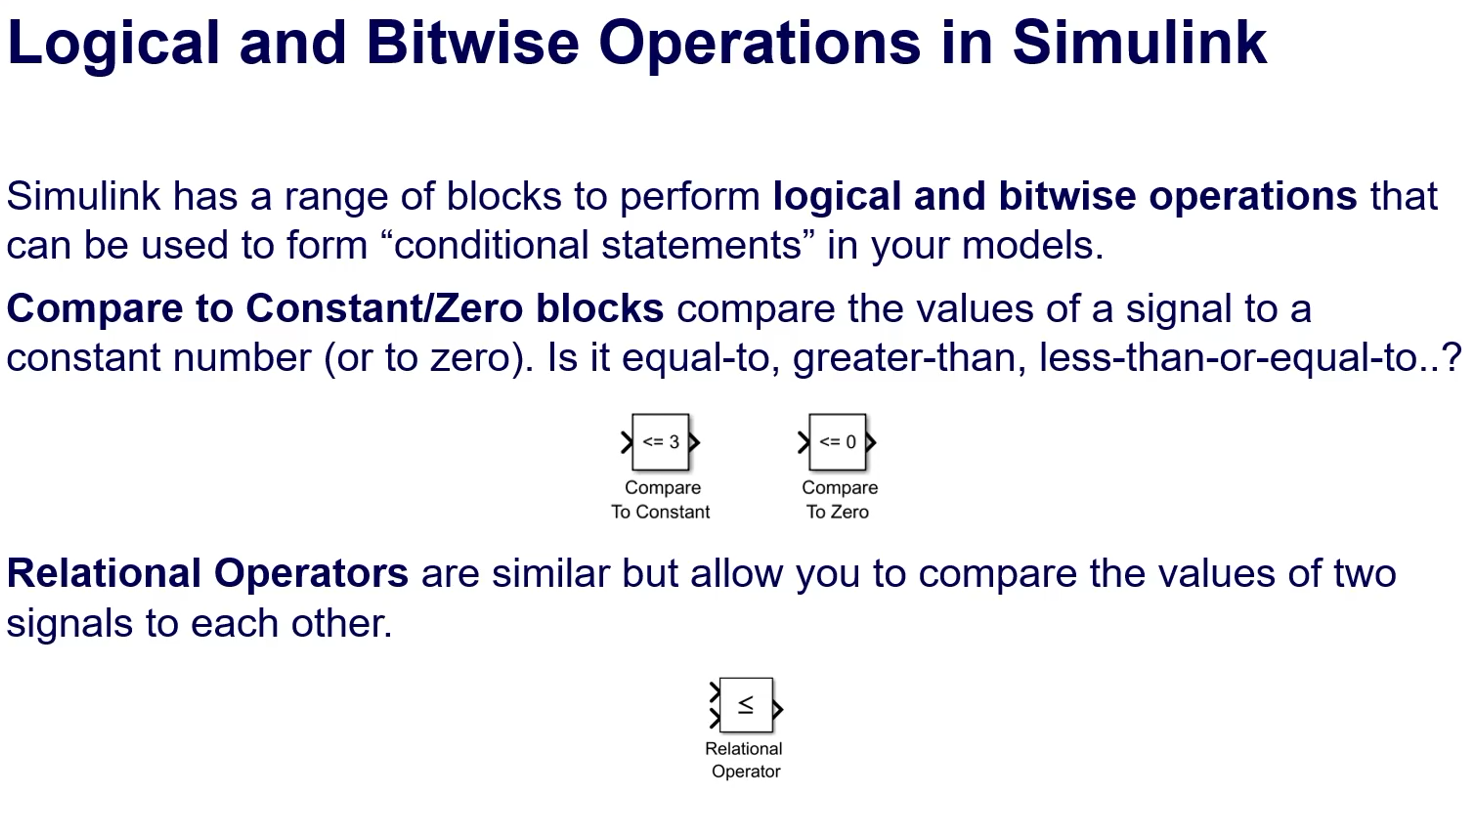
Simulink has blocks for logical and bitwise operations for “conditional statements”.
Compare to Constant/Zero blocks: compare signal values to a constant number (or zero).
Relational Operators: compare the values of two signals.
Conditional Statements in Simulink
Switch blocks are like if-else statements.
Decision-making is performed on time-series data.
The output from the switch can change continuously as the input signal(s) vary with time.
Switch block inputs:
Top input: routed to output when the expression is TRUE.
Centre input: signal being compared.
Bottom input: routed to output when the expression is FALSE.
Logical expression: default is
data > 0.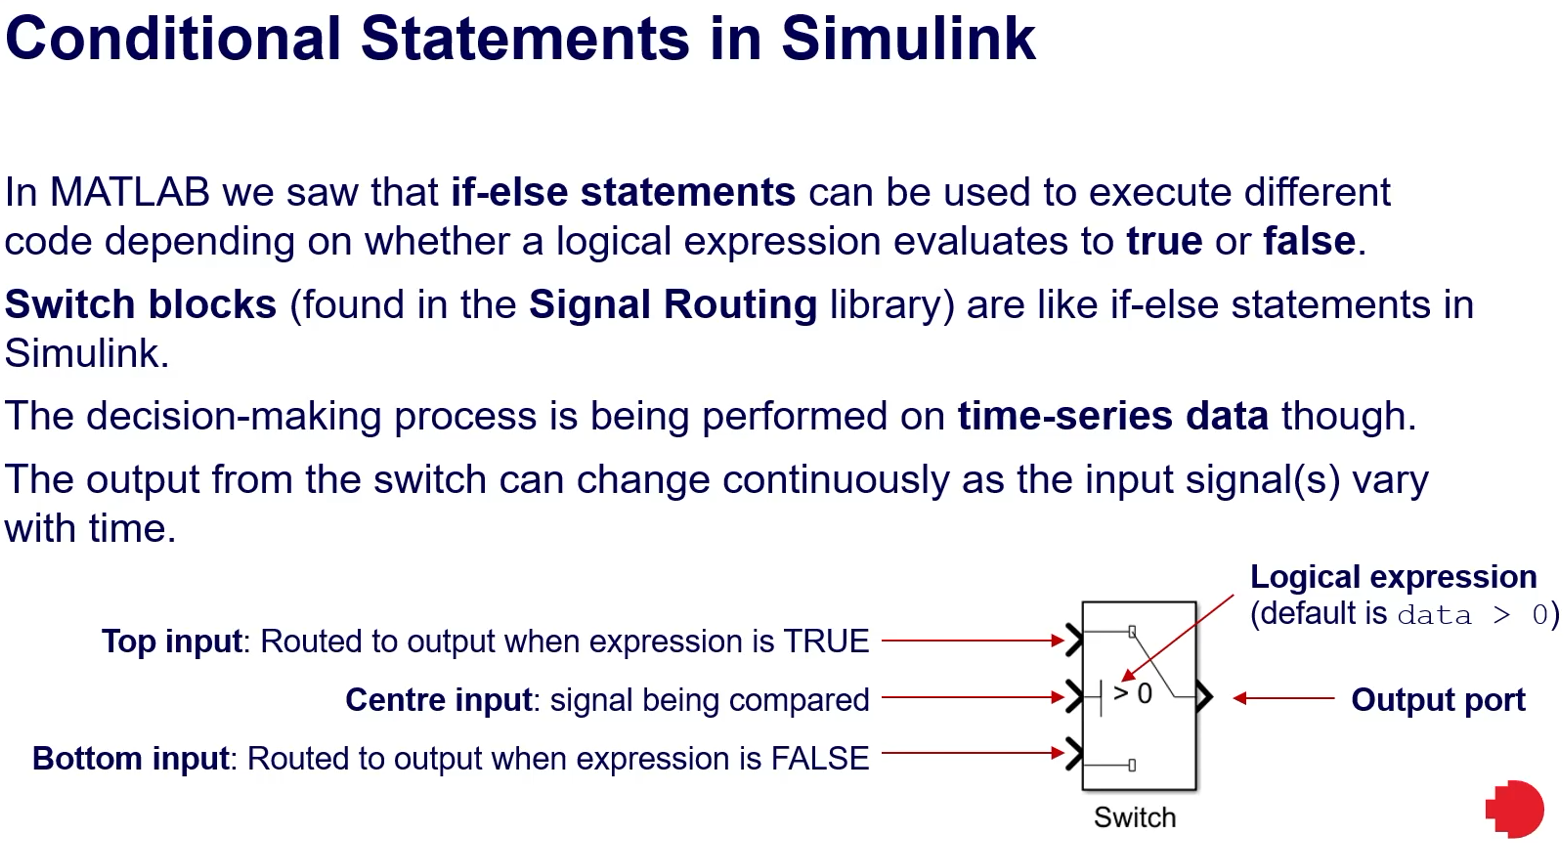
Example 2a & 2b: A Clipper Using a Switch Block
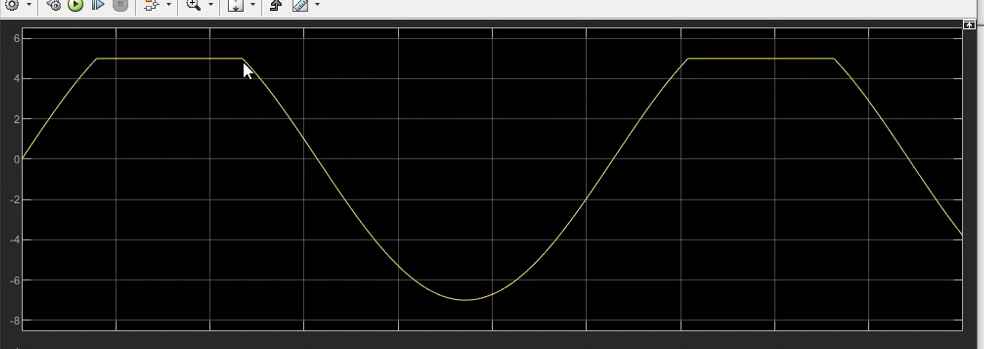
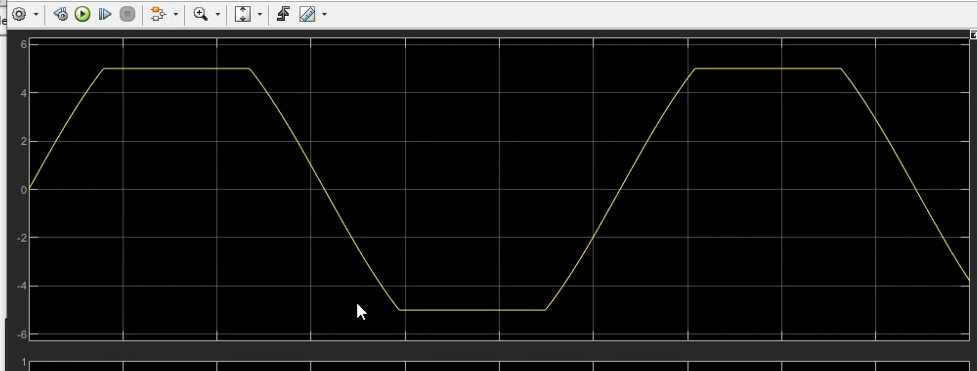
Replicate the MATLAB Grader practice question results (shown in the bottom image).
Modify the previous Simulink model to now perform clipping for both the positive and negative parts of the sine wave (threshold = 5 Volts).
Need more thought as the switch block has very limited conditions:
u2 >= threshold
u2 > threshold, and
u2 ~= 0
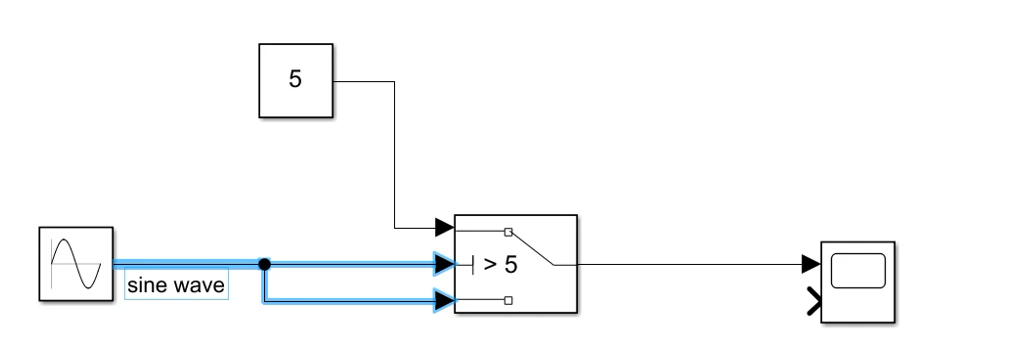
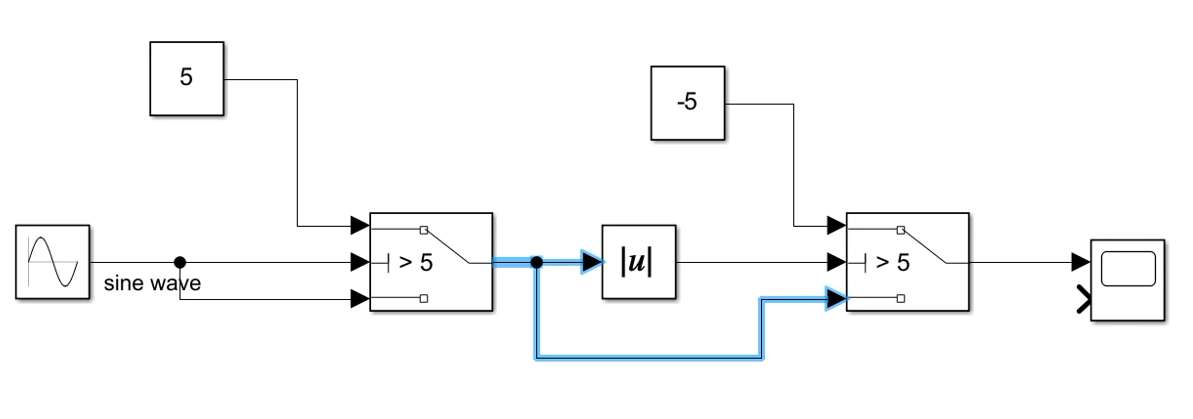
How to check for u2 < -5?
This example will ultimately replicate the MATLAB Grader practice question from week 3: Arrays in formulas and relational addressing.
Signal clipping is a form of distortion that cuts off the amplitude of a signal once it exceeds a specific level.
Create a Simulink model with a Sine Wave block that generates the signal values for the top figure for a time-range of 0 to 10 seconds.
The sinusoidal function is given by the formula:
Use a Switch block to model the clipping (bottom figure) at +5 Volts.
Simulink Dashboard Components
Include realistic-looking elements for an easy user-interface.
Gauges, buttons, switches, or different colored lamps.
Accessed in the Library Browser.
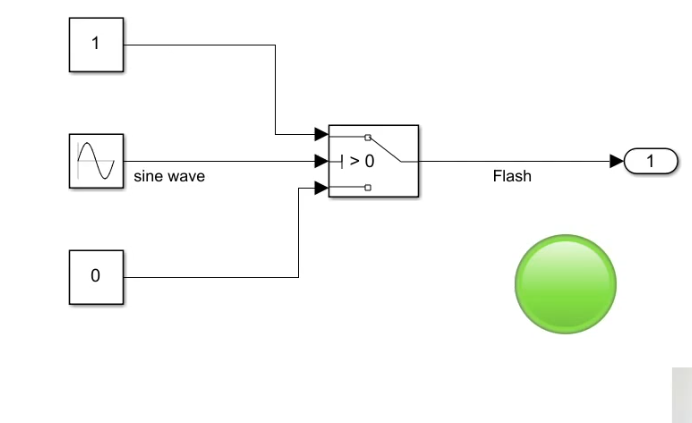
Dashboard Components - Lamps
Useful for showing and verifying system behavior.
To connect a Lamp:
Drag in a Lamp block.
Hover until the chain symbol appears, then click it.
Click on the signal path to monitor and select the radio button for that signal.
Click on the chain symbol again to complete the connection.
Dashboard Components – Switches and Sliders
Used to get user input. not like led that follows a signal path they interact with the blocks with the users
Connected similarly to Lamps:
Drag in a switch/slider (e.g., a Toggle Switch).
Hover until the chain symbol appears and click it.
Click on the block to control (e.g., a Constant) and select the radio button.
Click the chain symbol again to complete the connection.
Configure switches by double-clicking to set on/off values.
Configure sliders by double-clicking to set the minimum value, maximum value, and increment.
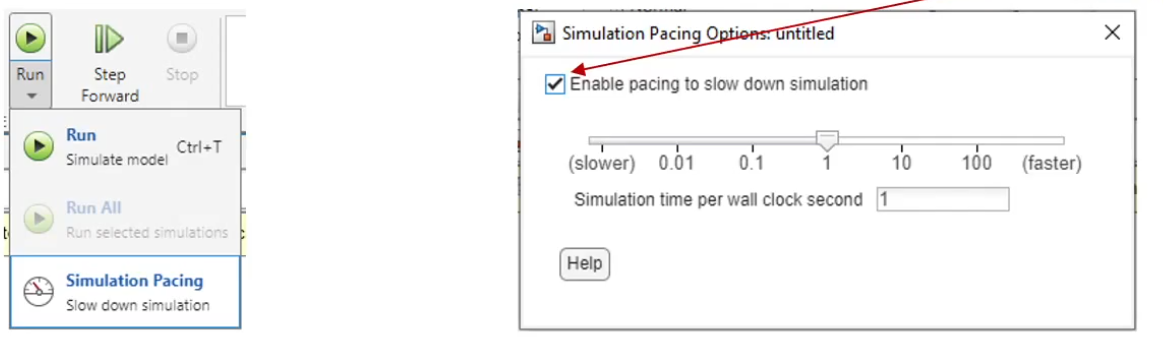
Simulation Pacing
Simulations run at the computer's default clock-speed (fast).
Simulation Pacing is used to run a Simulink model in real-time (1 simulation second = 1 real-life second).
Allows speeding up or slowing down the execution of the model.
Pacing options can be accessed via the Run menu. then there is a menu written similuation pacing
Simulation Duration
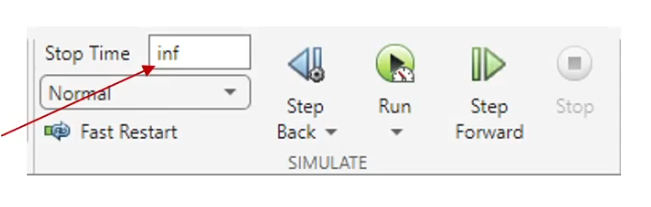
Simulink automatically sets the default Stop Time to 10.0.
Can be changed in the Model Settings menu with the step-size.
Set to ‘inf’ to continue indefinitely until manually stopped.
Example: Dashboard Components
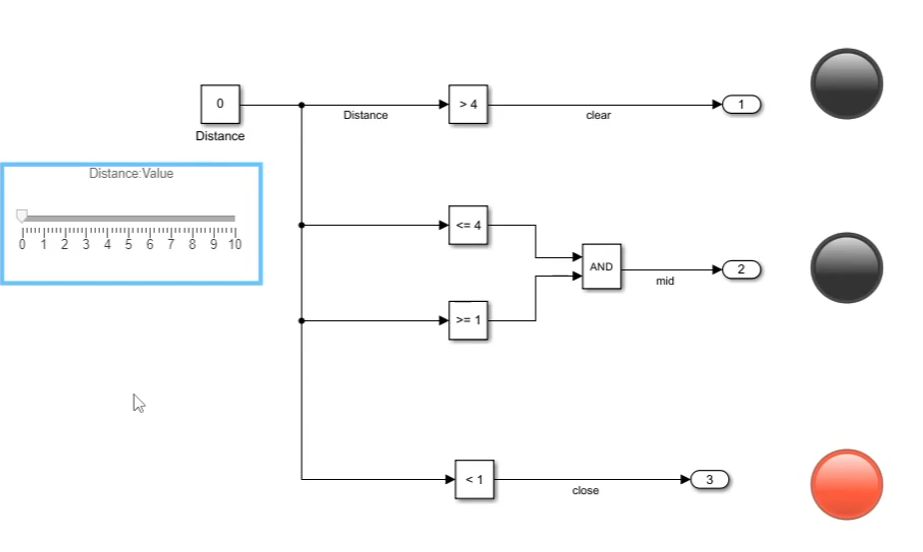
Create a Simulink model with Dashboard components that:
Allows the user to input a distance using a Slider dashboard block.
Lights up a green lamp when the distance is greater than 4 meters.
Lights up a yellow lamp when the distance is between 1 and 4 meters (inclusive).
Lights up a red lamp when the distance is less than 1 meter.
Runs continuously and in real-time (1 simulation second = 1 real-life second).
Finally
Introduction to Simulink basics.
Creating simple models to perform basic operations on signals.
Decision-making in Simulink for signal manipulation.
Dashboard blocks for realistic interfaces.
Next week: Boolean logic and logic blocks in Simulink for discrete logic operations.