Week 2: Quantitative Research Methods
Module Introduction
Key considerations for designing high-quality quantitative studies.
Understanding what to look for when evaluating published research.
Builds upon Module 1's focus on selecting appropriate research designs.
Focuses on methodological decisions after the study design is chosen.
Covers operationalising variables, choosing the right measurement tools, experimental manipulations, selecting the right sample, and understanding internal and external validity.
Operationalising Variables
Psychology often studies constructs rather than concrete, observable phenomena.
Construct (Conceptual Variable):
A theoretical concept or idea describing an abstract phenomenon.
Cannot be directly observed or measured (e.g., intelligence, motivation, stress).
Abstract and open to interpretation.
Operational Variable:
A specific, measurable representation of a construct in a study.
Defines how the construct will be observed, measured, or manipulated.
Turns abstract concepts into tangible, quantifiable forms.
Conceptual vs. Operational Variables
The process of defining how a construct will be measured or manipulated is called operationalization.
Choosing the Right Measures
Applicable to both experimental and non-experimental quantitative studies.
Measurement: Assigning numbers to represent constructs.
Focus: Key considerations for choosing high-quality measurement methods.
Choose the Type of Observation
Three primary ways to operationalise constructs:
Self-report measures.
Behavioural measures.
Physiological measures.
Self-Report
Participants provide information about themselves through questionnaires, interviews, or surveys.
Includes reports on feelings, thoughts, attitudes, behaviours, or experiences.
Example: Reporting hours slept and rating sleep quality.
Advantages:
Direct access to an individual's thoughts, feelings, and perceptions.
Measures things that cannot be directly observed.
Cheap and easy to administer to large groups.
Disadvantages:
Influenced by social desirability bias, memory errors, or lack of self-awareness.
Behavioural Observations
Directly observing and recording aspects of an individual's behaviour in a natural or controlled setting.
Can be done by researchers or through automated methods like video recording.
Example: Measuring sleep by observing eye movement and body movement.
Advantages:
More objective than self-report; not impacted by self-report bias or memory errors.
Example: Actual sleep duration vs. perceived sleep duration.
Disadvantages:
Observer bias or subjective interpretations can influence accuracy.
Reactivity: People might change their behaviour if they know they are being observed.
Can be time-consuming and costly.
Physiological Measures
Recording biological data from participants like heart rate, hormone levels, brain activity, and skin conductance.
Example: Measuring sleep by recording brain waves, heart rate, respiration rate, eye movements, and muscle tension.
Advantages:
Data is objective; does not rely on subjective judgments (but interpretation may be).
Offers a direct link to physiological processes underlying psychological states.
Disadvantages:
Can be expensive and complex, requiring specialized equipment and expertise.
The relationship between physiological signals and psychological states can be complex and hard to interpret.
Some methods can be invasive or uncomfortable, potentially changing behaviour.
Example: Electrodes altering sleep patterns.
Choose the Scale of Measurement
Determines the type of statistical analyses that can be used.
Categorical Data (Nominal Data)
Assigning numbers to represent different discrete categories defined by specific characteristics.
Categories do not have a specific order.
Examples: Student status (yes/no), nationality.
Ordinal Data
Categories with a specific order or ranking.
Intervals between categories are not necessarily equal or known.
Examples: Grades (HD, D, C, P, F), satisfaction ratings (1-5).
Inherently discrete but sometimes treated as continuous for analytical convenience, especially with Likert scales.
Continuous Data
Data that can take any value within a given range, with intervals between numbers always being the same distance.
Not restricted to specific, discrete categories.
Example: Age (can be 20.3, 20.7, etc.)
Interval Data
Continuous data that does not have a true, meaningful zero.
A meaningful zero indicates the absence of the variable.
Example: Temperature (0 degrees Celsius does not represent the absence of temperature).
Ratio Data
Continuous data with a true, meaningful zero.
Examples: Distance from a confederate (0 cm = absence of distance), exercise frequency (0 times = absence of exercise).
Measurement Validity
Refers to the degree to which the measurement tool accurately measures the construct it is intended to.
Crucial because psychological research often measures abstract constructs.
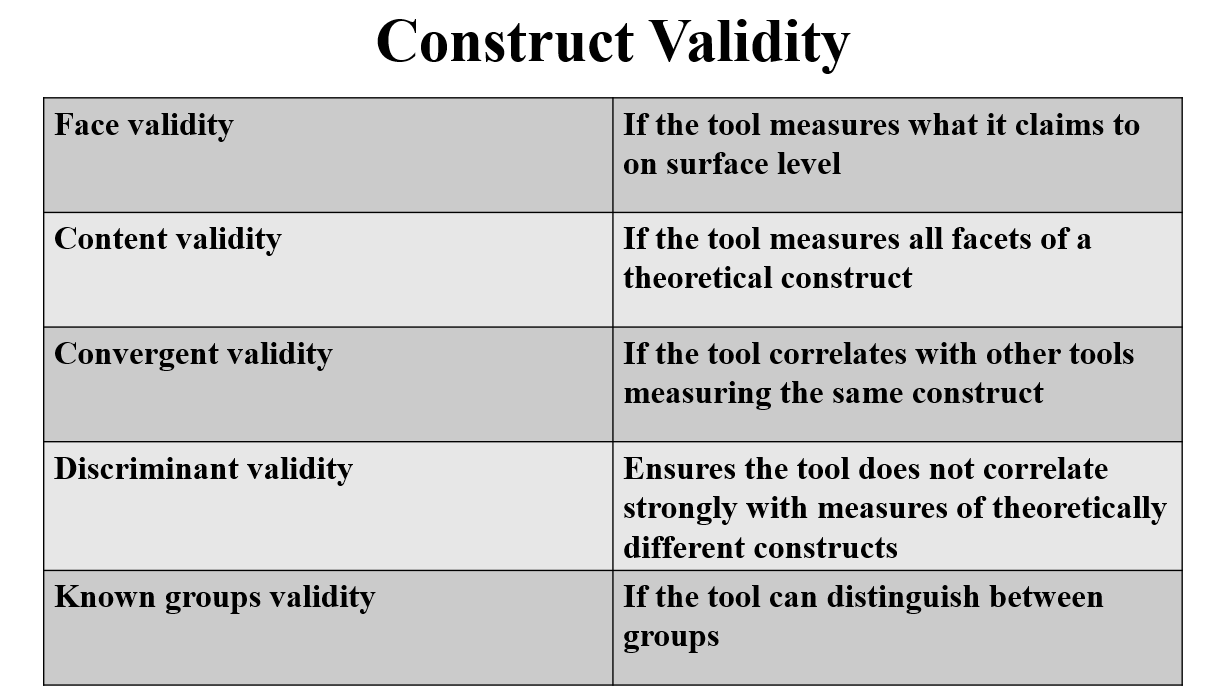
Construct Validity
The extent to which we are confident that a measurement tool actually measures the construct it claims to measure.
Face Validity
Whether the tool appears to measure what it is supposed to on the surface.
Evaluation: Apply logic to assess whether the tool's characteristics subjectively appear related to the construct.
Example: Questionnaire items for depression should relate to depression symptoms.
Content Validity
The extent to which a measure represents all facets of a given construct.
Assesses whether a test or tool covers the entire range of behaviours, skills, or qualities defined by the theoretical concept it is intended to measure.
Evaluation: Expert and end-user judgment.
Experts review to ensure coverage of the full range of the concept.
End-users evaluate whether the tool reflects their real-world experiences.
Example: A depression measure should assess mood, motivation, cognition, behaviour, etc.
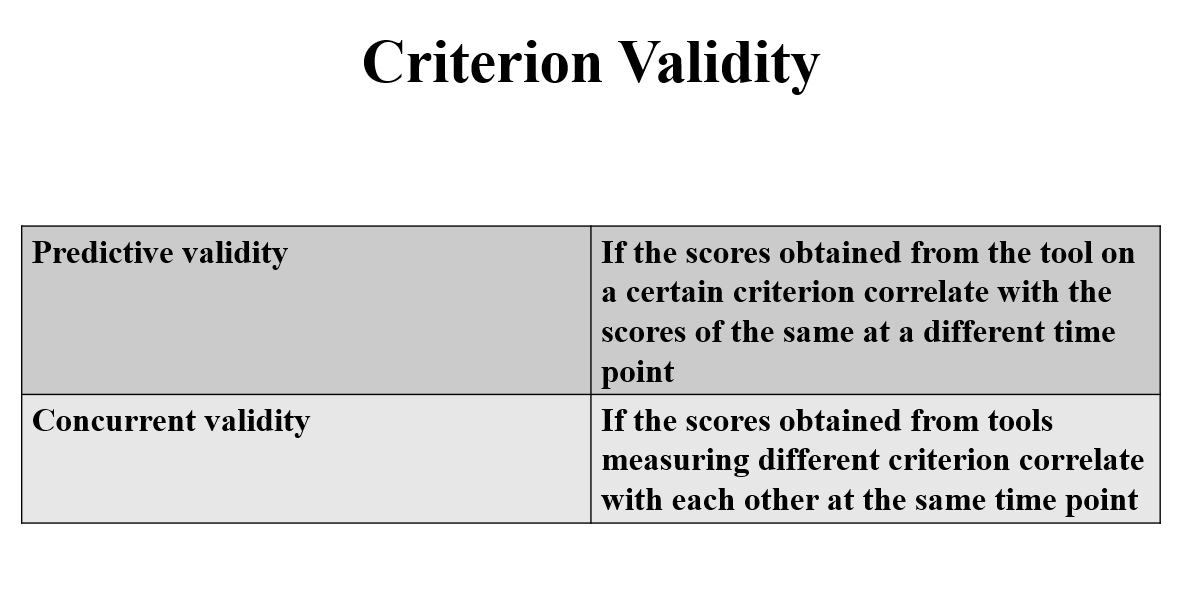
Criterion Validity
If the scale accurately measures the construct it claims to measure, it should correlate with factors known to be related to that construct (criteria or criterion variables).
Convergent Validity
Whether the tool correlates with other measures of the same construct.
Evaluation: Testing whether scores on the measurement tool correlate with scores from a different measure of the same construct.
Example: A self-report measure of depression symptoms should highly correlate with other measures of depression symptoms.
Discriminant Validity (Divergent Validity)
The degree to which a measure does not correlate too strongly with measures of other constructs that are theoretically different.
Evaluation: Testing whether scores on the measurement tool correlate with scores from an unrelated construct.
If the scores don’t correlate, or at least don’t correlate too highly, this provides evidence that the measures are assessing different constructs.
Known-Groups Validity
Whether a measurement tool can distinguish between groups that it is theoretically expected to distinguish between.
Evaluation: Administering the measurement tool to different groups of people who are expected to score differently on the construct, and then testing if they produce significantly different scores.
Example: A measure of depression symptoms should produce significantly higher scores for individuals with a diagnosis of Major Depressive Disorder compared to a group of participants with no history of depression.
Concurrent Validity
The extent to which scores on the measurement tool correlate with scores on a criterion, when both are measured at the same time.
Evaluation: Participants would complete both the measurement tool we are interested in and another measure of a criterion variable during the same time period. We would then test if their scores on each measure are correlated.
Example: Participants might complete a measure of depression symptoms and then complete a measure of suicidal ideation during the same testing session.
Predictive Validity
The extent to which scores on the measurement tool correlate with scores on a criterion, when the criterion is measured at some point in the future.
Evaluation: Participants would complete the measurement tool we are interested in at one time point, and then we would gather data about the criterion at a later time. We would then test if their scores on each are correlated.
Example: Participants might complete a measure of depression symptoms during one testing session and then complete a measure of suicidal ideation six months later.
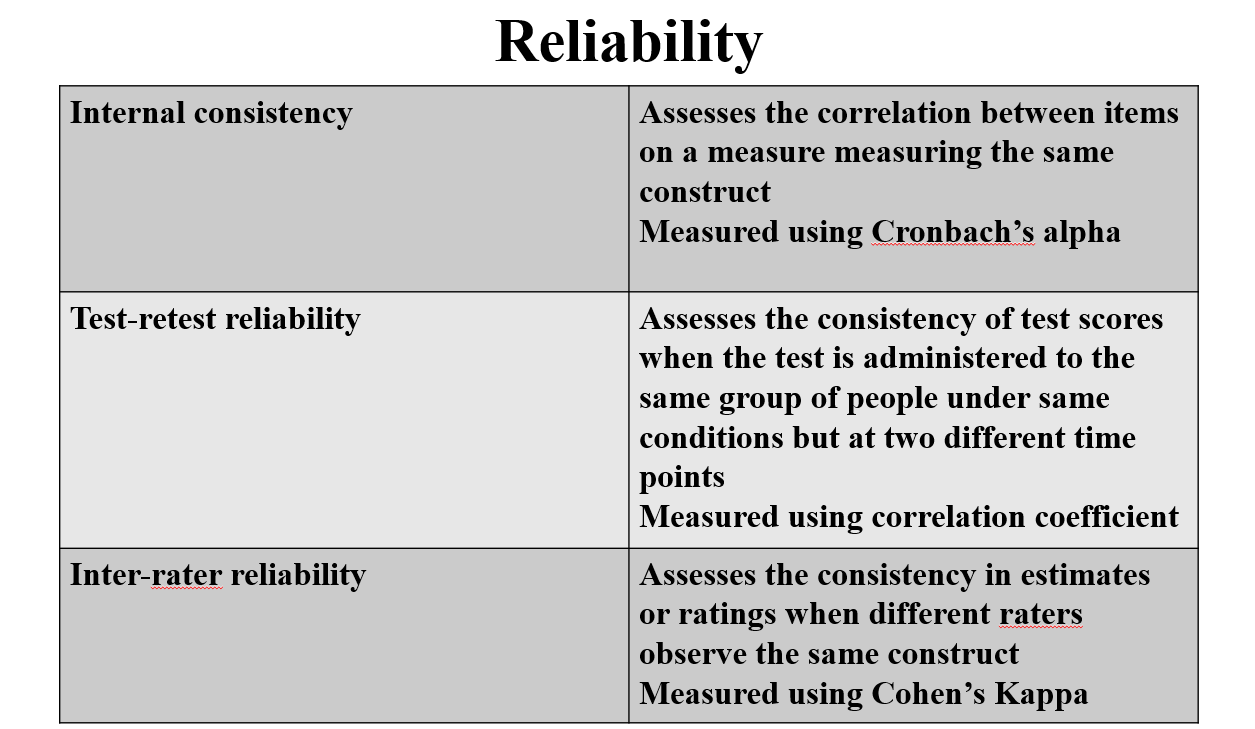
Measurement Reliability
Refers to the consistency of a measurement tool.
Internal Consistency
Assesses the extent to which all the items on a measure consistently measure the same construct.
Relevant only for measurement tools with multiple items.
Evaluation: Statistics that calculate correlations between the items on the measure show how well the items correlate with each other.
Cronbach’s alpha
A single value that represents the degree to which all of the items on the scale are intercorrelated.
Values close to 0 indicate the items are not correlated and values close to 1 indicate strong correlation.
Most common measure of internal consistency.
Cronbach (1951) recommended that Cronbach’s \alpha > .70 be regarded as acceptable
However, this guideline has been criticised as arbitrary (e.g., Taber, 2018).
Tavakol and Dennick (2011) suggest that if alpha is too high (e.g., in the high 90s), this could indicate that items are too similar and therefore redundant.
McDonald’s omega
Measures the degree to which items on a test are intercorrelated using a different statistical model.
More accurate when certain assumptions are not met (i.e., when items are not normally distributed, have different variances, etc.).
Interpreted the same way as Cronbach’s α.
Becoming increasingly popular.
Item-Rest Correlations
Correlations between each individual item and the total of all other items on the measure.
Helps identify inconsistent items for potential adaptation or removal.
Kuder-Richardson Formulas 20 and 21 (KR20 and KR21)
Measure the internal consistency of a scale with binary responses (e.g., Yes/No).
Test-Retest Reliability
Refers to the consistency of a measure over time.
Assesses the extent to which test scores remain consistent when the same test is administered to the same group of people under the same conditions, but at two different points in time.
Relevant for constructs that are predicted to be stable over time (e.g., personality traits).
Evaluation: The same measurement tool is administered to the same group of people at two different points in time. We then calculate the correlation between the two sets of scores. A high correlation indicates high test-retest reliability.
Interrater Reliability
Refers to the extent to which different raters or observers provide consistent estimates or ratings when assessing the same phenomenon or behaviour.
Only relevant when a measurement tool is administered or scored by more than one person.
Evaluation: Often tested using Cohen's Kappa, which represents the degree of agreement among multiple raters' ratings. Values closer to 1 indicate higher interrater reliability (1 = perfect agreement).
The Relationship between Validity and Reliability
Some measurement tools are neither valid nor reliable (Target A): These tools produce inconsistent scores that do not accurately measure the intended construct.
Measurement tools can be reliable but not valid (Target B): The tool produces consistent scores, but those scores do not accurately reflect the construct being measured.
For a measurement tool to be valid, it must also be reliable (Target C): A valid measure consistently yields results that accurately reflect the intended construct.
Reliability is necessary, but not sufficient, for validity.
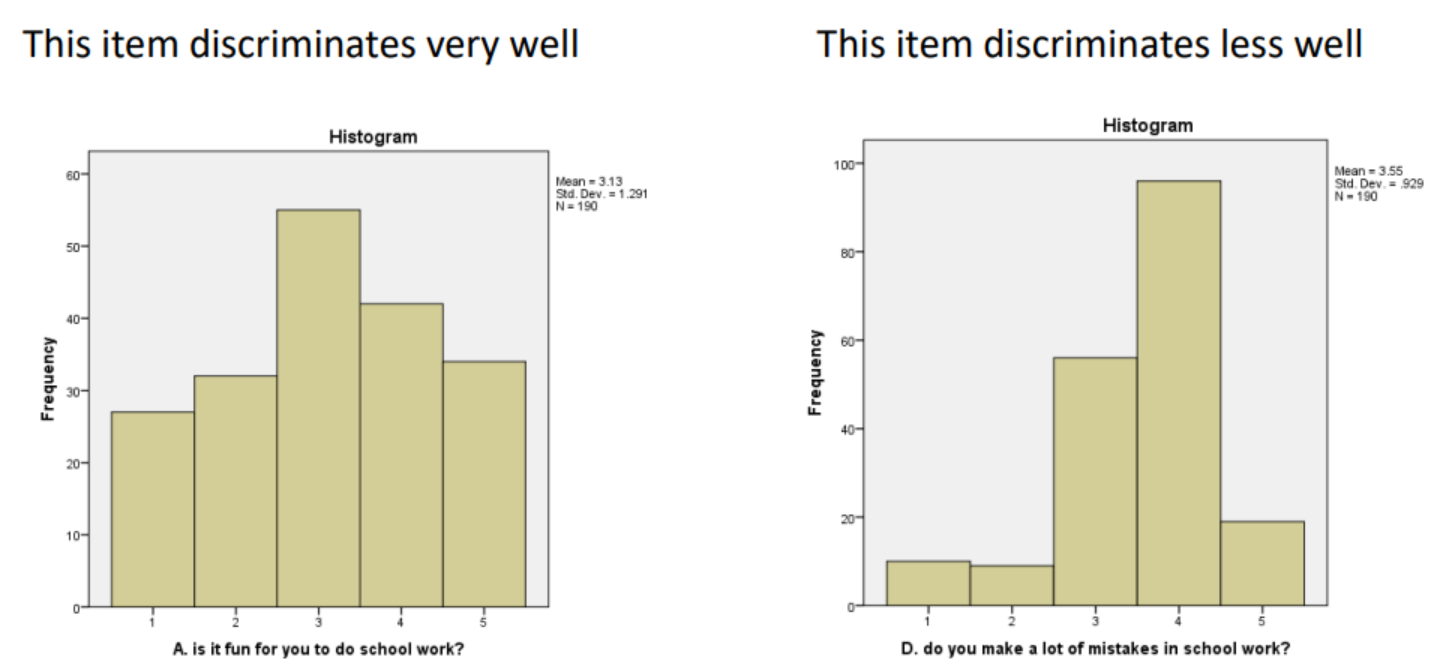
Measurement Sensitivity
Refers to the ability of a measurement tool to discriminate (i.e., differentiate) between individuals who vary on a construct.
Evaluation:
administer the test to people known to vary on the construct and testing whether they (a) score within the expected range and (b) show significant differences between groups that are theoretically different in the construct.
by examining the variability of scores. If we observe a well-spread distribution of scores across the possible range, this suggests good sensitivity. In contrast, if most participants score similarly and the range of scores is narrow, this indicates lower sensitivity
Choosing the Right Experimental Manipulation
Manipulation of an independent variable is the defining feature of experimental research.
Experimental manipulation: Actively and systematically changing conditions to determine if this causes changes in dependent variables.
Construct Validity
Experimental manipulations must have strong construct validity, meaning they must actually manipulate the variable they are intended to.
Strength of the Manipulation
The manipulation needs to be strong enough to influence participants' behaviour.
If too weak, it may not produce the desired effect, making it difficult to detect any changes in behaviour.
Reliability
A valid, effective manipulation should cause the same effect each time it is used.
Evaluating Manipulations
Pilot Testing
Small studies run before the main study. Useful for testing construct validity and effectiveness.
Test if the experimental manipulation causes changes in relevant criteria.
Test if participants perceive the manipulation as relevant to the construct.
Conduct a primary test of the strength of the experimental manipulation
Comparing the results of a study to the results of an initial pilot study can also provide some evidence about the reliability of the experimental manipulation's effects.
Manipulation Checks
Measurements included in your study to verify that the manipulation is influencing the variable it was intended to manipulate.
Evaluate Face Validity
Determine how well the manipulation aligns with the theoretical definition of the construct.
Replication
Re-running the study with a new sample to verify that any effects found the first time were not an artefact of chance.
Exact replications
Repeating the study exactly as it was run the first time, but with a new group of people.
Conceptual replications
Conducting another study to test the same hypotheses as the first, but may change some aspects of the methods (e.g., measuring the same dependent variable but in a different way).
Replication and extension
Repeat the study using the same methodology as the original study, but add additional elements to extend it in some way (e.g., adding additional dependent variables to see if the results generalise to other outcomes).
How to Choose an Experimental Manipulation
Define Construct
Know it exactly what you intend to manipulate.
Review the Literature
Examine previous studies to identify what (if any) types of manipulations have been used in the past and if these were effective
Select or Design
Select an already existing manipulation. If one is not available, they may adapt an existing one by changing it to make it appropriate for their study. If neither of these options are possible, they will need to design your own manipulation based on the definition of the construct.
Evaluate
Evaluate the validity and strength of the experimental manipulation, either with piloting testing or by evaluating within the context of the study itself.
Replicate
Conduct a study and replicate the results to examine the reliability of manipulation's effects.
Choosing the Right Sample and Sample Size
Populations Vs Samples
Population: The entire group from whom the research conclusions are intended to be drawn.
Sample: The specific group of people who participate in the study.
Selecting the Right Population
Researchers need to carefully consider who the relevant population for their study is. That is, who is the study aiming to learn about? This should be determined by the research question.
General population research
The general population refers to a broad, inclusive group with a wide range of characteristics, without any specific restrictions.
Specific population research
Research may aim to understand risk factors for poor mental health in refugees. In this case, the population of interest must be clearly defined, and inclusion and exclusion criteria should be established to identify participants who are or are not part of the population.
Sample Representativeness
Refers to the degree to which a subset of individuals, items, or data points selected for analysis accurately reflects the larger population from which it is drawn.
When its characteristics closely mirror those of the population under study.
How to Recruit a Representative Sample
Probability sampling
Sampling techniques where each member of the population has a known chance of being selected.
Simple Random Sampling
Everyone in the population has an equal chance of being selected.
Systematic Sampling
The first person selected from a population is random, but from then on, selection follows a systematic rule (e.g., every 10th person is selected).
Stratified Sampling
The population is divided into subgroups (e.g., age groups), and then participants are randomly chosen from each group.
Cluster Sampling
The population is divided into groups, and then we randomly choose one or more of those groups and sample everyone in it.
Non-Probability Sampling
Sampling techniques where not everyone in the population has a chance of being chosen, and selection is not random.
Convenience Sampling
Participants are selected based on ease of access/availability.
Quota Sampling
The researcher decides beforehand how many people of certain characteristics they need to match the population (e.g., 40% from rural locations, 60% from urban).
Purposive Sampling
Participants are selected based on specific characteristics/criteria (e.g., only people working in hospitality and who have experienced food insecurity).
Snowball or Referral Sampling
Existing participants recruit future participants by passing on information about the study.
How to Evaluate Sample Representativeness
Sample Size
The size of the sample can affect its representativeness, because a larger sample has a broader range of people in it, and larger samples generally provide more reliable estimates of population parameters. However, this alone is not sufficient to ensure a representative sample.
Demographic Characteristics
Evaluate if the sample's demographic characteristics reflect the characteristics of the population. These may include age, gender, ethnicity, socioeconomic status, education level, geographic location, etc.
A representative sample should have similar distributions of these characteristics as the population.
Sample Size
What is statistical power?
Refers to the probability that a statistical test will correctly reject the null hypothesis when it is false.
Stroud et al., 2008 correlation between stress and depression (example)
A study with high statistical power has a better chance of detecting true effects.
A study with high statistical power is also likely to produce more precise effect estimates, which are, in turn, more likely to replicate in future studies because the study will have less error.
Statistical Errors
Type I error
A Type I error occurs when you find a significant effect, but itʼs a false positive (i.e., the effect does not exist in the real world).
Type II error
You have made a Type II error (retaining the null hypothesis/concluding there is no significant effect, even though one really exists).
How much power do you need?
Cumming (2012) recommends a statistical power of at least .80 — this means an 80% chance of detecting a true effect (or a 20% chance of making a Type II error).
If they make a Type I error, they will conclude the drug works even though it actually doesn’t. They may market the drug to patients with Type II diabetes, who at best will receive no benefit from it, and at worst may experience medical complications if they take this new drug instead of other drugs that really do work.
If they make a Type II error, they may conclude the drug does not work even though it really does. If this is the case, the drug will not be manufactured and made available to people who could benefit from it.
Sample size and power
Sample size directly affects statistical power.
Larger sample sizes increase statistical power because they provide more information and reduce random variability (error) in the data.
Other factors that influence power
Effect size
The magnitude of the difference or relationship between variables in the population. Larger effect sizes are easier to detect, leading to higher power.
Significance level (alpha)
The threshold set to determine statistical significance, typically denoted as α. A lower significance level (e.g., α = .01 instead of α = .05) decreases the chance of a Type I error but also reduces statistical power.
Test sensitivity
The ability of the statistical test to detect differences or relationships. More sensitive tests have higher power.
Study design and type of inferential analyses
Some study designs and their associated analyses are inherently more powerful than others. For example, repeated measures designs tend to be more powerful than between-groups designs.
How to calculate the sample size you need
An a priori power analysis is a statistical procedure conducted before data collection to determine the required sample size needed to achieve a certain level of statistical power for a planned hypothesis test.
Estimated effect size
You need an idea of the size of the relationship(s) or difference(s) you are studying. You can find this by searching the literature to see the size of the effects reported in past research (if meta-analyses are available, these will provide the most accurate estimate). If there is no past research, you need to select the smallest effect size you are interested in detecting.
Significance level (alpha)
Select the threshold for significance you will use for your inferential analyses (this should be determined a priori, not later when you get to the statistical analysis).
Type of analysis
The way you conduct a power analysis differs for each type of inferential analysis. Given that the type of analysis you use is determined by your hypotheses and the type of data you have collected, you should know what it will be before you even start recruiting participants.
Other Considerations for Quantitative Research
Internal Validity
Refers to the extent to which a study can establish a causal relationship between the independent and dependent variables.
Threats to internal validity include
Study design: Non-experimental studies, by definition, cannot test causality and thus have low internal validity.
Poor experimental control: As discussed in Module 1, poor experimental control increases the likelihood of extraneous variables confounding the results of the study.
Use of invalid or ineffective experimental manipulations: If experimental manipulations are not effective or if their validity has not been verified, they may appear to work but fail to manipulate the intended variable properly.
Use of invalid or unreliable measurement tools: If we cannot be sure that we are measuring something accurately or consistently, we cannot draw valid conclusions about causation, as any effects observed may not actually be related to the intended constructs.
External Validity
Refers to the extent to which the results of a study can be generalised or applied to settings outside the study, such as to the general population or different environments.
Threats to external validity include
Poor ecological validity
Ecological validity refers to how natural or realistic the experimental environment and tasks are. When a study is conducted in artificial, highly controlled environments, the results may not generalise to the real world, where many other uncontrolled variables are present.
Poor psychological realism
If the mental processes used for a task in a research study are very different from the processes a person would use in real life, the results may not generalise outside the study. For example, memorising strings of random numbers for a task in a research study may use different memory processes than recalling faces, which have systematic and predictable patterns. Therefore, a study using the former task would have poor generalisability regarding the ability to recall faces in social settings.
Non-representative samples
If a sample differs in significant ways from the population, their results may not generalise.
Why Does Good Research Methodology Matter?
If the wrong research design is chosen, the study may not actually test the hypotheses accurately.
If the wrong manipulation is chosen, or if there is low internal validity, you cannot be confident that any effects you observe were caused by the factor you think caused them.
If poor-quality measurement tools are chosen, you cannot be confident that you are measuring what you think you are, or that those measurement tools will be able to discriminate between participants effectively.
If the wrong population is chosen, you may be researching a phenomenon among people it does not affect.
If the wrong sample is chosen, the results may not represent the population, or you may not have sufficient power to detect a real effect.
If external validity is low, the results may not apply to people or settings outside of the study.
On the flip side, if a study uses high-quality and appropriate methods, we can be confident in the conclusions we draw.