ECG
What is an ECG
An ECG (electrocardiogram) is used to record the electrical activity of the heart from different angles.
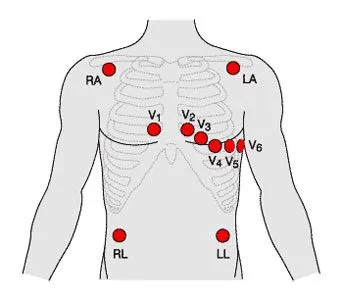
ECGs are recorded by placing electrodes on a patient
AN ECG lead is a graphical representation of the heart’s electrical activity, generated from several electrodes.
12-lead ECG
A 12-lead ECG is generated by the combination of 10 electrodes
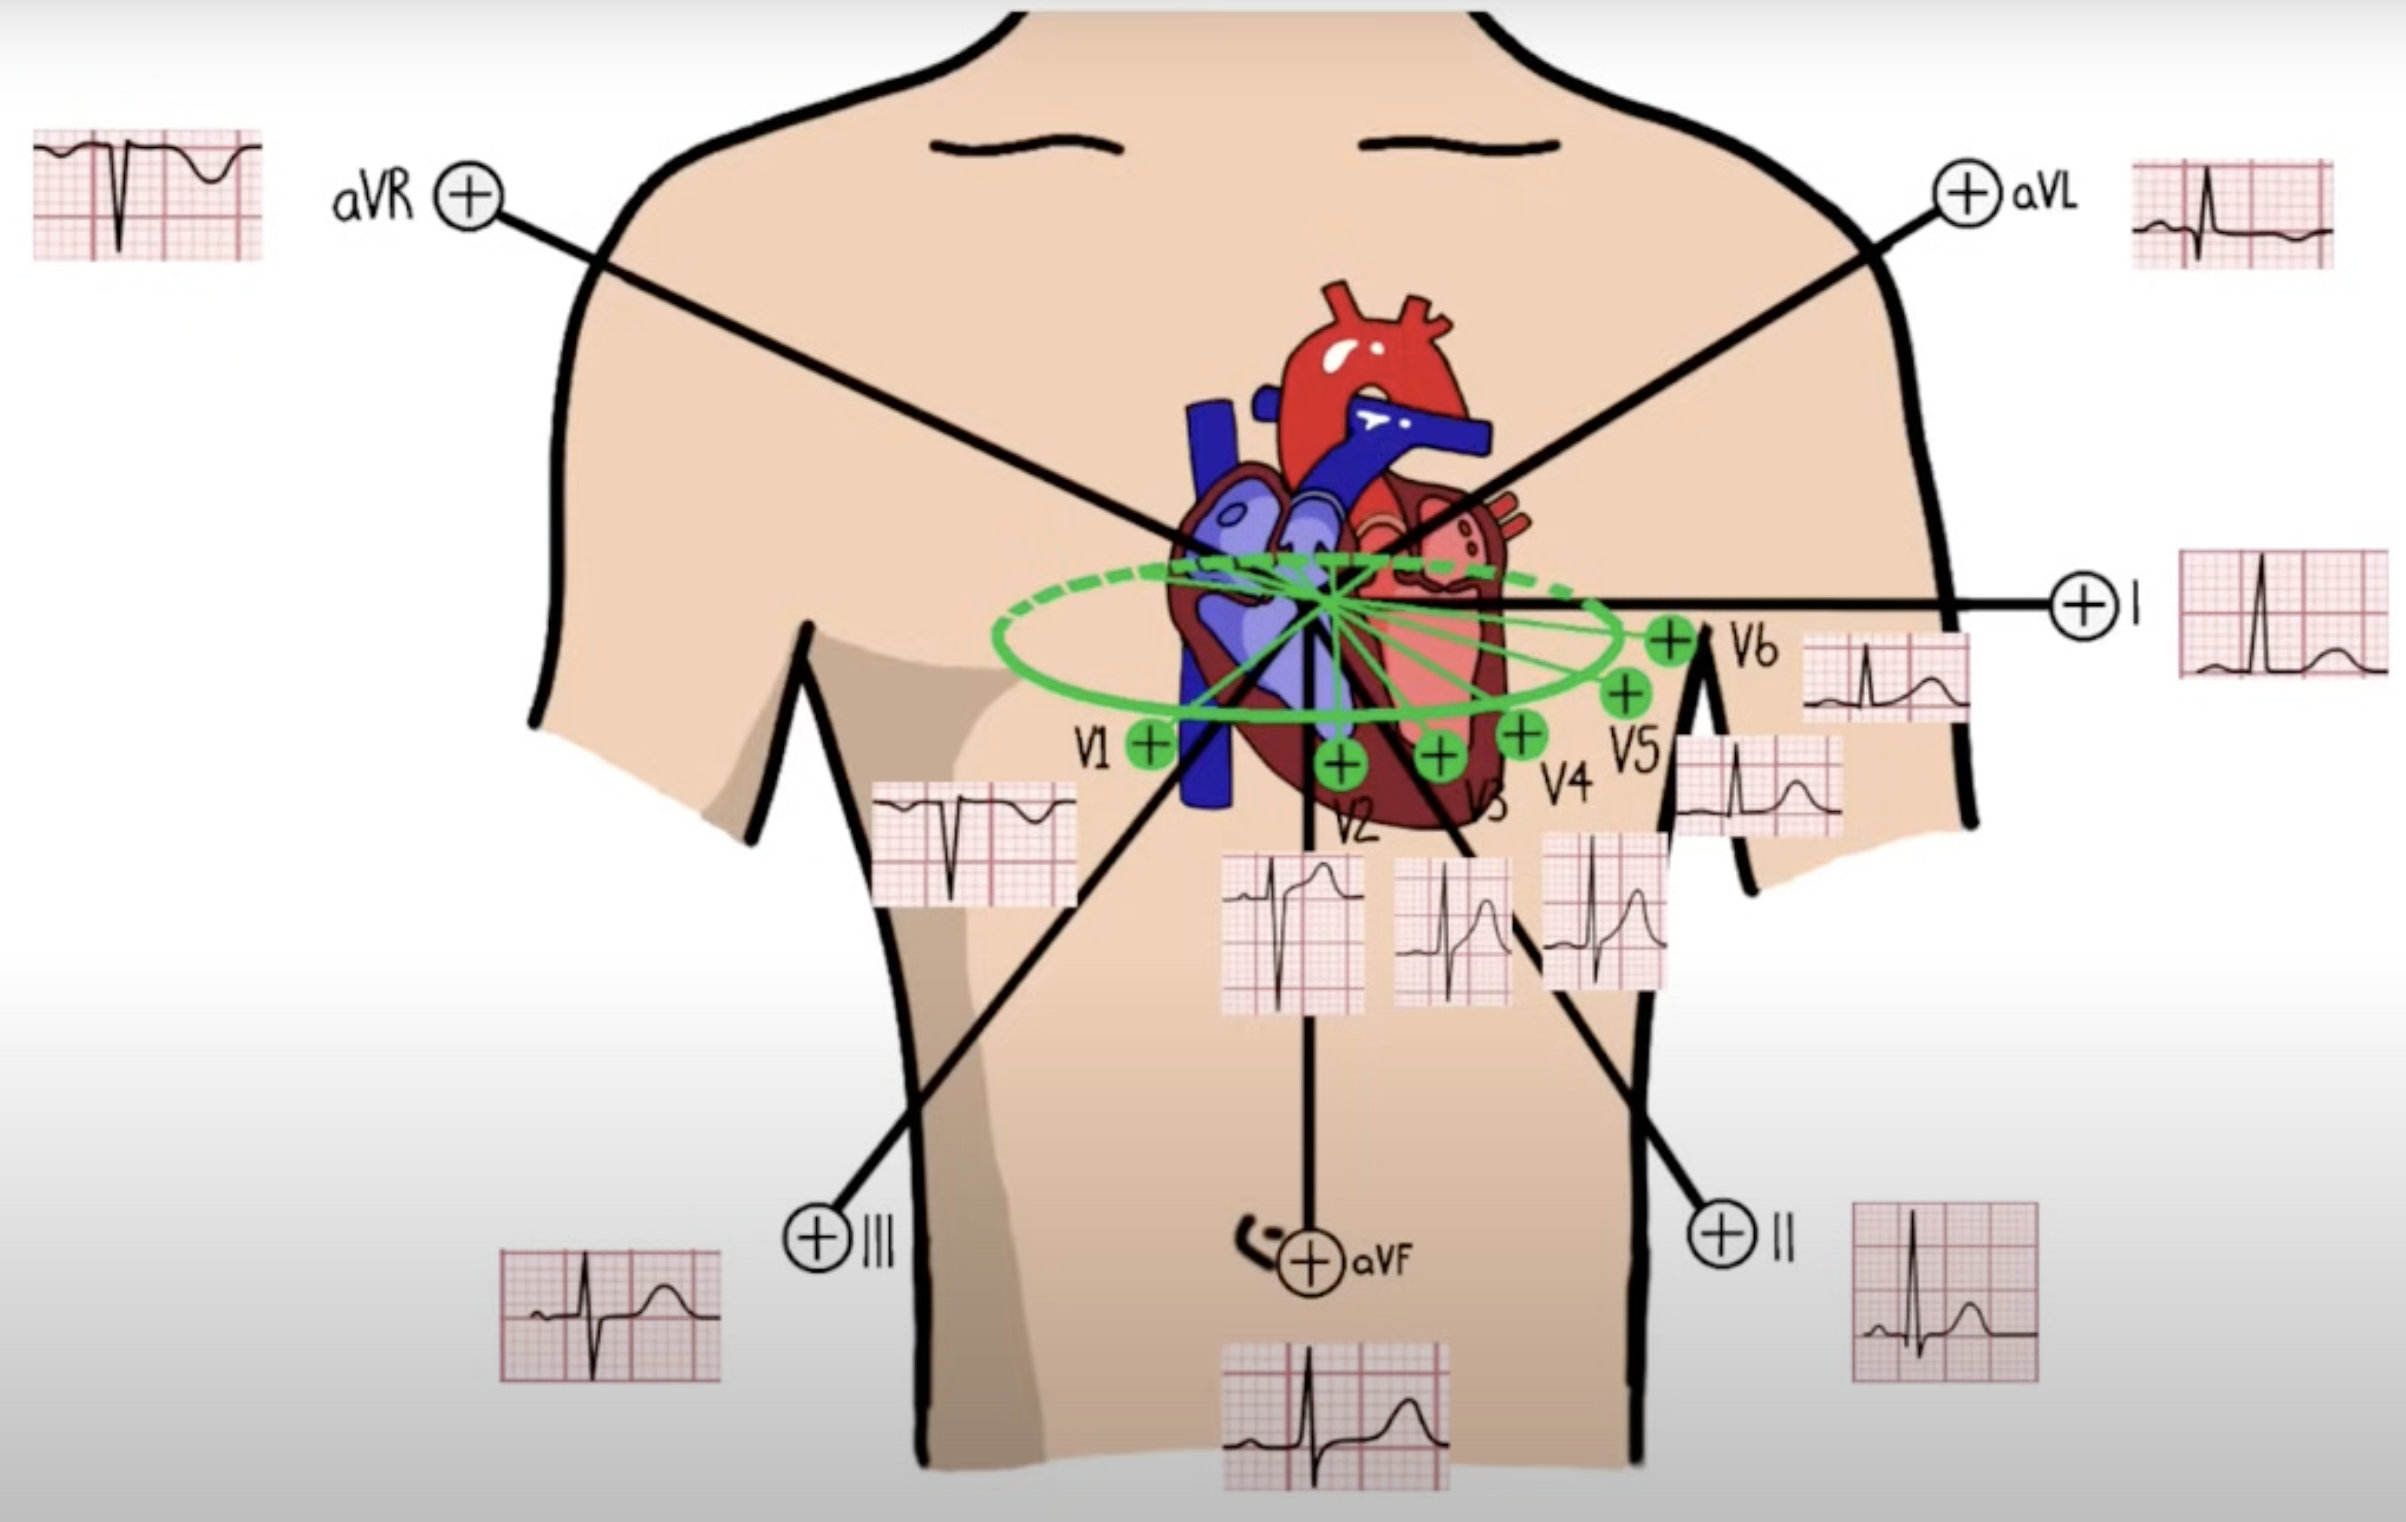
V1: Septal view of the heart
V2: Septal view of the heart
V3: Anterior view of the heart
V4: Anterior view of the heart
V5: Lateral view of the heart
V6: Lateral view of the heart
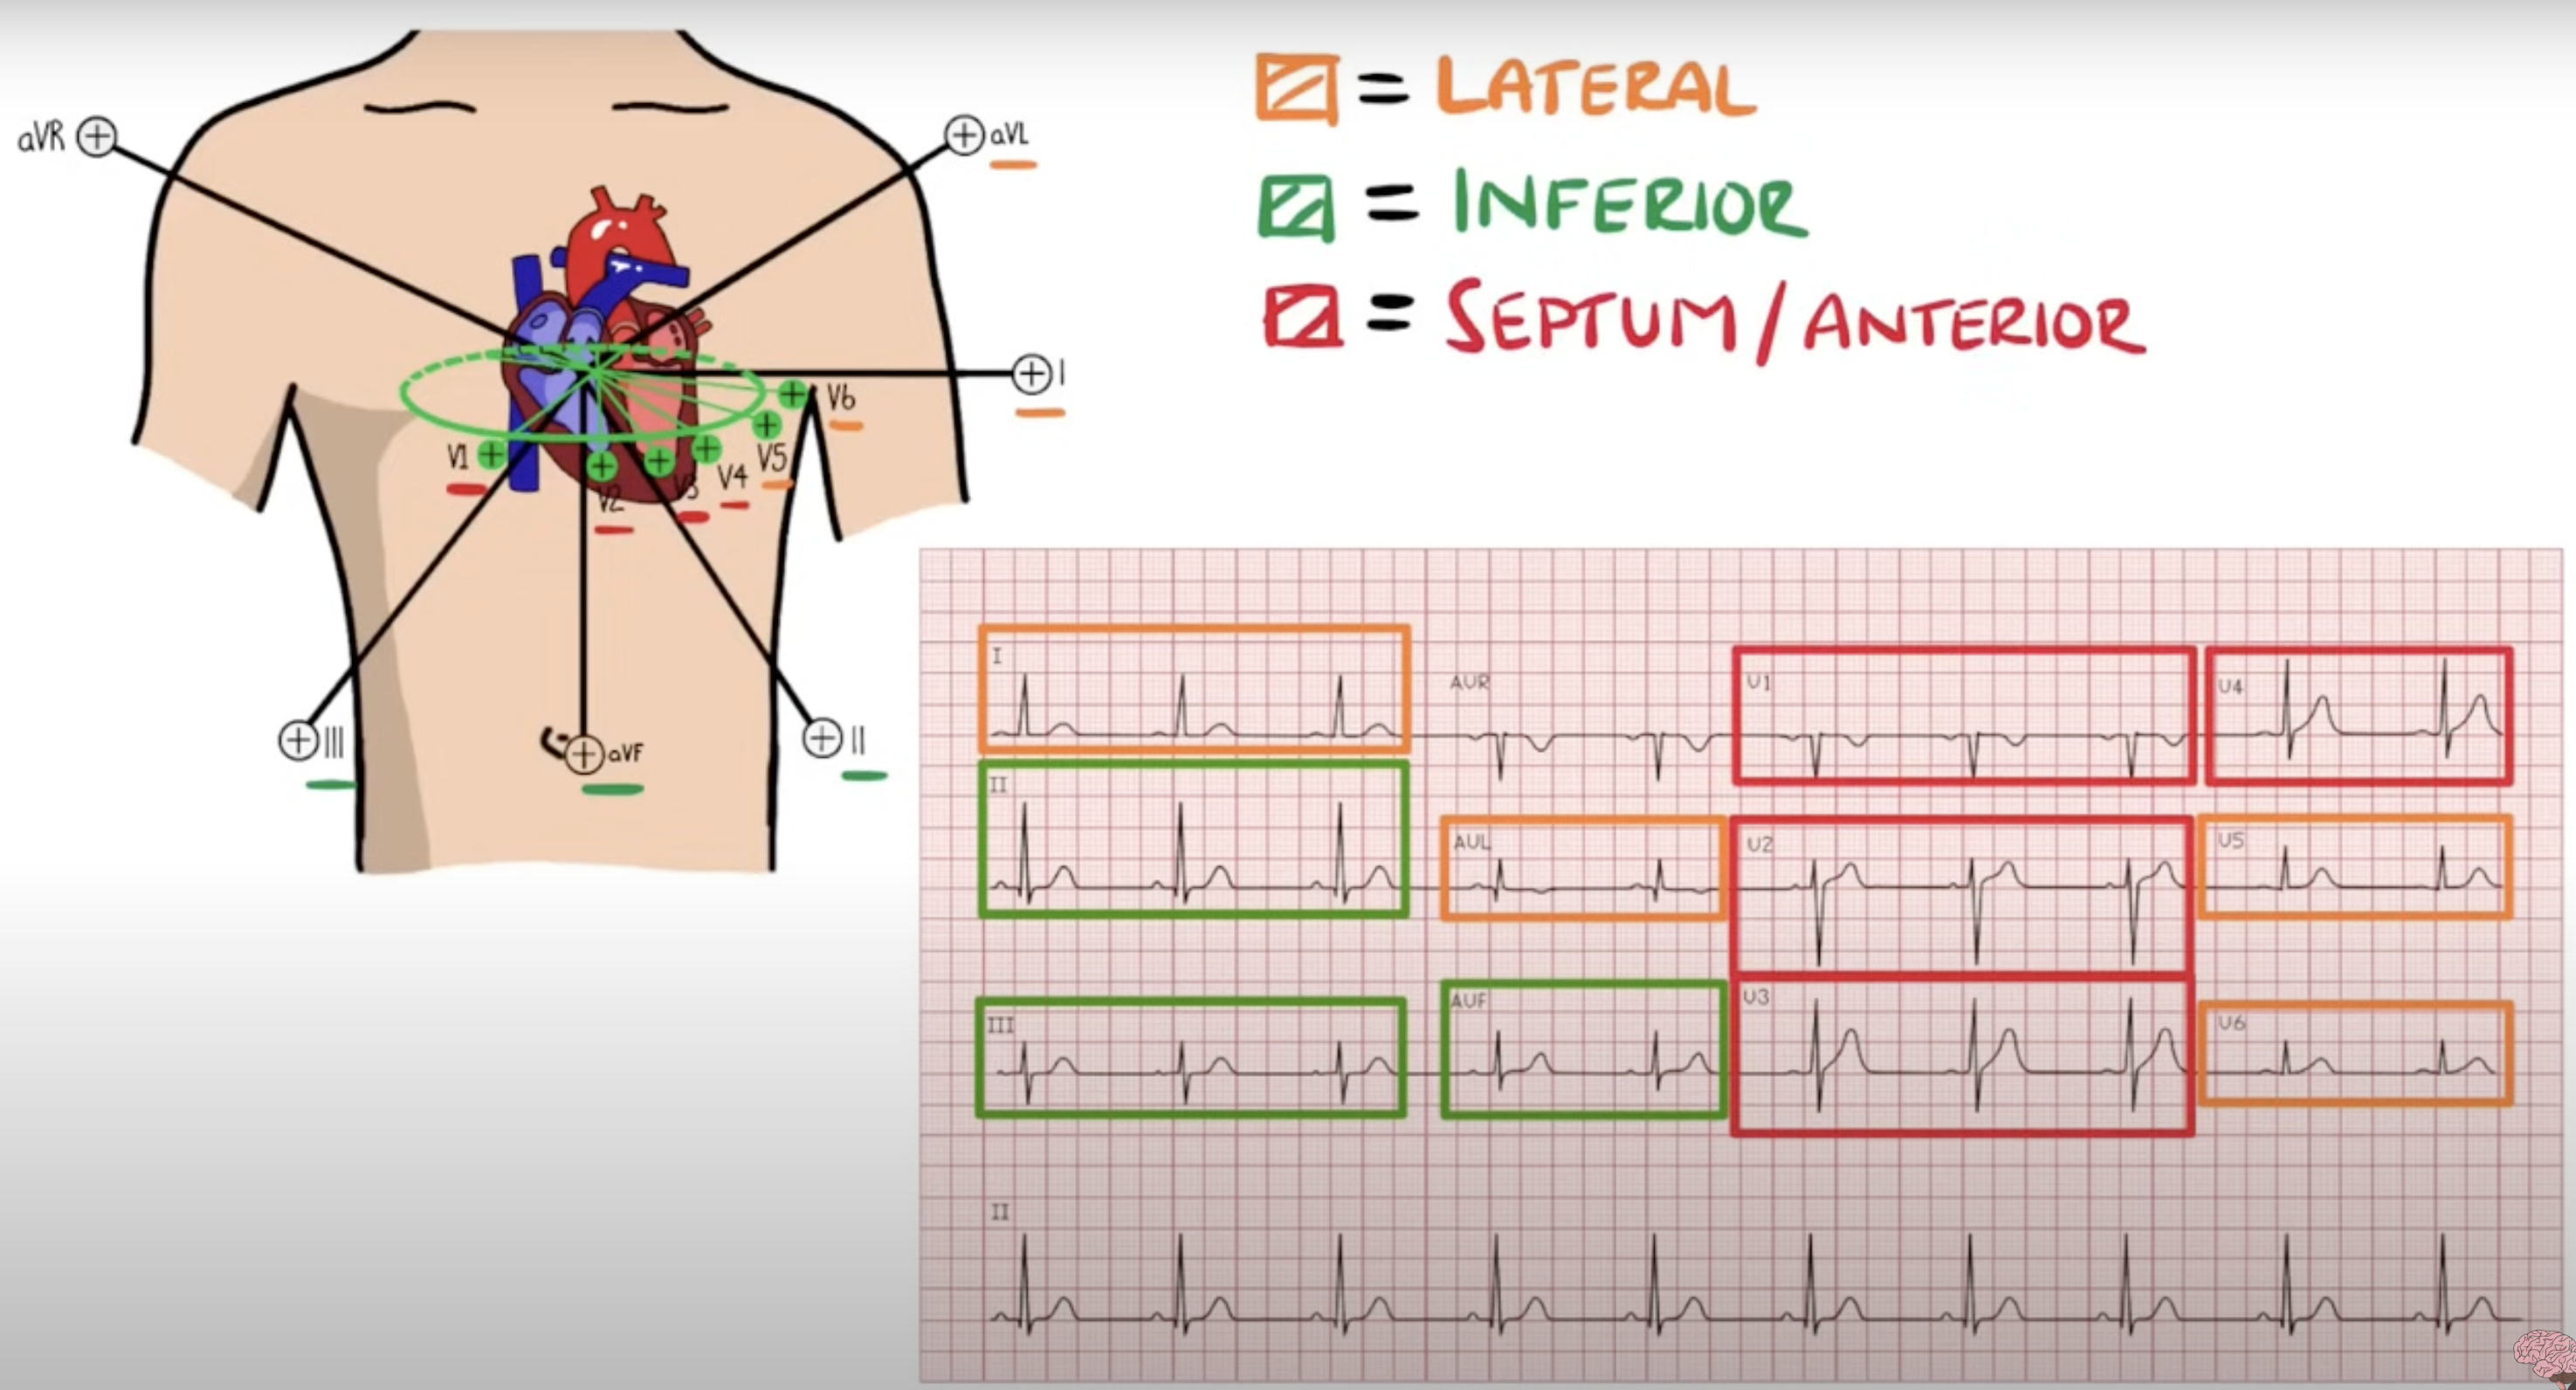
Lead I: Lateral view (calculated by analysing between the RA and LA electrodes
Lead II: Inferior view (calculated by analysing activity between the RA and LL electrodes)
Lead III: Inferior view (calculated by analysing activity between the LA and LL electrodes)
aVR: Lateral view (calculated by analysing activity between LA+LL → RA)
AVL: Lateral view (calculated by analysing activity between RA+LL → LA)
aVF: Inferior view (calculated by analysing between RA+LA → LL)
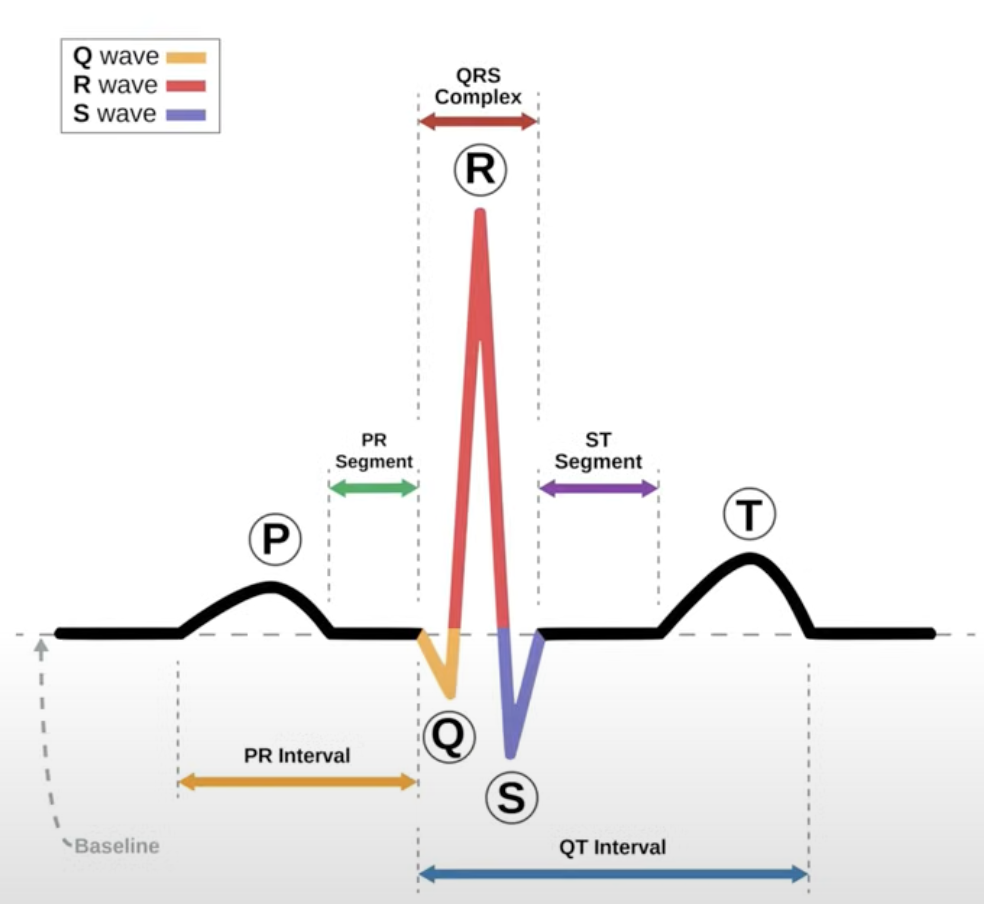
ECG Cycle
Wave/Segment | What It Represents | Normal Features | Key Abnormalities |
|---|---|---|---|
P wave | Atrial depolarisation — the electrical activation of the atria, starting at the SA node and spreading through atrial muscle | Duration <0.12 s (3 small boxes), amplitude ≤2.5 mm, upright in leads I, II, aVF | Tall P (P pulmonale — right atrial enlargement), broad/notched P (P mitrale — left atrial enlargement), inverted P (ectopic atrial rhythm) |
PR interval | Time from start of atrial depolarisation (P wave) to start of ventricular depolarisation (QRS) — includes AV node conduction delay | 0.12–0.22 s | Prolonged → first-degree AV block; Short → pre-excitation (WPW) |
QRS complex | Ventricular depolarisation — electrical activation of the ventricles via His-Purkinje system | Duration <0.12 s; Q wave small in some leads; R wave progression across V1–V6 | Wide → BBB, ventricular rhythm; Pathologic Q → old MI; Poor R progression → anterior MI |
ST segment | Early phase of ventricular repolarisation — period when ventricles are fully depolarised | Normally isoelectric (flat) | ST elevation → STEMI, pericarditis; ST depression → ischemia, digoxin effect |
T wave | Ventricular repolarisation — recovery phase of ventricles | Upright in most leads (except aVR, V1); smooth | Inverted → ischemia, LVH strain; Tall/peaked → hyperkalemia; Flat → hypokalemia |
U wave(optional) | Possibly after-potentials from Purkinje fibres | Small, follows T wave | Prominent in hypokalemia, bradycardia |
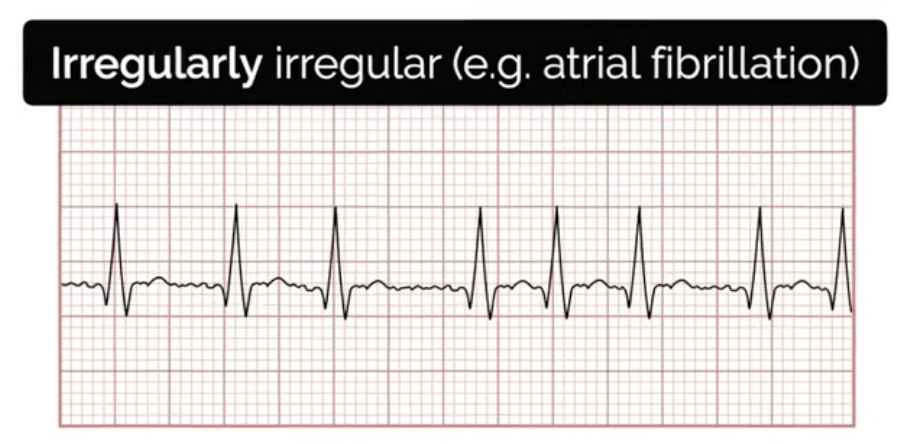
Heart rhythm
Heart rhythms can be
regular
regularly irregular
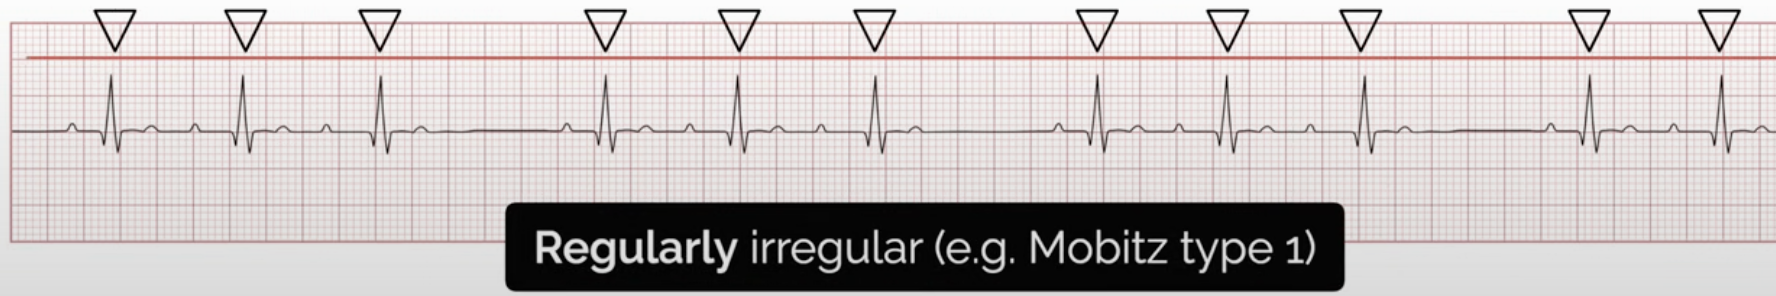
irregularly irregular
Cardiac axis
What is cardiac axis
Definition: The cardiac electrical axis is the net direction of electrical depolarisation in the ventricles, viewed in the frontal plane (limb leads).
It reflects the average vector of ventricular depolarisation during the QRS complex.
Measured in degrees, with 0° aligned with lead I’s positive pole.
Normal ranges
Normal axis: –30° to +90° (some sources: –30° to +100°)
Left axis deviation (LAD): –30° to –90°
Right axis deviation (RAD): +90° to +180°
Extreme axis (“northwest axis”): –90° to –180°
Causes
Left Axis Deviation
Left ventricular hypertrophy (LVH)
Left anterior fascicular block
Inferior MI
Ventricular pacing
LBBB
Right Axis Deviation
Right ventricular hypertrophy (RVH)
Pulmonary embolism
Chronic lung disease / cor pulmonale
Left posterior fascicular block
Lateral MI
RBBB (sometimes)
Extreme Axis
Severe ventricular rhythm
Ventricular tachycardia
Hyperkalemia
P waves
Represents: Atrial depolarisation (right atrium first, then left)
Normal:
Duration ≤0.12 s (≤3 small boxes)
Amplitude ≤2.5 mm (limb leads)
Upright in II, inverted in aVR, biphasic in V1
Abnormal:
P pulmonale (RAE): Tall, peaked (>2.5 mm in limb leads)
P mitrale (LAE): Broad (>0.12 s), M‑shaped in II, deep terminal negative in V1
Ectopic atrial: Abnormal shape, axis
Junctional rhythm: Inverted/absent P, may occur before/during/after QRS
Key associations: Chamber enlargement, valvular disease, chronic lung disease, arrhythmias
PR interval
Represents: Time from start of atrial depolarisation (P wave) to start of ventricular depolarisation (QRS) → includes AV node delay.
Normal: 0.12–0.20 s (3–5 small boxes).
Abnormal:
Prolonged (>0.20 s): 1st‑degree AV block.
Progressive lengthening then dropped QRS: Mobitz I (Wenckebach).
Fixed PR + random dropped QRS: Mobitz II (dangerous, may progress to complete block).
No P–QRS relationship: 3rd‑degree (complete) AV block.
Short PR (<0.12 s): Pre‑excitation (WPW), junctional rhythm.
Key associations: AV node disease, accessory pathways, conduction delay.
QRS complex
Represents: Ventricular depolarisation via His–Purkinje system.
Normal: Duration <0.12 s (≤3 small boxes), narrow, upright in most limb leads.
Abnormal:
Wide (≥0.12 s): Bundle branch block, ventricular rhythm, hyperkalemia.
Pathological Q waves: ≥0.04 s wide & ≥25% of R amplitude → old MI.
Bundle branch block patterns:
RBBB: rSR′ in V1, wide S in V6.
LBBB: Broad notched R in V6, deep S in V1.
Voltage changes:
Tall → LVH, RVH.
Low → pericardial effusion, obesity, COPD.
Key associations: Infarction, chamber hypertrophy, conduction defects.
ST segment
Represents: Early ventricular repolarisation (plateau phase of action potential) when ventricles are fully depolarised.
Normal: Isoelectric (flat), duration ~0.08–0.12 s; compare with PR segment as baseline.
Abnormal:
Elevation:
≥1 mm in ≥2 contiguous limb leads OR
≥2 mm in ≥2 contiguous chest leads → STEMI.Widespread concave elevation + PR depression → pericarditis.
Benign early repolarisation (young, healthy adults).
Depression:
Horizontal/downsloping → ischemia, digoxin effect, LVH strain.
Upsloping (less specific) → may be normal with exercise.
Key associations: Acute coronary syndromes, pericarditis, electrolyte disturbances, normal variants.
T waves
Represents: Ventricular repolarisation (phase 3 of the cardiac action potential).
Normal:
Upright in I, II, V3–V6.
Inverted in aVR, may be inverted in V1 (normal variant).
Smooth, asymmetrical (gradual upstroke, steeper downstroke).
Abnormal:
Tall peaked → Hyperkalemia, early STEMI (hyperacute T waves).
Inverted → Ischemia, ventricular strain (LVH/RVH), post-MI changes, pericarditis.
Flattened → Hypokalemia, nonspecific change.
Biphasic → Ischemia (type 1: up then down) or hypokalemia (type 2: down then up).
Symmetrical tall/inverted → Often pathological (e.g., ischemia).
Key associations: Electrolyte imbalances, acute coronary syndromes, ventricular hypertrophy, CNS events.
U waves
Represents:
Thought to be after-depolarisations of the ventricles, possibly from Purkinje fibres or papillary muscle repolarisation.
Not always visible; usually small and follows the T wave.
Normal:
Upright in most leads (same polarity as T wave).
Best seen in V2–V3.
Amplitude ≤1–2 mm.
Abnormal / Prominent:
Hypokalemia → tall, prominent U wave.
Bradycardia → slower heart rates make U waves more obvious.
Hypothermia, antiarrhythmic drugs (e.g., sotalol, amiodarone), digitalis effect.
May be fused with T wave in severe cases, risking arrhythmias (torsades de pointes).
Inverted U waves:
Can indicate ischemia, LVH, or raised intracranial pressure.