Solar PV 1
PN junction
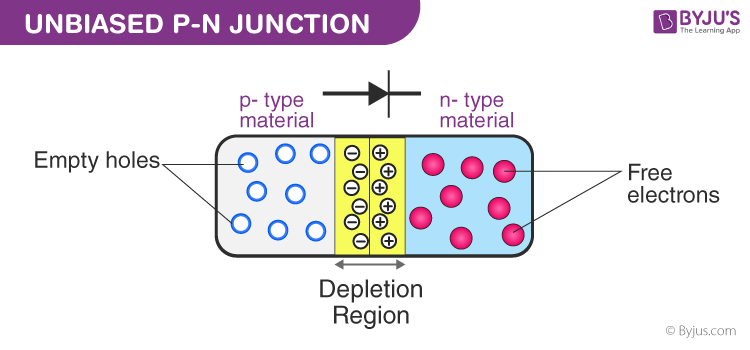
Doping
The P-type region is an area doped with an element that has an electron missing, creating what is called a hole.
The N-type region is an area doped with an element that has an extra electron that isn’t covalently bonded
IMPORTANT TO REMEMBER: both regions have holes and extra electrons. What differentiates the regions is if the base material or the doped material has the free electron.
P-type: doped=hole, base=electron
N-type: doped= electron, base = hole
This creates an ‘electric field’ by creating essentially a desired direction for the flow of charge carriers, allowing the movement of electrons from the N-type region to the P-type region, which is crucial for generating electricity in solar cells.
Why don’t they cancel out? and what’s with the depletion region?
For the exams, tbh forget it. You really don’t need to know any more. There is a reason why but it’s due to some stabilisation in the middle with atomic orbitals and somehow that interaction is stronger than the electric field trying to pull them apart. How that reaction works is what not to look into for this exam.
What you need to understand, though, is this: without extra energy, the system is neutral. It’s only when energy is introduced that the structure allows for the electrons to overcome the potential barrier, enabling them to move freely and generate electric current.
Electricity conduction
photon hits region of panel → imbalance allows the electron to surpass the depletion region and flow in the direction of the electric field → electron moves around a circuit → the electron returns to an atom with a hole.
IV characteristics

Key Features of the I-V Curve
Short-Circuit Current (I_SC):
Where the curve meets the current (I) axis.
Maximum current when voltage is zero.
Open-Circuit Voltage (V_OC):
Where the curve meets the voltage (V) axis.
Maximum voltage when current is zero.
Maximum Power Point (MPP):
The point on the curve where the product of current (I) and voltage (V) is highest.
Indicates the solar cell's optimal operating condition.
Fill Factor (FF):
A measure of the curve’s "squareness."
Reflects the quality and efficiency of the solar cell.
What the Curve Shows
Flat Top Section: Current stays nearly constant across a range of voltages, showing the solar cell's ability to generate steady current under illumination.
Sharp Drop Near V_OC: Current rapidly decreases as the voltage approaches the maximum open-circuit voltage.
Power Output: The orange curve highlights the power output, peaking at the Maximum Power Point.
Efficiency (η\etaη): η= P_out/P_in * 100
P_out = the maximum output of the solar cell (V_mpp * I_mpp)
P_in: Power of the incident sunlight (input power, typically in W/m^2).
Expressed as a percentage.
Fill Factor (FF): FF= (V_mpp * I_mpp)/(V_OC * I_OC)
This ratio indicates the efficiency of the solar cell in converting sunlight into usable electrical energy, with higher values representing better performance.
Difference between fill factor and η
Fill factor = the actual performance of the panel compared to its theoretical maximum (the rectangle under the IV curve. what it can salvage from the energy it has.
η = the performance of the panel compared to the power it is receiving. what it can take from the sun.