Proton NMR (HNMR) Notes — Part 2
Proton NMR (HNMR) – Key Concepts and Study Notes
Overview and basis
NMR detects magnetically active nuclei, focusing here on protons (hydrogen nuclei) for HNMR and carbon nuclei for CNMR.
In the absence of a magnetic field, proton spins are random. Application of a magnetic field aligns some nuclei with the field (lower energy state) and some against (higher energy state).
A radiofrequency (RF) pulse is absorbed by nuclei in the lower energy state, promoting transitions to the higher energy state.
After the RF field is removed, excited nuclei relax back to the lower energy state and emit RF radiation, which is detected as the NMR signal.
The energy (and thus the emitted radiation) depends on the chemical environment of each proton, enabling structural information extraction from organic compounds.
Key vocabulary
NMR (Nuclear Magnetic Resonance): Involves measuring the frequency at which a nuclear spin change occurs.
That Change from low energy to high energy.
Chemical shift (δ, measured in parts per million, ppm): indicates where a signal appears on the x-axis of the spectrum and depends on the proton’s chemical environment.
Related to the resonance frequency.
The x-axis is typically labeled in ppm (parts per million). Occasionally described as delta (δ).
When observing Hydrogen its called Proton NMR = HNMR; Carbon NMR = CNMR.
The spectrum is 1D, with signals at different chemical shifts corresponding to chemically distinct protons.
What you read from a proton NMR spectrum
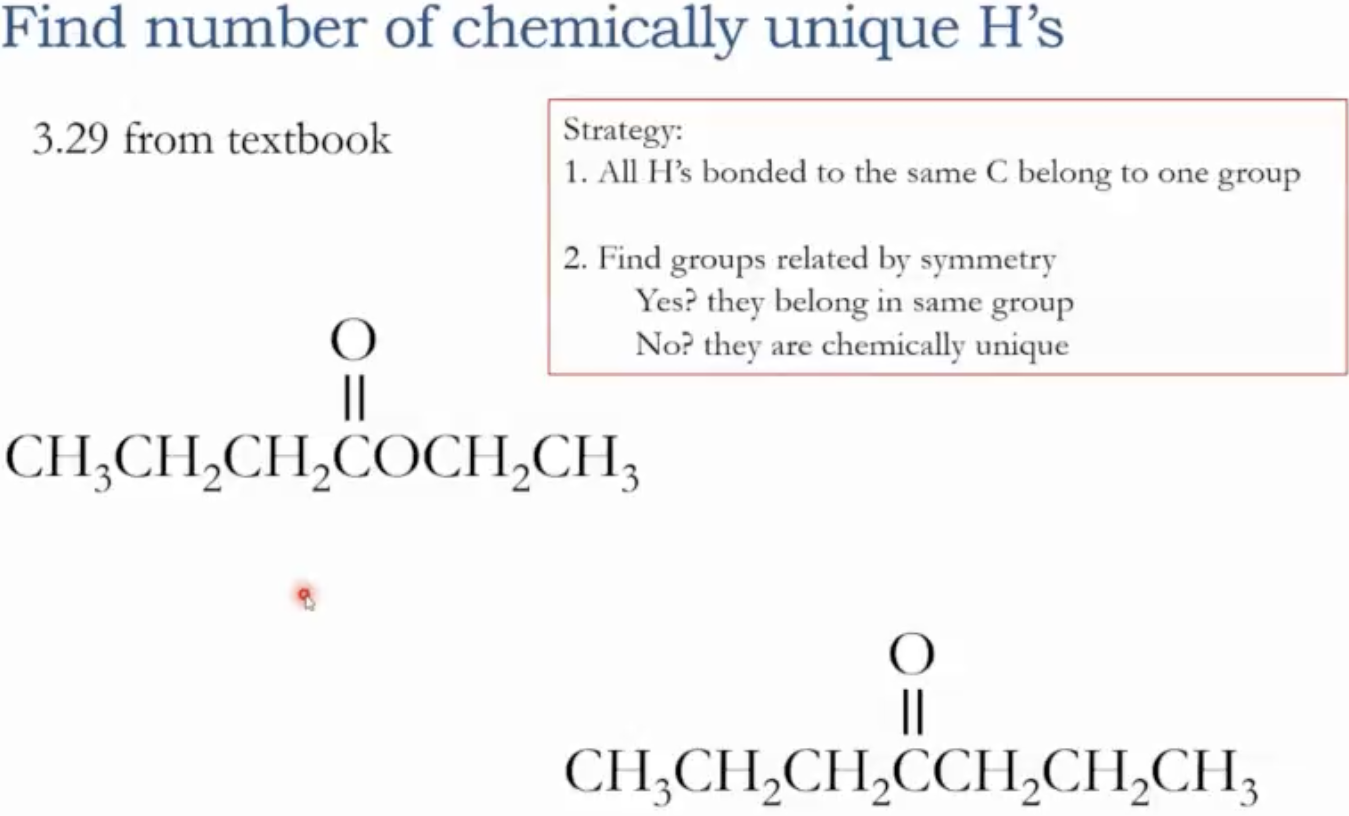
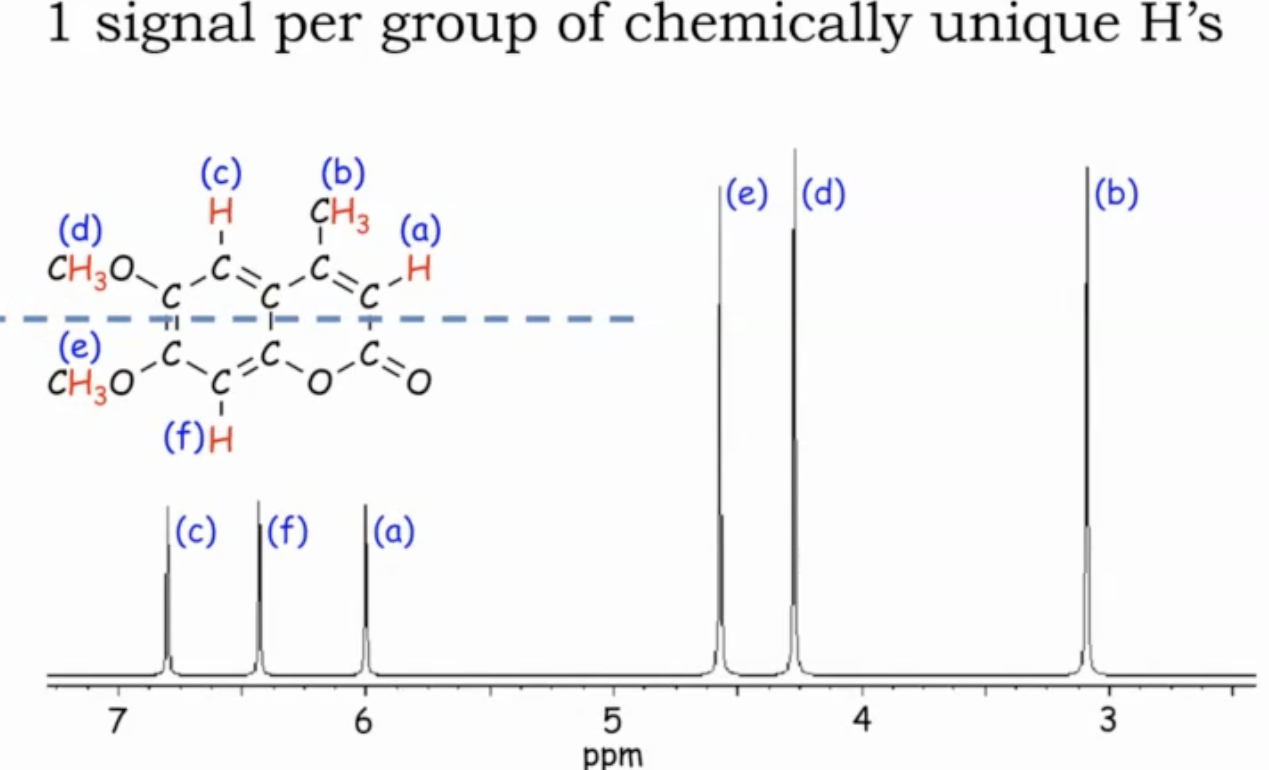
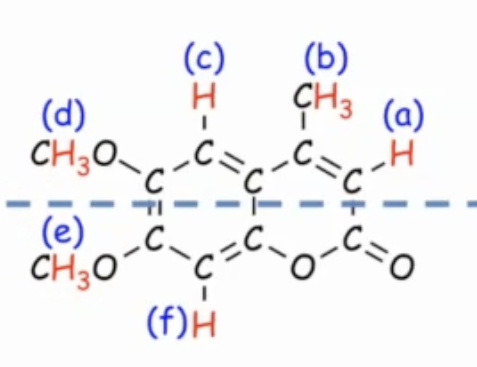
Number of signals: equals the number of chemically unique groups of protons (H’s) in the molecule.
Chemical shift (δ): location of each signal on the x-axis, indicating the type of proton (environment).
Multiplicity (splitting): tells how many hydrogens are on neighboring carbons (n) using the n+1 rule.
Integration: area under each signal, proportional to the number of protons (H’s) contributing to that signal.
Chemically equivalent protons and symmetry
Chemically equivalent protons: protons that share the same chemical environment and therefore resonate at the same frequency.
Chemically equivalent H’s exist in the same “chemical environment” and will transition at the same resonance frequency (same chemical shift).
Chemically unique H’s will have different chemical shifts.
Definition: protons bonded to the same atom (e.g., three hydrogens on a methyl group attached to the same carbon) belong to the same chemically unique group.
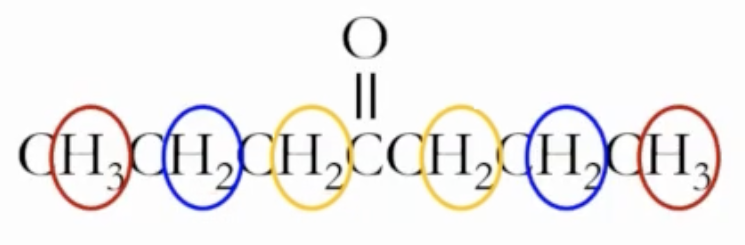
Symmetry check: if two groups are related by a plane of symmetry, they may belong to the same chemically unique group; if not, they are distinct.
Practical takeaway: count the chemically unique protons to predict the number of signals. For example, in a molecule with several CH3 groups, all hydrogens on the same carbon are one group; symmetry may merge groups further.
Protons are bonded to the same atom (C or N, typically)
Protons that are related by symmetry
If these conditions are not met, the protons under consideration are chemically different.
Predicting and interpreting proton NMR from a structure
Steps to predict signals from a molecule
Identify chemically unique proton groups; count them. Each group yields one signal.
Determine where each signal will appear (chemical shift) using proton type and neighboring atoms.
Predict multiplicity by assessing hydrogens on neighboring carbons (n, number of hydrogens on directly adjacent carbons).
Determine relative integration (how many protons in each signal).
Practice example logic
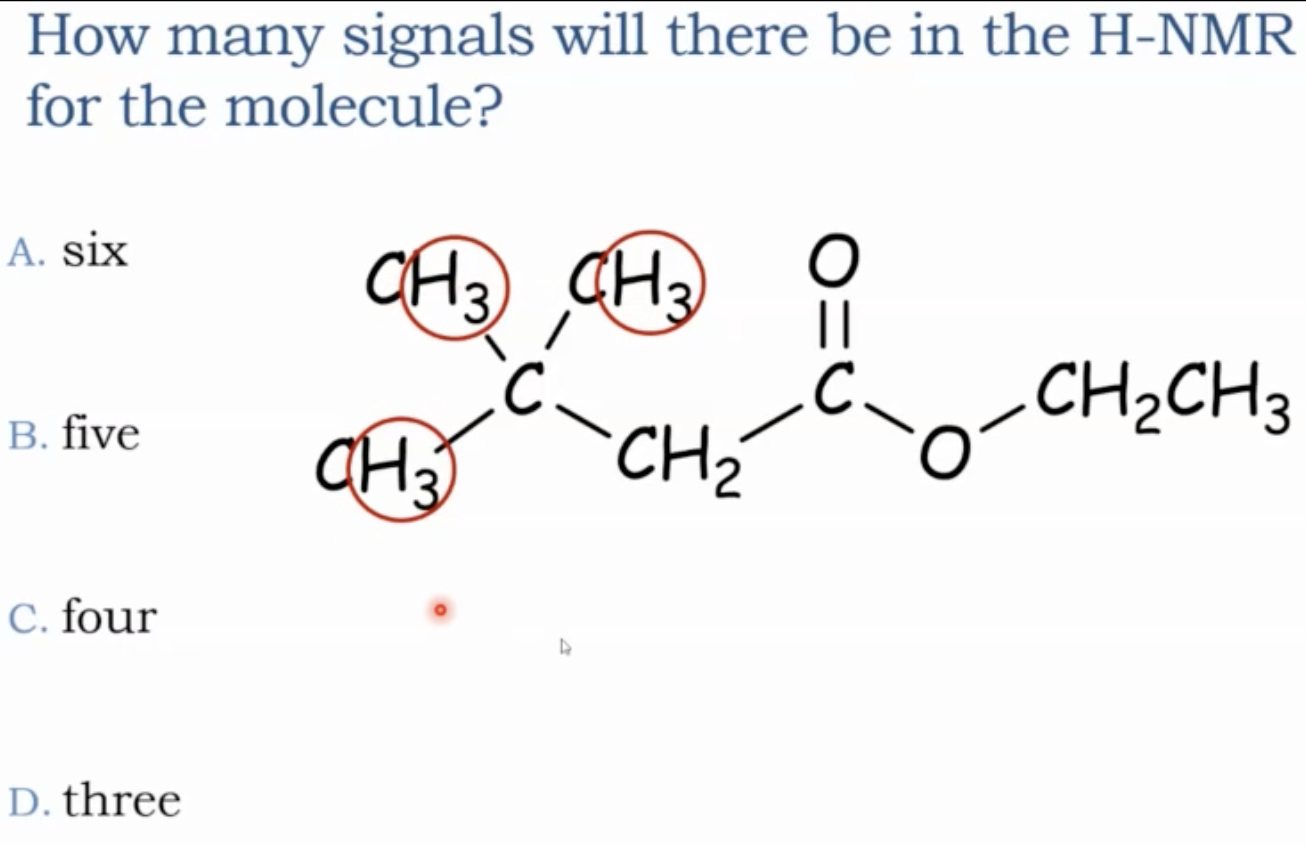
In a molecule with several CH3, CH2, and CH groups, group hydrogens on the same carbon as one signal each; symmetry can merge some groups, increasing or decreasing the apparent number of signals.
A molecule without symmetry or with broken symmetry (e.g., by an ether, carbonyl, or halogen) typically yields more chemically unique proton groups.
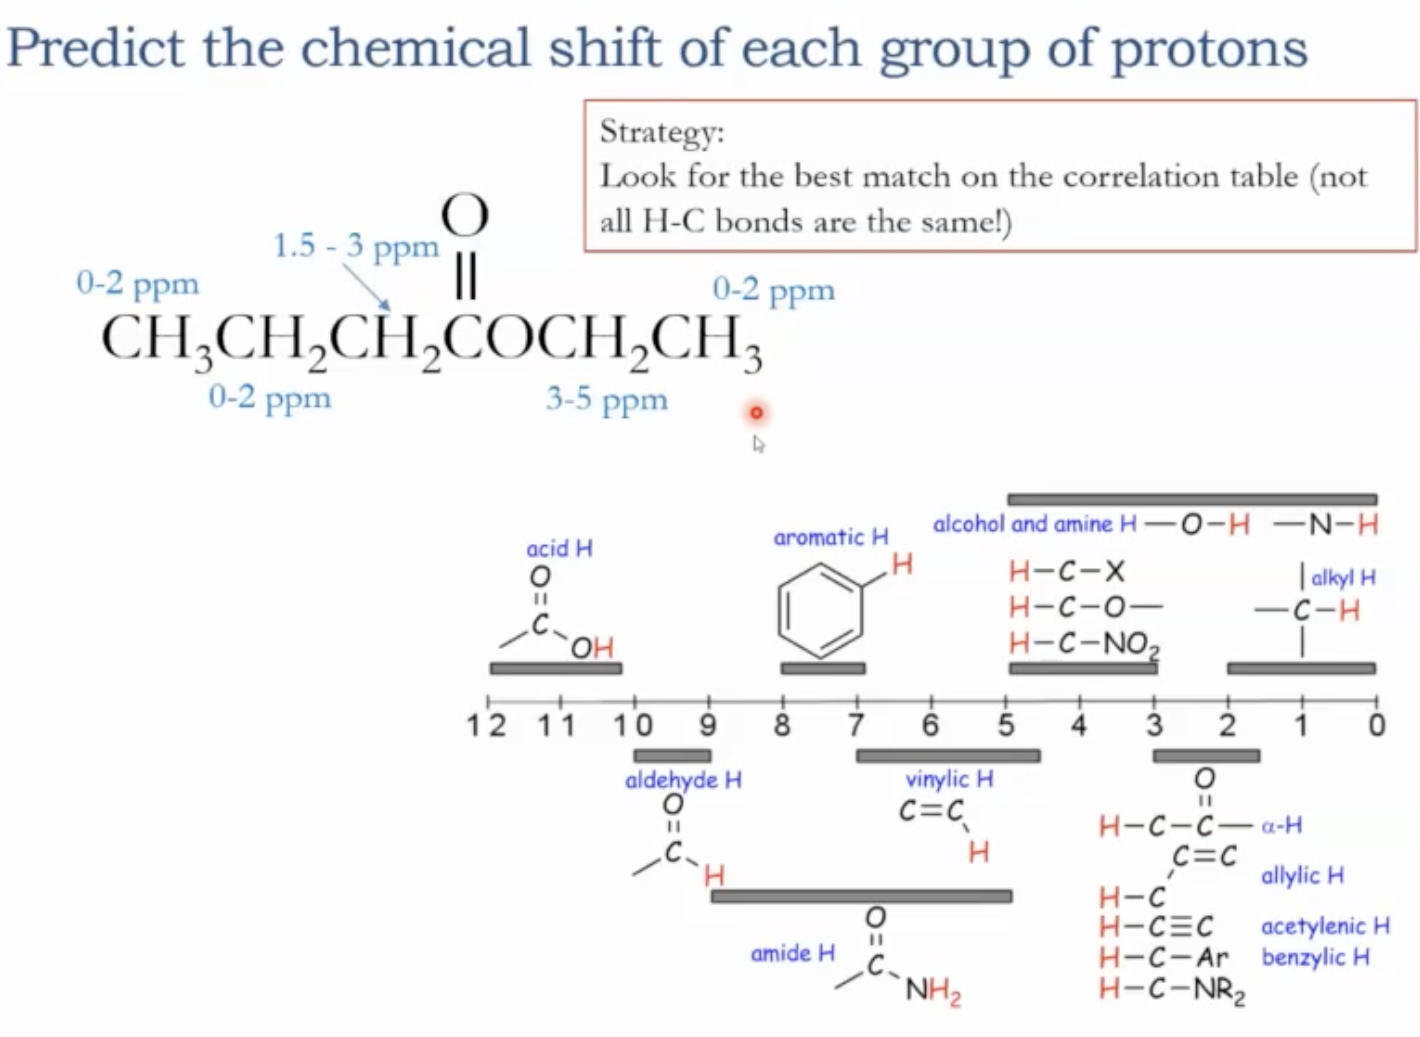
Chemical shift correlation table (ranges and examples)
Where a signal shows up is a reflection of the type of proton we are looking at.
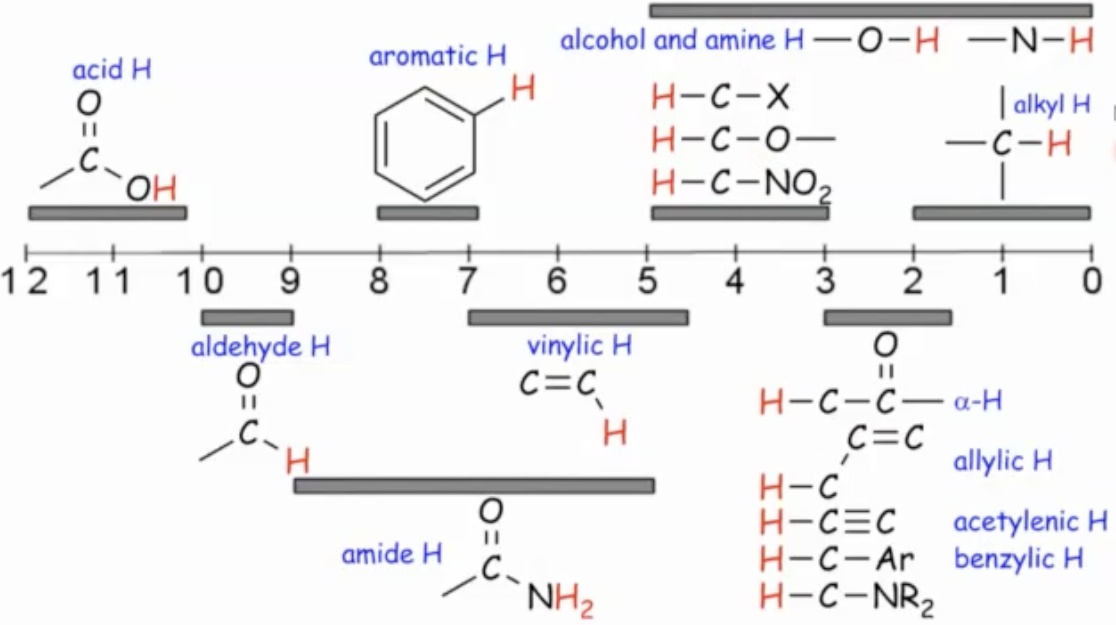
Alkyl protons 0-2 ppms
Vinyl (alkene) protons: around 4.5-7 ppms
Carboxylic acid protons: 10-12 ppms
Aromatic protons: 7-8 ppms
Aldehyde protons: 9-10 ppms
Protons adjacent to carbonyls (alpha to carbonyl): 1.5-3
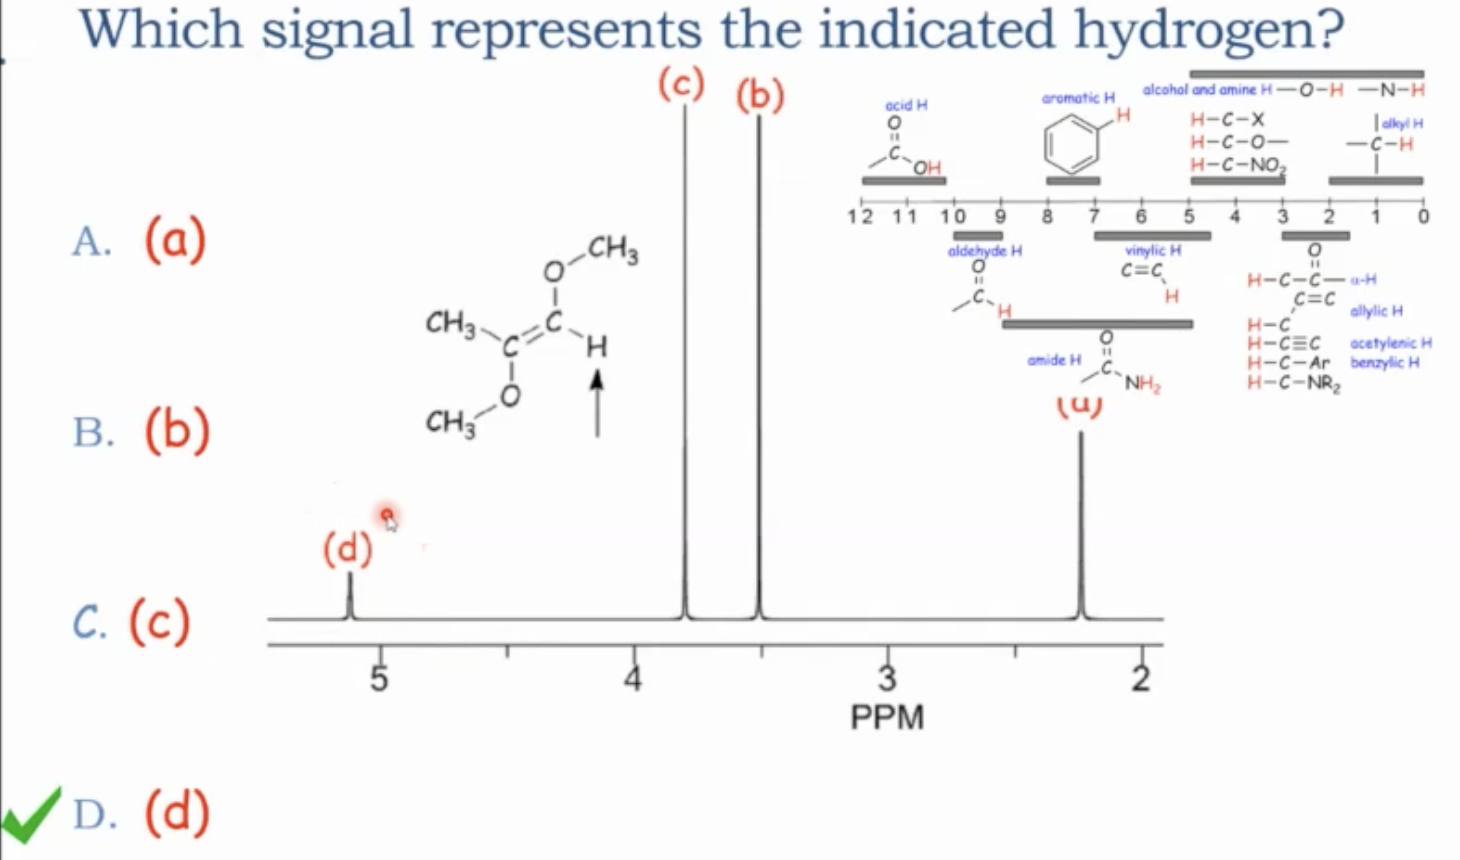
Protons on carbons adjacent to oxygen (e.g., near ethers, alcohols): 3-5 ppms
Important caveat: the hydrogen’s apparent chemical shift depends not only on the attached carbon but also on what that carbon is bonded to (e.g., H on C–H next to O or carbonyl shifts differently than simple alkyl).
The chemical environment and C–H neighbors
Don’t assume all C–H bonds on a carbon are equivalent; consider the carbon’s substituents (O, N, halogens, carbonyls, etc.).
Alpha hydrogens (on a carbon next to a carbonyl) shift differently (usually higher δ) than simple alkyl hydrogens.
Protons on carbons adjacent to heteroatoms (O, N) shift to higher ppm ranges (e.g., 3–5 ppm near O; 1.5–3 near carbonyl-adjacent carbons).
Multiplicity and the n+1 rule (splitting patterns)
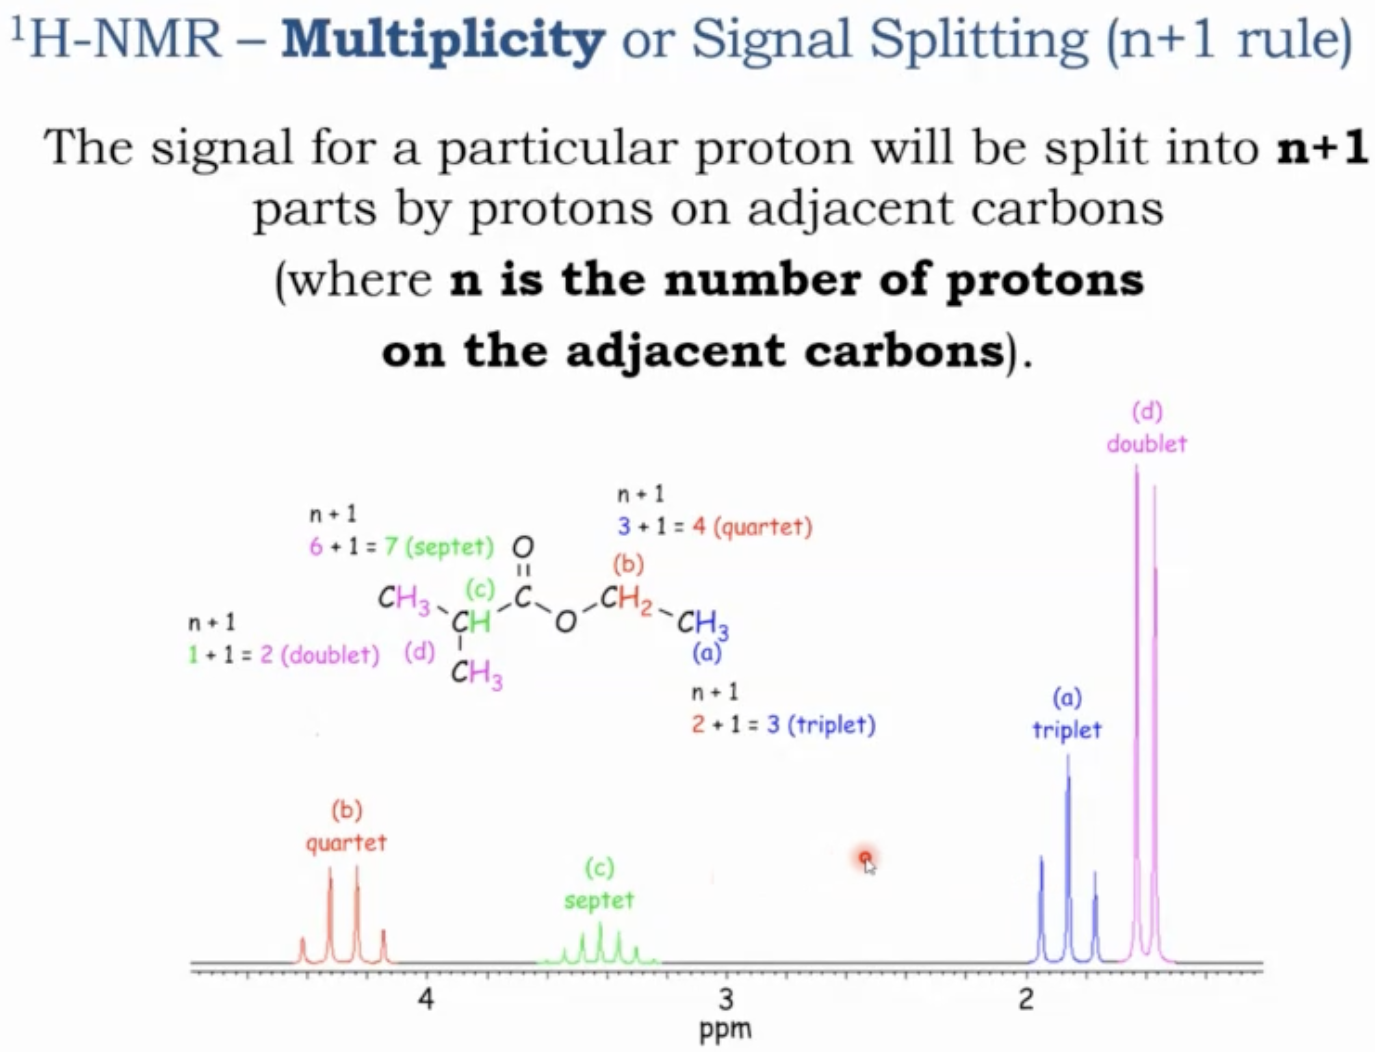
The signal for a particular proton will be split into n+1 parts by protons on adjacent carbons. (where n is the number of protons on the adjacent carbons)
A given signal is split by neighboring hydrogens on adjacent carbons according to the rule:
Multiplicity = n + 1, where n is the number of hydrogens on directly bonded neighboring carbons.
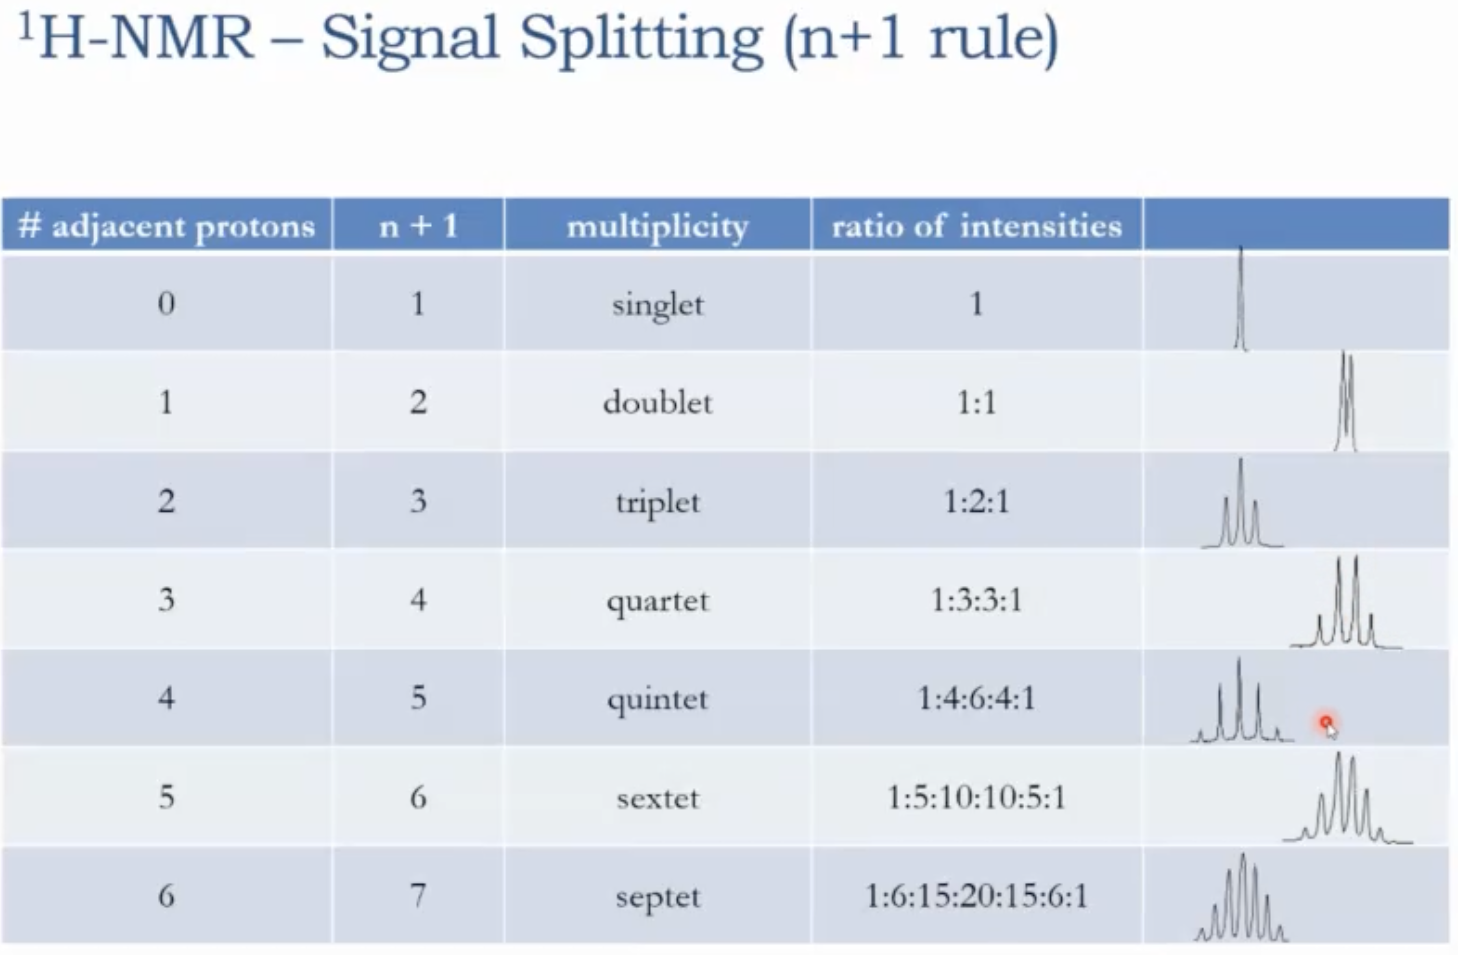
Examples of multiplicities
0 neighboring hydrogens -> singlet (s)
1 neighbor -> doublet (d)
2 neighbors -> triplet (t)
3 neighbors -> quartet (q)
4 neighbors -> quintet (quint)
5 neighbors -> sextet (sext)
6 neighbors -> septet (sept)
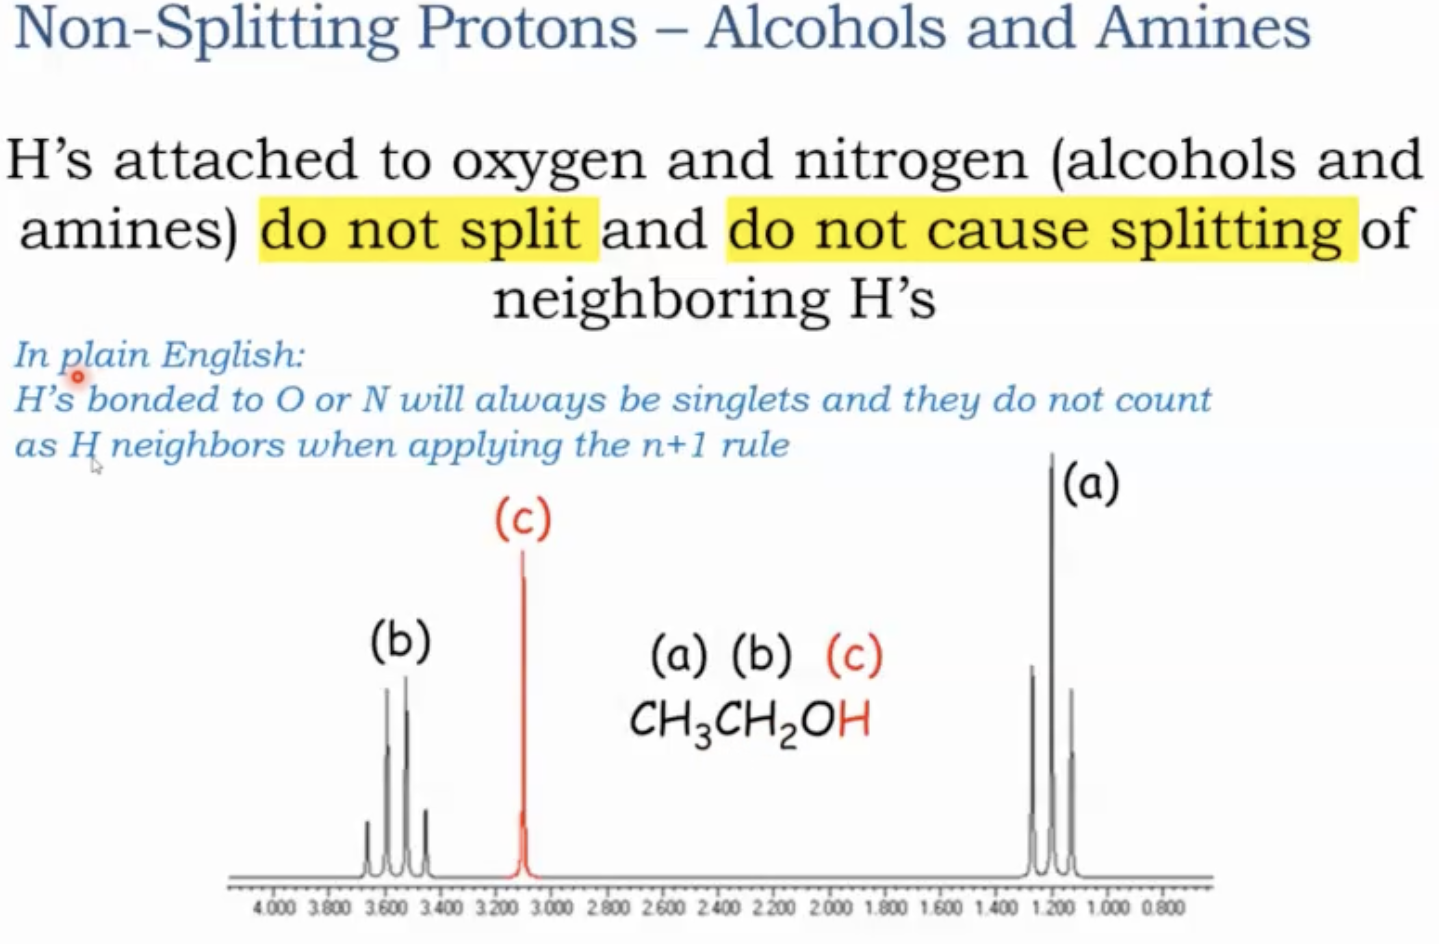
Non-Splitting Protons - Alcohols and Amines (Special Cases)
H’s attached to oxygen and nitrogen (alcohols and amines) do not split and do not cause splitting of neighboring H’s.
Basically, H’s bonded to O or N will always be singlets and they do not count as H neighbors when applying the n+1 rule.
Integration: what it tells you
Integration measures the area under each signal and is proportional to the number of protons contributing to that signal.
An area of such signal (integration) is directly proportional to the number of protons responsible for that signal.
How to read integration in practice
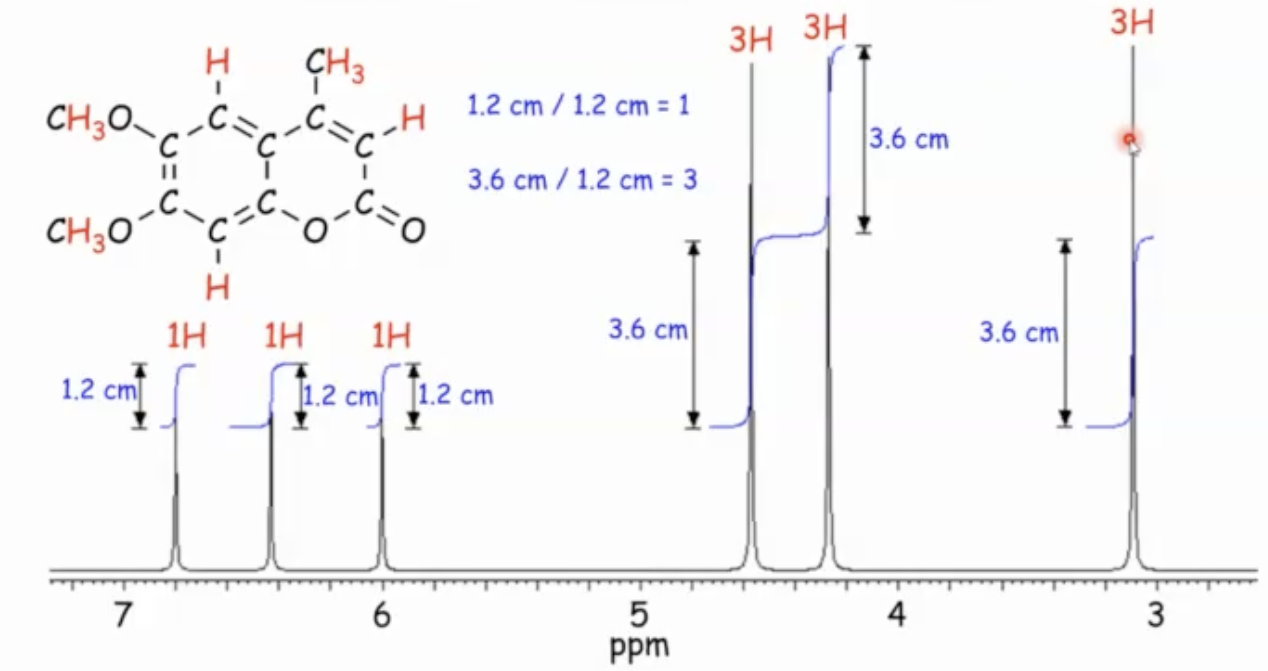
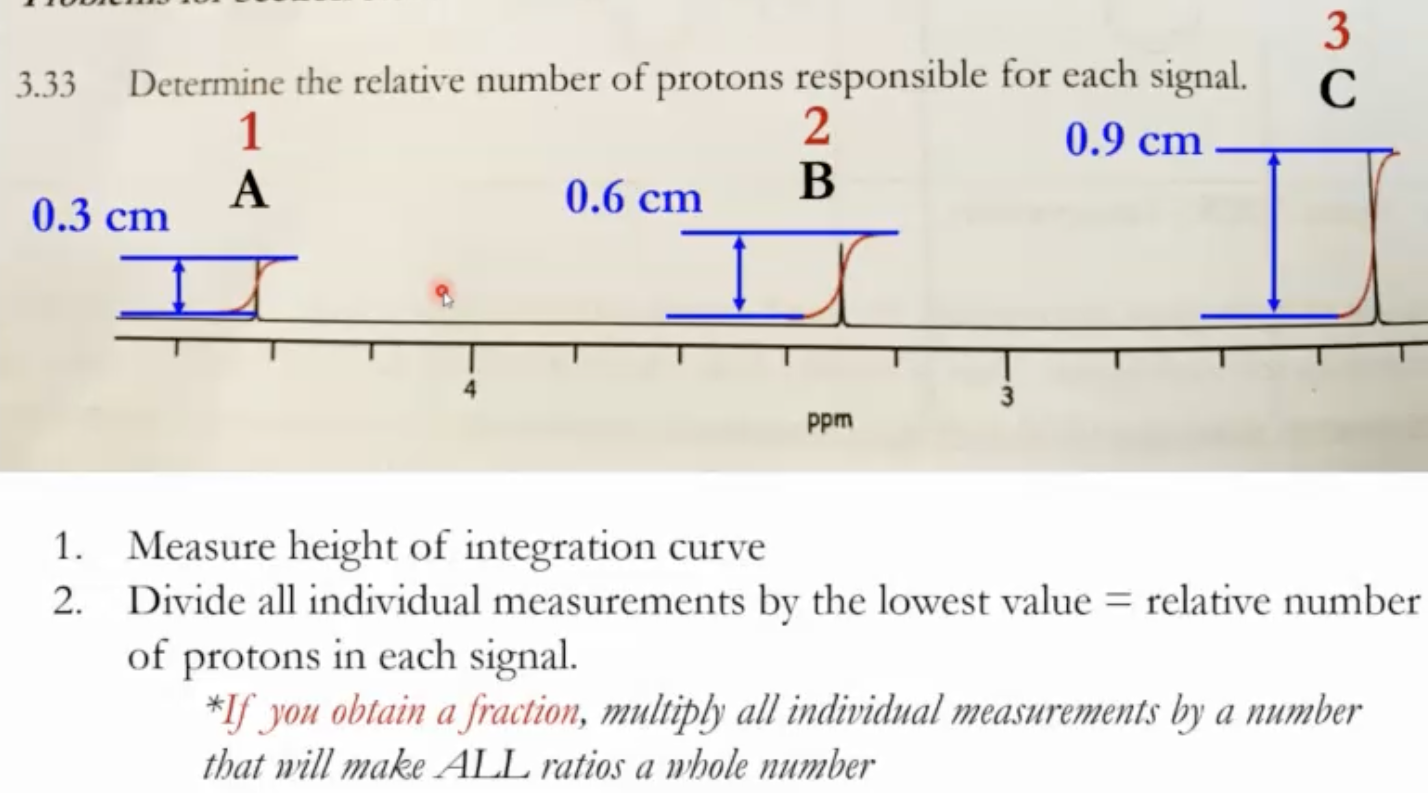
Measure the height/area of each signal (the blue “S-shaped” curves in the slide examples), from baseline to baseline.
Then divide all signal integrations by the smallest value to obtain relative proton counts.
Example: if the smallest integration is 1.2, then dividing all integrals by 1.2 yields the ratio of protons per signal (e.g., 1, 3, 3, etc.).
Important caveat
Integration provides ratios of protons. In many problems it aligns with whole numbers, but sometimes fractions appear. If fractions arise, multiply all integrations by a common factor to convert to whole numbers.
Quick recap of what proton NMR reveals
Number of signals = number of chemically unique proton groups.
Chemical shift (δ) reveals the type of proton and its immediate environment.
Multiplicity reveals the number of hydrogens on neighboring carbons (n+1 rule; only C–H neighbors count—O–H and N–H do not contribute to splitting).
Integration reveals the relative number of protons per signal (ratio of protons across signals).
Use a combination of these observations to predict or interpret a spectrum and link it back to a molecular structure.
Notable caveats and practical tips
Do not over-generalize: hydrogen directly bonded to carbon is not always alkyl; consider what that carbon is bonded to (O, N, halogen, carbonyl) to predict chemical shift accurately.
Remember that hydrogens on oxygens or nitrogens do not typically participate in splitting for neighboring carbons in the n+1 rule.
If you obtain fractional integration values, multiply all values by a common factor to convert to whole-number ratios.
In exams, you may be given a problem with a spectrum and asked to decide which signal corresponds to a particular hydrogen or to predict the spectrum for a given molecule. Follow the same workflow: count signals, determine multiplicities, check integrations, and verify chemical shifts with the correlation table.