Lesson 12: Pulse Contour Analysis Summary
Lesson 12: Pulse Contour Analysis Overview
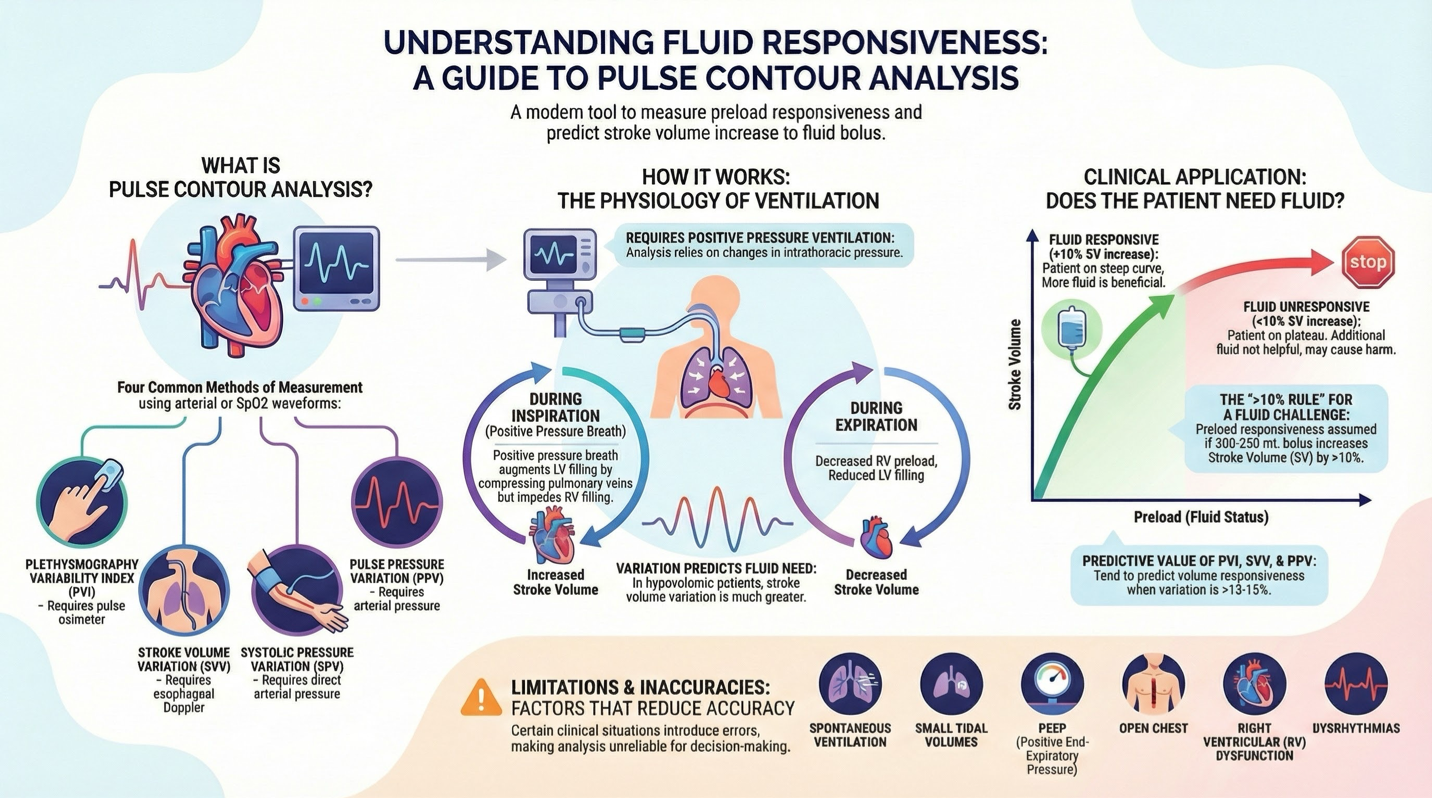
Measures preload responsiveness through various methods:
Plethysmography Variability Index (requires pulse oximeter)
Stroke Volume Variation (requires esophageal Doppler)
Systolic Pressure Variation (requires direct arterial pressure)
Pulse Pressure Variation (requires arterial pressure)
Conditions for Accurate Measurement
Requires positive pressure ventilation for accuracy.
Hypovolemia increases stroke volume variation due to intrathoracic pressure effects.
Clinical Implications
Preload responsiveness indicated by a ≥ 10% increase in stroke volume (SV) upon administration of 200-250 mL fluid.
A calculated fluid responsiveness threshold of 13-15% in dynamic measures predicts volume responsiveness.
Administration of Fluids
Monitor SV changes with fluid boluses:
If SV increases > 10%, consider further 200-250 mL boluses.
Maximize fluid therapy until SV changes < 10% (optimal Starling curve position).
If plateau is reached, assess other interventions (vasoactive drugs) if hypotension occurs.
Limitations of Pulse Contour Analysis
Several factors can reduce accuracy:
Spontaneous ventilation
Small tidal volume
PEEP
Open chest
Right ventricular dysfunction
Dysrhythmias