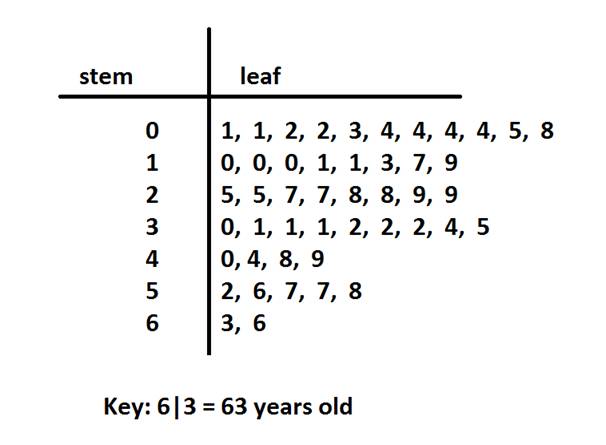
Visual Analysis of Data
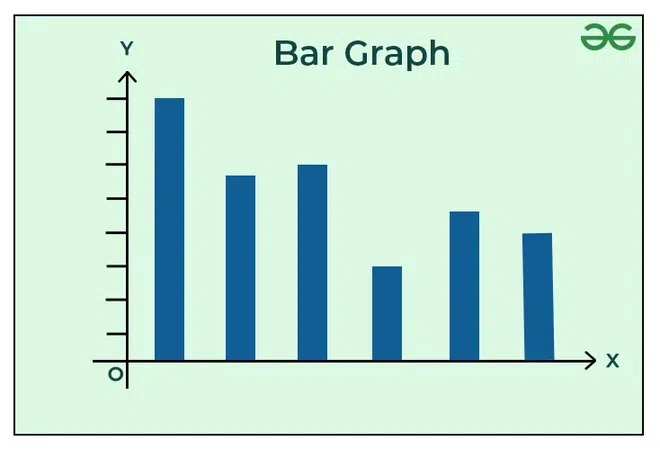
Bar graphs - for data that counts the number of things in a given category
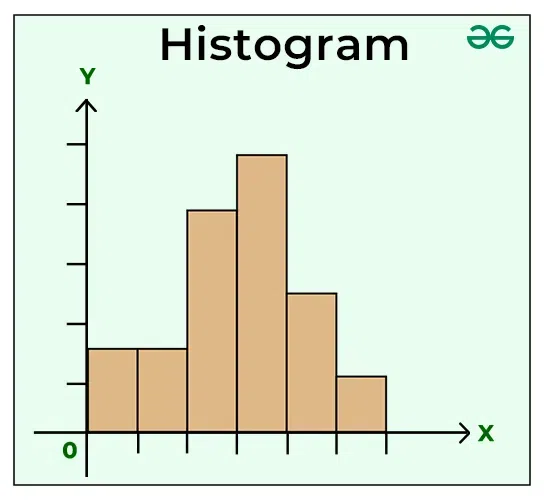
Histograms - for data that counts the number of things in a given numerical range
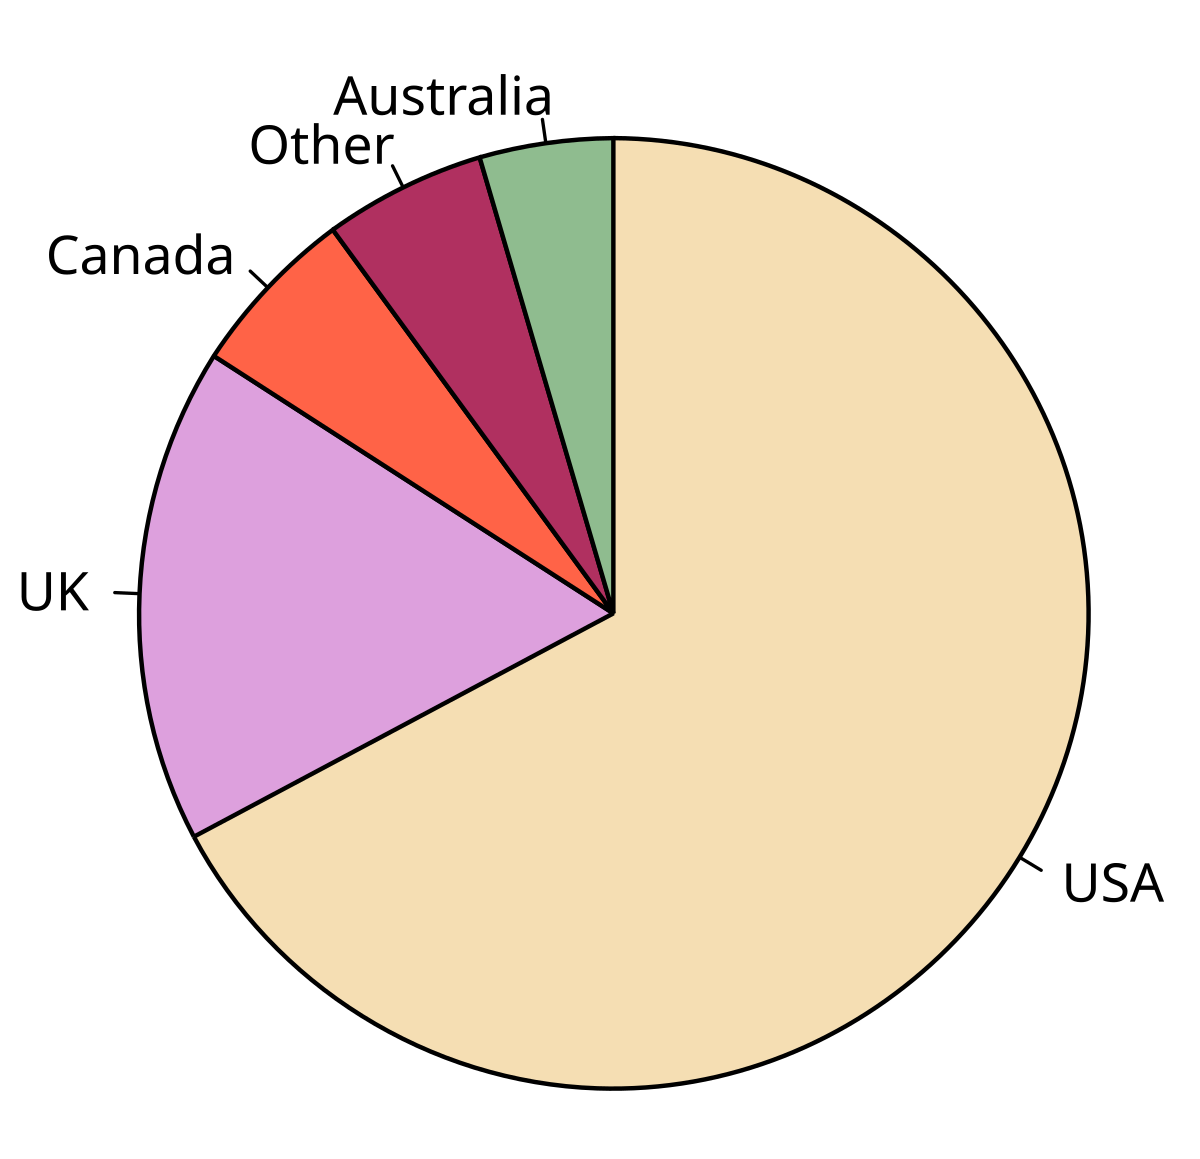
Pie chart - represents data as slices of a pie
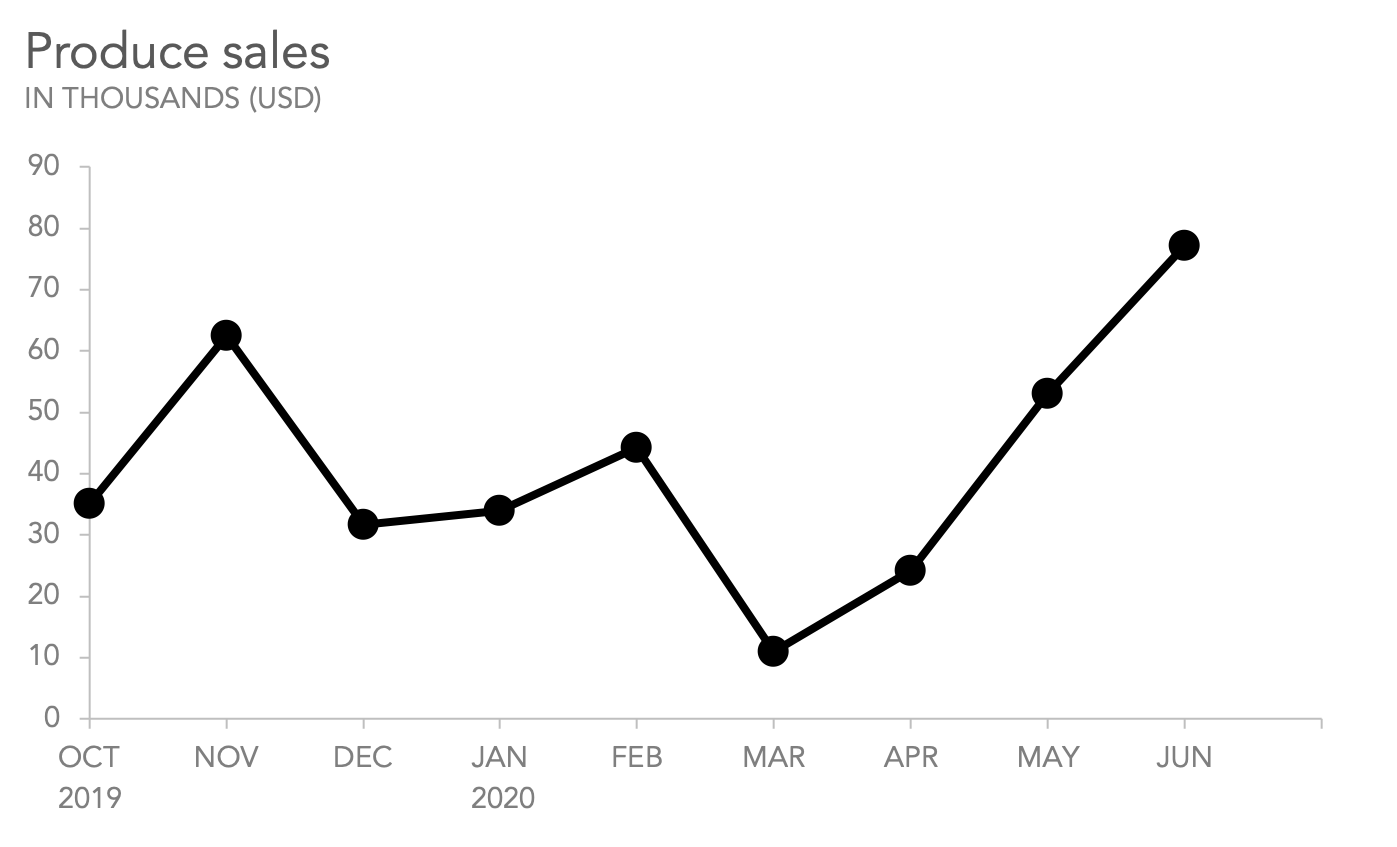
Line plot - plot numerical data points, then connect points with line segments
Stem and Leaf plots - observations are sorted and displayed according to, for example, the tens digit and ones digit