Application of Statistical Analysis:
Definition (#f7aeae)
Important (#edcae9)
Extra (#fffe9d)
Correlation:
Examines whether 2 variables covary.
Meaning if 1 variable tends to get larger as the other variable gets larger.
Designed to examine linear relationships between variables.
The relationship between 2 measures for each individual in a bivariate distribution is studied using statistical methods.
Visualizing correlations: Scatterplots
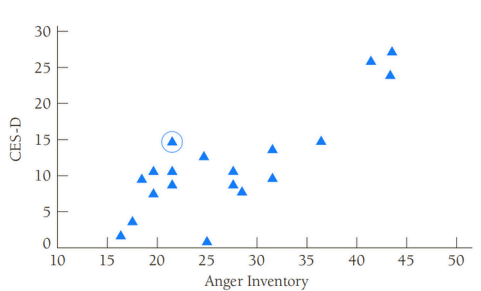
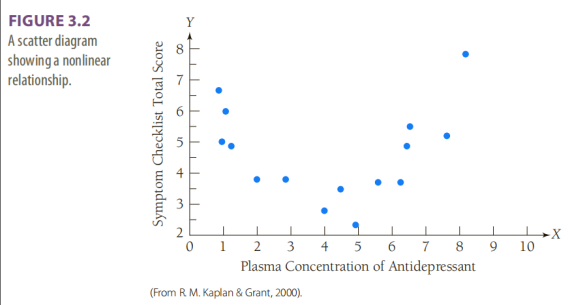
Scatter diagram: A visual display of the relationship between 2 variables.
Shows the relationship between two scores for each individual.
The scales for the 2 variables are represented on the axes of the plot.
Each point on the diagram represents the scores for 1 person on both variables.
Examining a scatter diagram helps determine if a linear relationship is appropriate.
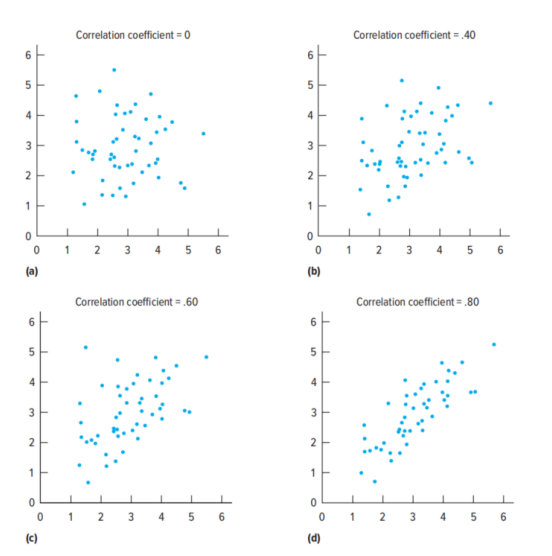
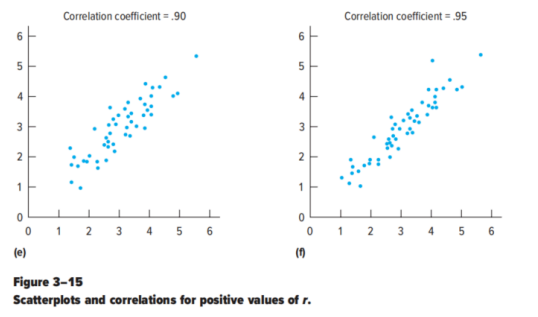
Correlation coefficients:
Positive:
Negative:
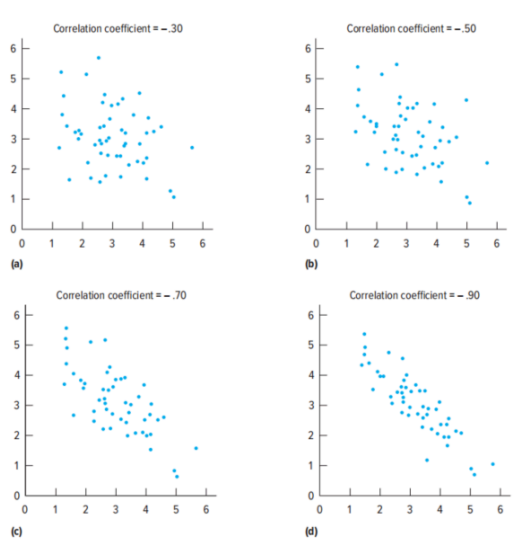
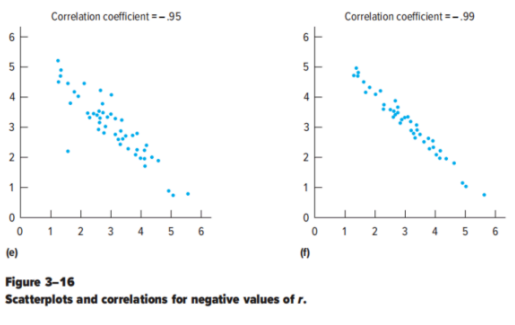
Direction and Magnitude: Correlation Coefficients
Correlation coefficient: A mathematical index that describes the direction and magnitude of a relationship between 2 variables.
The Pearson product moment correlation coefficient is a commonly used type, particularly for two continuous variables.
The Pearson correlation coefficient can take on any value from -1.0 to +1.0.
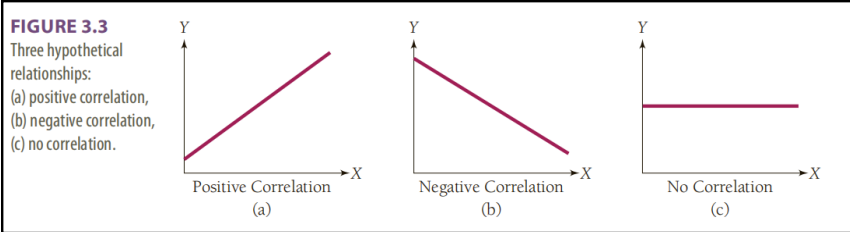
Interpreting the correlation coefficient:
Positive correlation:
As one variable increases, the other also increases.
High scores on 1 variable are associated with high scores on the other.
Low scores on 1 variable correspond to low scores on the other.
Negative correlation:
As one variable increases, the other decreases.
High scores on 1 variable are associated with lower scores on the other.
Lower scores on 1 variable are associated with higher scores on the other.
No correlation:
The variables are not related.
Scores on 1 variable do not provide information about scores on the other.
Magnitude: Indicates the strength of the association.
Absolute value of the coefficient.
A coefficient closer to +1.0 or -1.0 indicates a stronger linear relationship.
Types of psychometric analysis with correlation:
Criterion Validity Evidence:
Correlation is commonly used to determine the criterion validity evidence for a test.
Examining the relationship between a test score (the predictor) and scores on a well defined criterion measure.
Assessing Item Internal Structure:
Related to construct validity.
Examining how items within a test relate to one another.
Correlation forms the basis for methods used to assess the internal structure of an instrument.
Convergent and Discriminant Validity:
Related to construct validity.
Correlation is central to the multimethod-multi-trait (MTMM) analysis procedure, which is used to assess convergent and discriminant validity.
Reliability Analysis:
Related to test-retest validity.
Correlation coefficients are also used in assessing the reliability or internal consistency of a measure.
While reliability is a necessary condition for validity, it is technically distinct from validity.
Conducting Correlation Analysis:
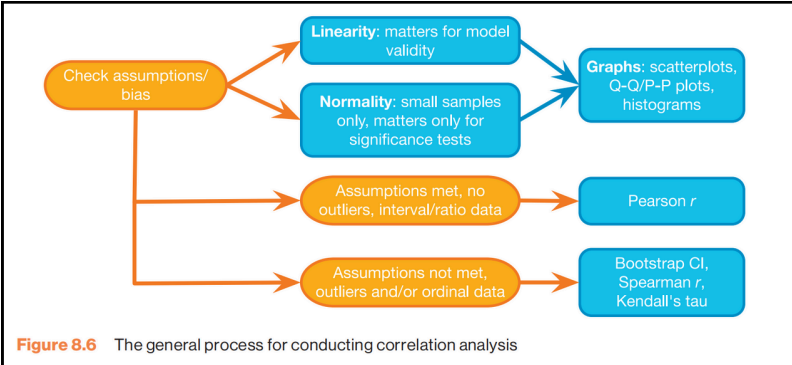
Important Considerations for Correlation:
Correlation-Causation Problem:
Just because 2 variables are correlated doesn’t necessarily imply that 1 caused the other.
Ex: Correlation between TV viewing and aggression doesn't prove TV causes aggression; an aggressive child might prefer watching TV.
Experiments are typically required to establish causality.
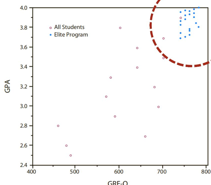
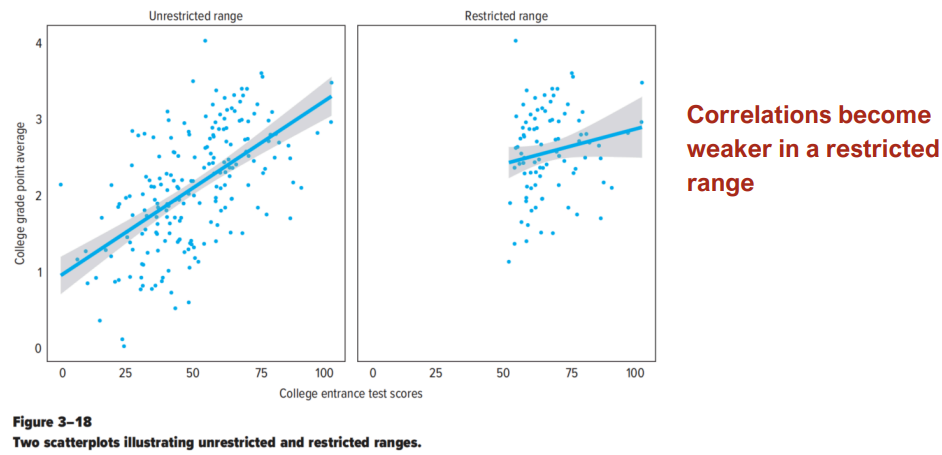
Restricted Range:
Correlation and regression use variability in 1 variable to explain variability in another.
If the range of variability is restricted for 1 or both variables, it can be difficult to demonstrate a relationship, even if one truly exists in the full population.
Correlation requires variability.
Ex:
Studying the correlation between A-level grades and university performance, but only looking at students who got into Oxford or Cambridge.
Problem: You're only seeing students with AAA* grades - the range is restricted to high achievers.
Result: Correlation appears weak because everyone has similar high grades, but if you included students with C grades who went to other unis, the correlation would be much stronger.
Factor Analysis:
Factor analysis: Summarises the interrelationships among a large number of variables.
It’s a data reduction technique:
Goal: To identify a smaller set of underlying dimensions or concepts, called factors, that can represent the original variables.
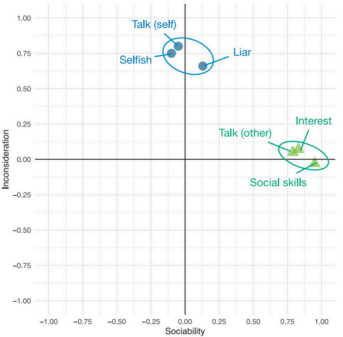
Like finding "clumps" or "groups" of variables that correlate highly with each other. These groups are assumed to reflect an underlying factor.
Use:
Understanding the structure of variables:
Explore the underlying dimensions of complex concepts like intelligence or personality.
Questionnaire development and evaluation:
Design and validate questionnaires to measure things you can't observe directly (latent variables), such as "burnout".
Factor analysis helps ensure the items measure the intended underlying concepts.
Data reduction:
Reduce a large set of variables to a more manageable size while keeping as much of the original information as possible.
This can also help with problems like multicollinearity in regression.
Factors vs Components:
Factor Analysis (FA) and Principal Component Analysis (PCA).
They are similar techniques aiming to reduce variables into a smaller set of dimensions ("factors" in FA, "components" in PCA).
PCA:
Tries to explain the maximum amount of total variance in the data by transforming original variables into linear components.
It assumes no measurement error.
FA:
Estimates underlying latent variables (factors) from a mathematical model, focusing on explaining the common variance (shared variance) among variables.
It includes an error term.
PCA is often preferred for simply summarizing data, FA is if you are interested in a theoretical solution uncontaminated by unique and error variability.
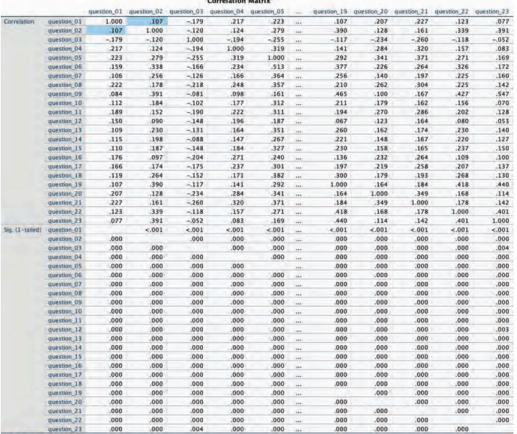
Correlation Matrix:
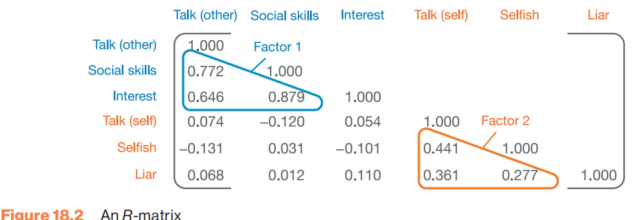
Factor analysis begins with correlation matrix.
A table showing the correlation coefficient (-1.00 to +1.00) between every pair of variables included in the analysis.
Variables that measure a common underlying factor are expected to intercorrelate quite strongly.
Visually inspecting a large correlation matrix is difficult to discern underlying patterns, hence factor analysis techniques are needed.
Steps:
Assess the suitability of the data for factor analysis:
Check sample size and the strength of relationships among variables.
Data suitability
Extract the factors: Determine the number of factors that best represent the relationships among variables.
Rotate and interpret the factors: Rotate the factors to make the pattern of loadings easier to understand and then interpret the meaning of each factor.
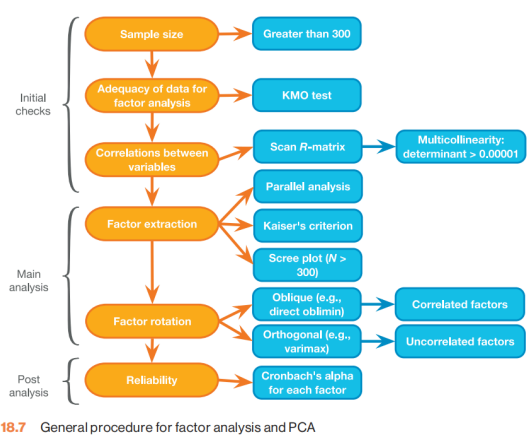
Data Suitability:
Sample Size:
Sample size is important because correlations from small samples are less reliable.
Recommendations vary, but larger samples are better. Ex: At least 300 cases.
Some authors recommend a ratio of participants to items, such as 10 cases per item, or at least five cases per item.
Check published research in your field to see what is considered acceptable.
Correlation Matrix Adequacy:
Look for sufficient correlations: The correlation matrix should show at least some correlations of around r = .3 or greater.
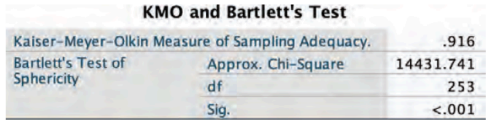
Bartlett's Test of Sphericity:
Tests whether the correlation matrix is significantly different from an identity matrix (which would indicate variables are uncorrelated).
A statistically significant result (p < .05) suggests the data is suitable for factor analysis.
Kaiser–Meyer–Olkin (KMO) Measure of Sampling Adequacy:
Assesses how well the data is suited for factor analysis.
KMO varies between 0 and 1. A value of 0.6 or above is considered the acceptable limit.
The KMO can also be calculated for individual variables; these should also be above 0.5, ideally.
Check for problematic correlations:
Look for variables with very low correlations with most others or extremely high correlations (r = 0.9 +) with another variable.
These might need to be removed.
Factor Analysis:
Once you've decided the data is suitable, you need to decide how many factors to extract.
Several techniques exist: Principal Components, Principal Axis Factoring, Maximum Likelihood.
Principal Axis Factoring is common in SPSS.
Methods for deciding the number of factors:
Kaiser's Criterion.
Scree Test.
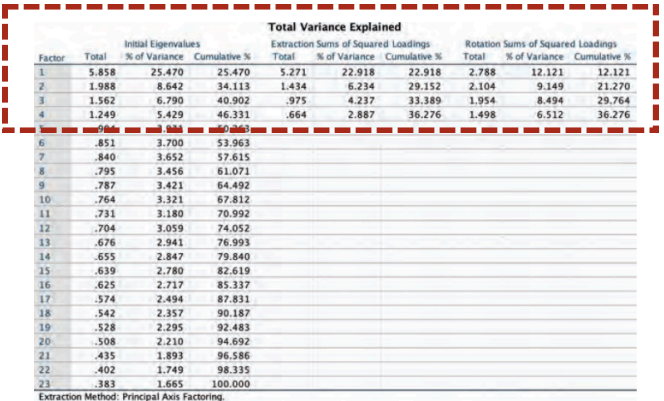
Kaiser’s criteria:
Retain factors with an eigenvalue greater than 1.
Eigenvalues represent the amount of variance explained by a factor.
This method can sometimes overestimate the number of factors.
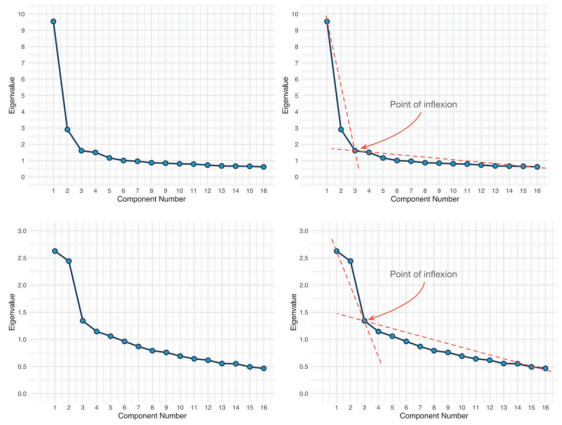
Scree test:
Plot the eigenvalues and look for an "elbow" or point where the curve flattens out.
Retain factors above the elbow.
Rotation:
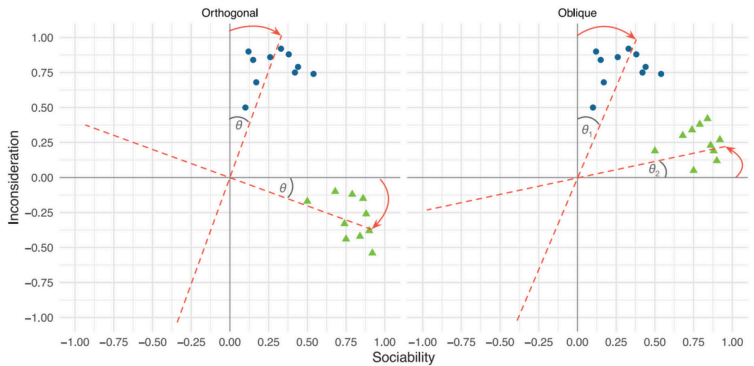
After extracting factors, they are rotated.
Rotation does not change the underlying solution or how much variance is explained; it just makes the pattern of factor loadings easier to interpret.
2 types:
Orthogonal Rotation:
Factors are kept uncorrelated (at right angles).
Simpler to interpret and report.
Ex: Varimax.
Oblique Rotation:
Factors are allowed to be correlated.
Often preferred if you expect the underlying factors to be related.
The pattern matrix in oblique rotation shows the unique contribution of a variable to a factor, which can aid interpretation.
Ex: Promax.
Interpreting Factors & Factor Loadings:
Once factors are rotated, interpret them by looking at the factor loadings.
Factor loadings are like correlation coefficients between each original variable and each factor.
They range from -1.00 to +1.00.
A high loading indicates that the variable is strongly associated with that factor.
Simple structure: You want each variable to have a high loading on only one factor and low loadings on all others.
Naming factor: Based on the variables that load highly on a factor, you make a reasoned judgment to infer the common underlying concept they all measure and give the factor a name.
Ex: SPSS Anxiety Questionnaire (SAQ).
Spss Anxiety Questionnaire (SAQ):
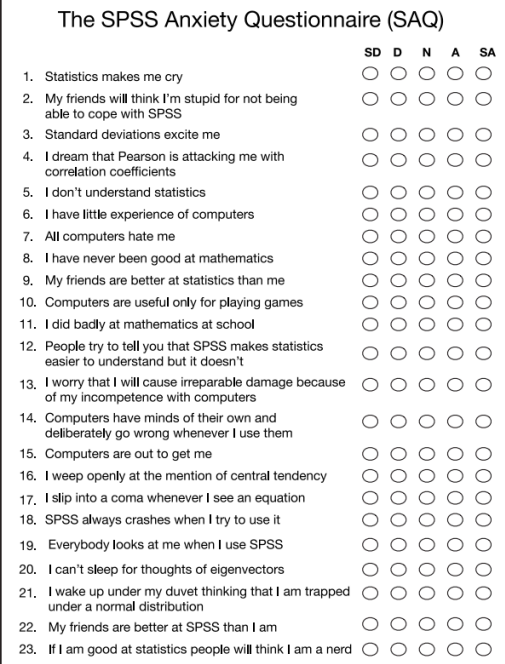
A 23-item questionnaire to measure "SPSS anxiety".
Factor analysis was conducted to see if anxiety could be broken down into specific forms (latent variables).
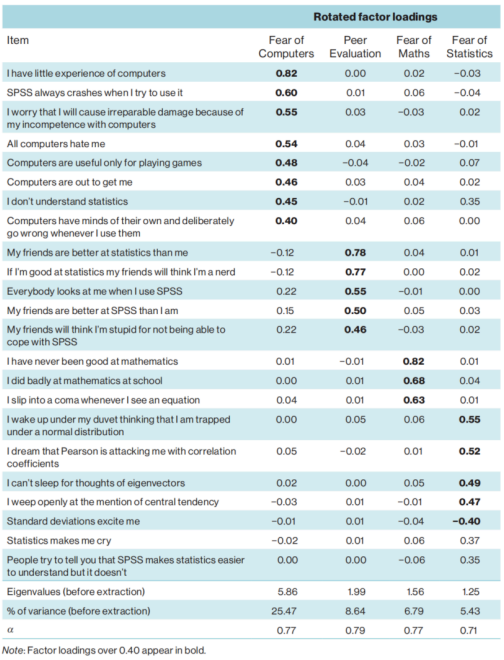
Data suitability was assessed (sample N=2571, KMO=0.92 "marvellous", individual KMO > 0.84).
Using parallel analysis, 4 factors were suggested. An oblique rotation (Direct Oblimin) was used, as the factors were expected to be related.
The rotated factor loadings showed items loading onto four distinct factors, which were interpreted and named based on the item content:
Factor 1: Fear of Computers.
Factor 2: Fear of Negative Peer Evaluation.
Factor 3: Fear of Mathematics.
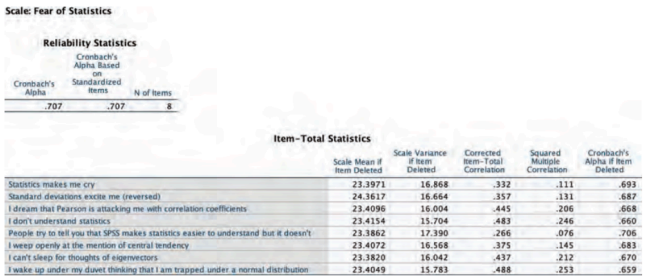
Factor 4: Fear of Statistics.
This analysis suggested the SAQ measures four sub-components of SPSS anxiety.
Follow up: Reliability Analysis
If using factor analysis to develop or evaluate a questionnaire with multiple factors (subscales), it's crucial to assess the reliability of the items within each subscale.
Reliability analysis (Cronbach's alpha, α) measures the internal consistency of the items within a scale or subscale – how well they stick together.
Cronbach's alpha should be calculated for each subscale separately, not for the entire collection of items if multiple factors exist.
Need alpha values around 0.7– 0.8 or higher for research scales.
Reporting Factor Analysis Results:
Include:
Sample size (N).
Method of factor extraction used (Principal Axis Factoring).
Criteria used to determine the number of factors retained (Parallel Analysis, Scree Test, Kaiser's Criterion).
Type of rotation used (Direct Oblimin - oblique).
Measures of data adequacy (KMO value and Bartlett's test result).
Total variance explained by the retained factors. A table of the rotated factor loadings, often with significant loadings (e.g., > |0.40| or |0.30|) highlighted.
Interpretations or names given to each factor based on the items that loaded highly on it.
Screeplot and table of unrotated loadings (Optional but recommended for thesis/dissertations).
Applying factor analysis:
Factor analysis is vital to many theories of intelligence.
Used to understand the structure of the latent variable 'intelligence'.
Crucial for establishing the construct validity of IQ measures.
Provides the rationale for the structure of widely used intelligence tests like the Wechsler scales and the Stanford-Binet.
It has been applied to large batteries of ability tests to identify a smaller number of basic, underlying abilities (factors).
Helps in interpreting the nature of these underlying abilities by examining which tests load highly on which factors.
Factor analysis is used to develop and validate questionnaires.
It can be used to construct a questionnaire to measure an underlying variable (e.g., burnout, SPSS anxiety).
By analysing responses to a large number of items, factor analysis can identify underlying dimensions or subscales within the questionnaire.
Helps determine if a set of variables measures the same underlying dimension or multiple subcomponents.
When used to validate a questionnaire, it is useful to also check the reliability of the scales identified by the factor analysis.
Reliability analysis confirms that scores consistently reflect the construct being measured.