PSYCH211-25A (week 7)
Inferential Statistics
Probability distributions
Discrete
Continuous
Probability distribution - a way to link a possible value of a variable with the probability of occurrence
Characteristics:
caqn be any shape
represented by curve
area under the curve represents the probability
total area under the curve is always 1
area under the curve between x values represents the probability of getting those x values
Example: Chi-Square
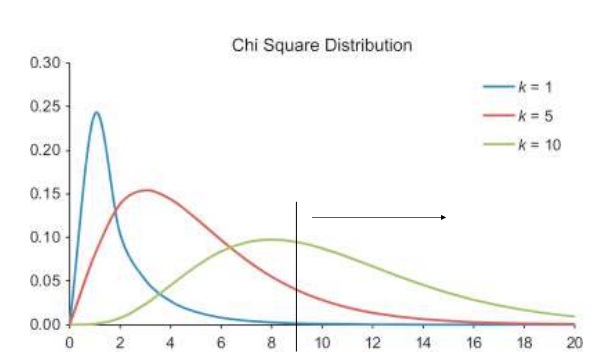
The higher the function (density) the more likely a value
area under the curve gives us probability
most concerned with normally distributed variables
i.e - IQ scores
to aid both understanding and calculations, it is often good to standardise the variable in question
Standard normal distribution:
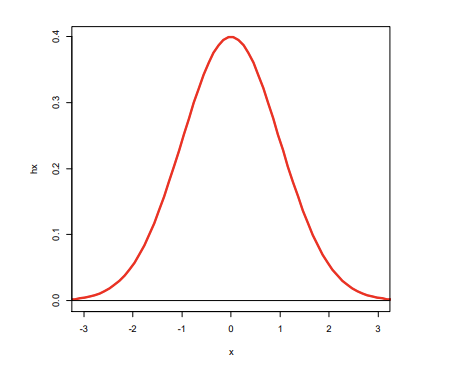
Standard normal distribution - a normal distribution with a mean of 0 and standard deviation of 1
ANY normal distribution of scores can be transformed into the standard normal distribution
when we do this, we call the new variable z-scores
z-scores - the number of standard deviations a value is away from the mean
Z-Scores:
give us a marker to calculate area under the curve
dont have to use the whole standard deviations
all we need is a shape to calculate the area
Inferential statisitcs:
inferential statistics - a set of statistical procedures to test hypotheses about a population
Sampling error - differences between a population parameter and sample statistic that is the result of the sampling procedures
sampling error is unknown in real life because we do not know the population parameter
Sampling distributions:
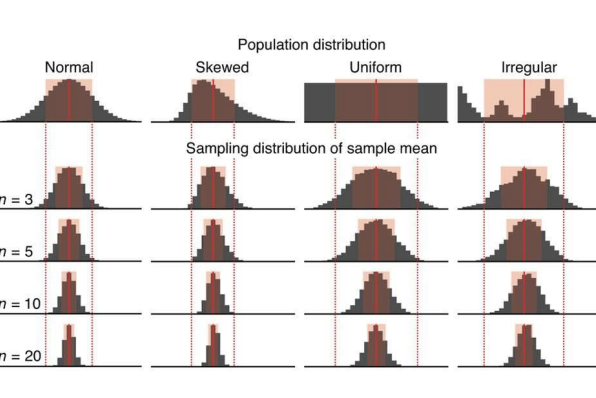
Sampling distribution - a distribution of a sample statistic (usually the mean) that would occur if we took an infinite number of samples from a population
governed by the central limit theorem
The SD of the sampling distribution of a mean is also known as the standard of error
Standard error - the average sampling error we can expect in our sample
Confidence interval:
confidence interval - an interval estimate of a population parameter from a sample statistic
relies on standard error
confidence level: 99%,95%,90%
interval - spread consisting of a lower limit and an upper limit
Upper bound: Mean +
Lower Bound: Mean -
NSHT:
NSHT - the process by which researchers determine if their data supports or fails to support their hypothesis
based on probability theory
Null hypothesis
a treatment has no effect
our variables are not related
our results come from the same population
Four steps in Hypothesis testing:
1) State your hypothesis
2) set the criterion for burden of proof (alpha level)
3) Collect data and calculate stats
4) make a decision about the null hypothesis according to the criterion in step 2
Two types of inferential errors
Type 1 error
Type 2 error