Parallel, perpendicular and graphs
Parallel and perpendicular
- Parallel lines have the same gradient
- These three lines all have a gradient of 2
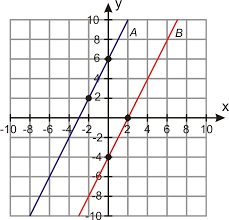
- Perpendicular means at right angles
- If a line has gradient m then any line perpendicular to it will have the gradient -1/m
Working it out
- Draw a sketch to find the gradient of line L
- The line slopes down/up so the gradient is negative/positive
- Use -1/m to calculate the gradient of P
- If m is a fraction you can just find its reciprocal and change the sign
- You might know P passes through() so you could use m=x and c=y to write the equation of line P
- Check it
- If two lines are perpendicular the product of their gradient is the equation
Mid-points
- A line segment is a short section of a straight line
- You can find the mid-point of a line segment if you know the coordinates of the ends
- Coordinates of mid-point = average of x-coordinates, average of y-coordinates
Quadratics
- Quadratic equations contain an x^2 term
- Quadratic equations have curved graphs
- You can draw the graph of a quadratic equation by completing a table of values
Drawing quadratic curves
- Use a sharp pencil
- Plot the points carefully
- Draw a smooth curve that passes through every point
- Label your graph
- Shape of graph will be either u or n
- Drawing a smooth curve
- It’s easier to draw a smooth curve if you turn your graph paper so your hand is inside the curve
- Check it
- All the points on your graph should lie on the curve
- If one of the points doesn’t fit then double check your calculations
Graphs
- You might need to draw or interpret cubic and reciprocal graphs in your exam
- You can use a table of values to draw any graph, but it helps if you know what the general shape of the graph is going to be
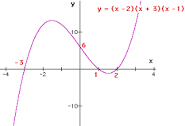
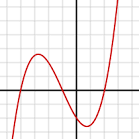
Cubic graphs
- Graphs that contain an x^3 term and no higher powers of x are called cubic graphs
- Here are two examples
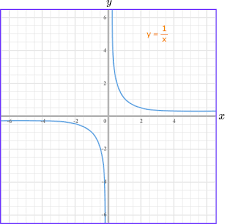
Reciprocal graphs
- Graphs of the form y = k/x where k is a number are called reciprocal graphs
- Here are two examples
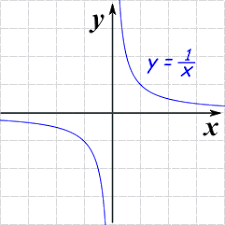
Tips
- The graphs get closer and closer to the x-axis and y-axis but never touch them
- With a cubic graph if you recognise the shape of the graph then it’s easier to tell if you’ve plotted your coordinates correctly